
The last Housing Market Review covered data reported in September for August, 2016. At that time, iShares US Home Construction (ITB) started a notable divergence from the performance of the S&P 500 (SPY). That divergence widened in October with the S&P 500 losing 1.9% month-to-date and ITB tumbling 6.8%. The selling in ITB has been nearly relentless with two of the steepest losses occurring in the previous week. The steep drop in the wake of new home sales was the most ironic given those sales were the second highest in this post-recession period.
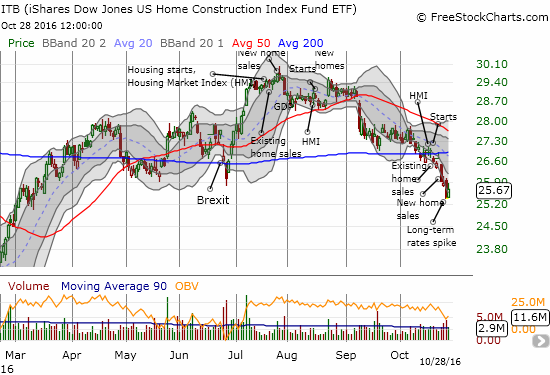
Home builder stocks seem weighed down most by the interest rate environment. In such an environment, all reported data looks very backward-looking and nearly irrelevant. The constant selling in October seemed to indicate as much. In the last month several indicators displayed some slowing yet home builder sentiment was strong. This time around, home builder sentiment dropped slightly while the data made some notable achievements.
New Residential Construction (Housing Starts) – September, 2016
After four straight months of downward revisions, housing starts for single-family homes finally received an upward revision. August’s privately owned 1-unit housing starts went from 722,000 units to 724,000. September starts increased 8.1% month-over-month and 5.4% year-over-year to 783,000. Single-family starts have not been this high since the surge in February, 2016.
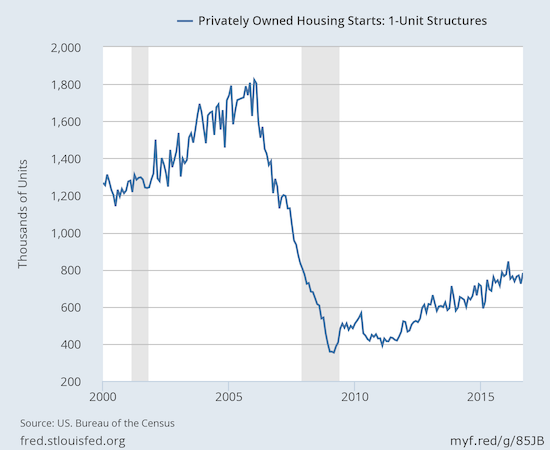
Source: US. Bureau of the Census, Privately Owned Housing Starts: 1-Unit Structures [HOUST1F], retrieved from FRED, Federal Reserve Bank of St. Louis, October 29, 2016.
Starts increased year-over-year across all regions. Only the West fell month-over-month (2.2%). This unison is quite a contrast from the very mixed performance from August when only large gains in the South prevented overall housing starts from going negative. In other words, housing starts are back on track and mirroring the strong confidence of home builders (although still woefully lagging behind levels that National Association of Realtors would like to see!).
Existing Home Sales – September, 2016
July ended a four-month streak of gains for existing home sales and represented the first year-over-year decline since November, 2015 and only the second such decline in the previous 21 months. August delivered another monthly decline but resumed (marginally) the year-over-year gains. September put existing home sales on solid footing. The seasonally adjusted annualized sales of 5.47M were up 3.2% month-over-month from a downwardly revised 5.30M in sales for August. Year-over-year sales saw a gain of 0.6%.
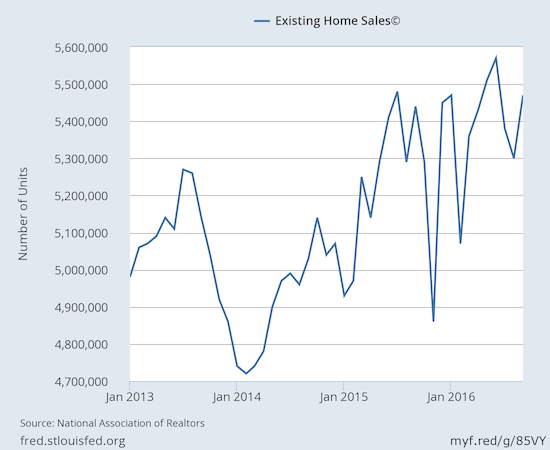
Source: National Association of Realtors, Existing Home Sales© [EXHOSLUSM495S], retrieved from FRED, Federal Reserve Bank of St. Louis, October 30, 2016.
Last month, while the National Association of Home Builders (NAHB) heralded rising household incomes as a driver of “more serious buyers,” the National Association of Realtors (NAR) also worried that these same incomes are NOT translating into sales of existing homes. THIS month, first-time buyers stepped up and propelled existing home sales – a contrast to last month’s lamenting of the hollowing out of the middle class.
“The home search over the past several months for a lot of prospective buyers, and especially for first-time buyers, took longer than usual because of the competition for the minimal amount of homes for sale,” he said. “Most families and move-up buyers look to close before the new school year starts. Their diminishing presence from the market towards the end of summer created more opportunities for aspiring first-time homeowners to buy last month…
There’s hope the leap in sales to first-time buyers can stick through the rest of the year and into next spring…The market fundamentals — primarily consistent job gains and affordable mortgage rates — are there for the steady rise in first-timers needed to finally reverse the decline in the homeownership rate.”
The NAR has suddenly replaced the alarms with the pangs of optimism. September’s rise in sales was described as “strong” and “convincing.” In the press conference, the NAR surmised that this month’s data say that despite affordability issues, people are ready and willing to buy. For example, buyer traffic was higher than a year ago. First-time home buyers were 34% of all buyers. This share is the highest since July, 2012. First-timers averaged 30% of sales for 2015.
Housing inventory bounced back on an absolute basis from August’s whopping year-over-year decline of 10.1%. For September, inventory increased 1.5% from August to 2.04M homes. This inventory is still a year-over-year decline of 6.8%. Inventory has now declined year-over-year for 16 straight months. Months of inventory marginally decreased from 4.6 to 4.5 months of supply.
Investors perked up yet again as a share of sales. In September that share rose to 14% from 13% in August. The share was 11% in July. As context, recall July’s share was the lowest share since 9% in July, 2009. In February, investors bought 18% of existing homes which was the highest share since April, 2014.
In May and June, the West was the only region in the country to experience year-over-year drops in exiting home sales. In July, every region suffered year-over-year declines. In August, no region experienced a year-over-year decline. In September, the South was the only region to experience a year-over-year decline: the Northeast was flat for the second month in a row, the Midwest gained 2.3%, the South decreased 0.9%, and the West climbed 1.6%.
September’s 5.6% year-over-year increase in the median price of an existing home represents the 55th consecutive month of year-over-year increases. August’s median price across all housing types of $234,200 is the third monthly decline (August was $240,200) after June set an all-time record of $247,700. Could this new trend of monthly price declines finally deliver the cooling that will bring more buyers to the market? This development is worth watching closely.
Single-family home sales fared roughly the same as overall existing sales. Single-family sales increased on a monthly and yearly basis. The median price declined from August’s $242,200 but increased on a year-over-year basis…
“Single-family home sales increased 4.1 percent to a seasonally adjusted annual rate of 4.86 million in September from 4.67 million in August, and are now 0.6 percent above the 4.83 million pace a year ago. The median existing single-family home price was $235,700 in September, up 5.6 percent from September 2015.”
New Residential Sales – September, 2016
New home sales were the big headline in August as July sales soared to a fresh post-recession high. I am still predicting this post-recession peak will not get challenged until the next Spring selling season. August’s new single-family home sales pulled back, but September’s sales rebounded a bit.
New single-family home sales hit 593,00 for September, marking an increase of 3.1% from August’s 575,000 sales (a significant downward revision from the originally reported 609,000 sales). Sales increased 29.8% year-over-year which maintains a torrid pace: August was up 20.6% year-over-year, July was up 31.3% year-over-year, and June was up 25.4% year-over-year.
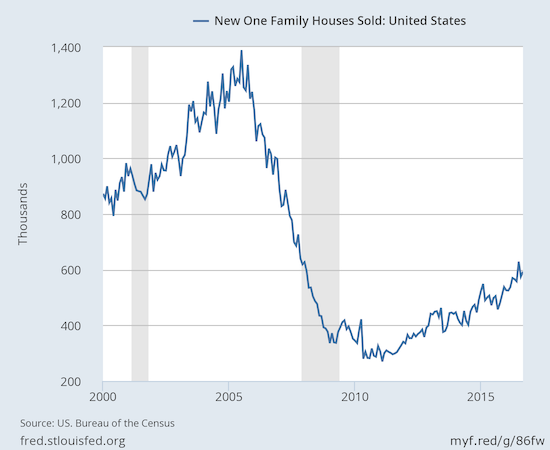
Source: US. Bureau of the Census, New One Family Houses Sold: United States [HSN1F], retrieved from FRED, Federal Reserve Bank of St. Louis, October 30, 2016.
New home inventory increased slightly from 4.6 to 4.8 months of supply. Inventory was 4.3 months in July and 4.9 months in June.
The West continued its turnaround from laggard to bright spot in the new home sales report. In the 5 months prior to June, the West suffered year-over-year declines in sales. The West had a robust summer with year-over-year sales increases of 24.6% (3rd ranked region), 11.4% (4th ranked region), and 35.0% (2nd ranked region), June through August respectively. September delivered a 32.4% year-over-year gain (3rd ranked region right behind the Midwest’s 33.3%). The Northeast gained a whopping 60% year-over year. The South picked up the rear with 25.7%.
Home Builder Confidence: The Housing Market Index– September, 2016
The Housing Market Index (HMI) started the year at 61 and then went four straight months at 58. In June, the HMI came to life again with a jump to 60 but dropped back to 58 for July. For August, the HMI was revised downward from 60 to 59 which made September’s 65 reading and post-recession high look like an even stronger jump. This month’s dip to 63 looks like a slight dip in comparison and no cause for concern. Indeed, the NAHB noted “even with this month’s drop, builder confidence stands at its second-highest level in 2016, a sign that the housing recovery continues to make solid progress.”
Two of the three components of the HMI fell. Significantly, the component for sales expectations in the next six months rose by one. So builders are effectively as optimistic as ever looking ahead.
Click for a larger view…
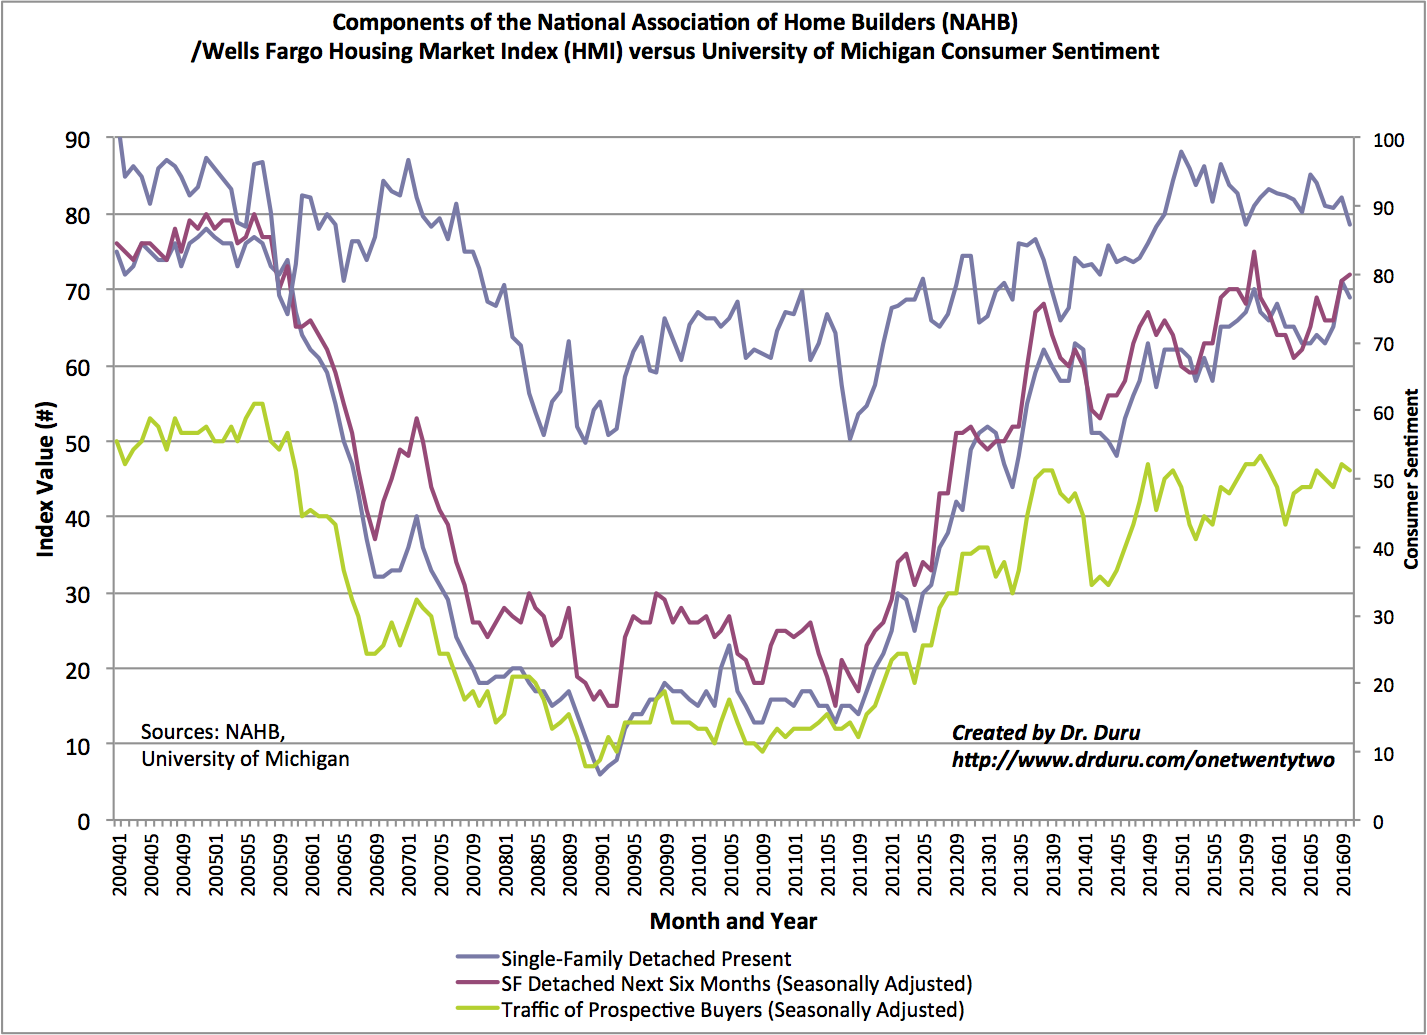
Source: The National Association of Home Builders (NAHB)
On a regional basis, the West took a big step backward. The West’s HMI plunged from 82 in August to 74. Fortunately, this is still the second highest HMI for the West since December, 2015. I will be looking to see whether the overall housing data for the West slip a bit in coming months. The South also came off a major high. The Northeast and Midwest increased.
Parting thoughts
Overall, the housing data looks as good as ever. Unfortunately, the stocks of home builders are looking bad and getting worse. The chart of ITB above tells the entire story with the spike in long-term rates adding an exclamation mark.
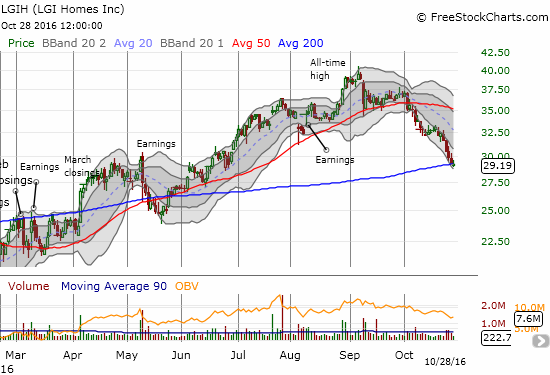
The charts of individual home builders range from confirmed breakdown to hanging on a thread. In the last Housing Market Review I noted the divergence between poorly performing large builders versus resilient smaller/regional builders. That divergence is much less pronounced now. For example, LGI Homes (LGIH) has gone all the way from resting comfortably on top of support at its 50-day moving average (DMA) all the way to breaking down to 200DMA support for a whopping 20.8% loss. I am pretty sure this loss is the largest one-month drubbing of all the home builders in my watch universe.
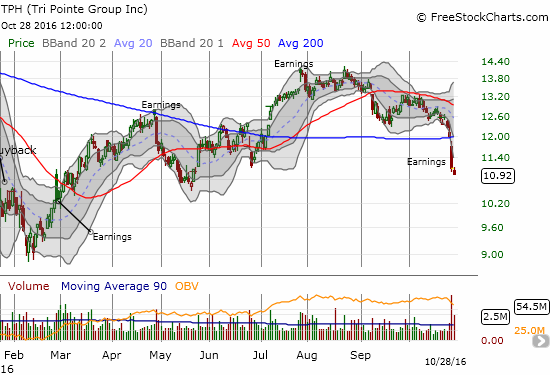
Tri Pointe Group (TPH) had the unfortunate double-whammy of reporting on the day of the big spike in long-term rates. TPH lost 7.5% on the day is down 17.1% month-to-date.
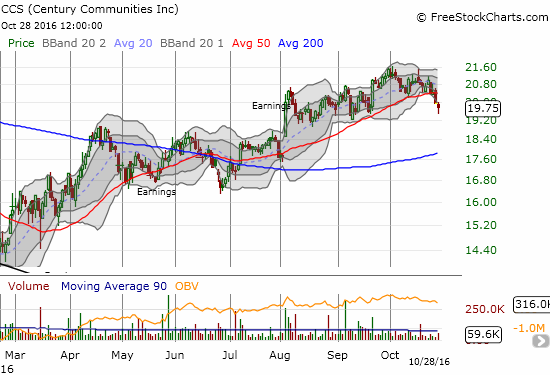
Only Century Communities (CCS) is hanging in there…by a thread. CCS broke down below 50DMA support on Thursday, but it looks like the September lows may hold as support for now.
The good news here is that some bargains are opening up just in time for the start of the seasonally strong period for home builders. By the next month’s Housing Market Review, I hope to discuss some of the better bargains to buy. The best buying opportunities may come in the days leading into and/or immediately following a near certain rate hike from the U.S. Federal Reserve in December.
Be careful out there!
Full disclosure: no positions