
(T2108 measures the percentage of stocks trading above their respective 40-day moving averages [DMAs]. It helps to identify extremes in market sentiment that are likely to reverse. To learn more about it, see my T2108 Resource Page. You can follow real-time T2108 commentary on twitter using the #T2108 hashtag. T2108-related trades and other trades are occasionally posted on twitter using the #120trade hashtag. T2107 measures the percentage of stocks trading above their respective 200DMAs)
T2108 Status: 69.2% (intraday high at 69.99% – again, you just can’t make this stuff up!)
T2107 Status: 72.8%
VIX Status: 11.4 (2-year low)
General (Short-term) Trading Call: neutral
Active T2108 periods: Day #122 over 20%, Day #28 over 30%, Day #27 over 40%, Day #26 over 50%, Day #3 over 60% (overperiod), Day #5 under 70%
Commentary
“…for the last 8 years, being positive is easier to make money.”
No truer words said by a trading friend of mine who essentially scolded me for my switch to bearishness this week. I wish I had a crystal ball, but at the time I made a judgement call that the S&P 500 (SPY) was close enough to a breakdown from its trading range. The earlier bearish divergence between the S&P 500 (SPY) and T2108 (the percentage of stocks trading above their 40-day moving averages (DMAs)) reinforced my confidence in moving forward with a bearish trading call. I now have flashbacks to post-Brexit trading where I made a very close call to stay bearish because T2108 had not quite plunged into oversold territory. In THAT case, the tremendous spike in volatility, the VIX, should have made me at least less confident in the judgement call. In the current case, the extremely low level of volatility (aka complacency) made me even MORE confident in my call.
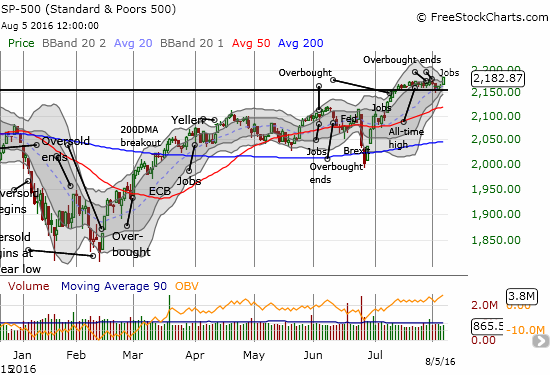
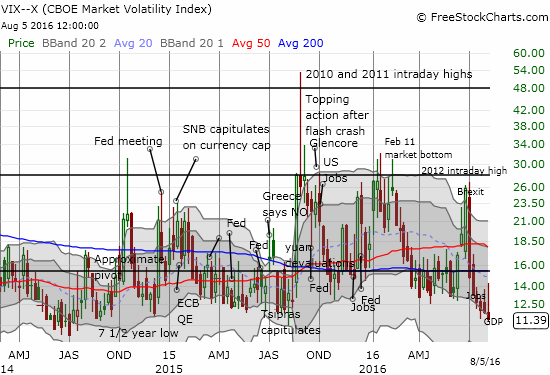
Note how a Bollinger Band (BB) squeeze is forming on the index. This move indicates a compression in volatility that will soon resolve into a big move up or down. Given volatility is so low, I am still inclined to believe that next move will be to the downside. T2108 did not help answer questions as it stopped just short of re-entering overbought conditions. The high was, incredibly enough, 69.99% before settling in for a close at 69.19% (overbought is defined as T2108 above 70%). Given the breakout in the S&P 500, I moved the trading call to neutral and will not go back to bearish until a breakdown occurs with confirmation. I will go to cautiously bullish if T2018 closes in overbought territory. I just cannot shake the deceptive calm of an extremely low VIX in the middle of what is historically the roughest period for the stock market in terms of average maximum drawdowns (August to October). This whole bullish setup looks like it is flirting with danger!
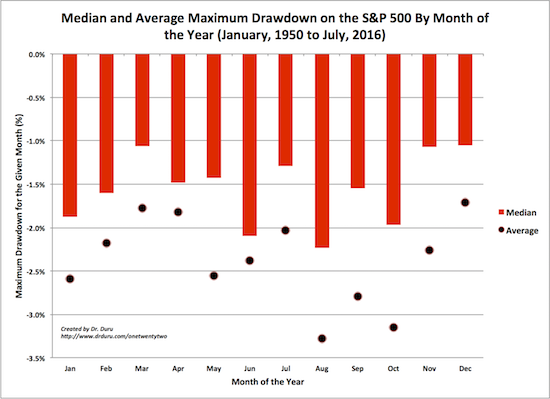
Note that the median maximum drawdowns on the S&P 500 are less dramatic than the average maximum drawdown because a few extremes can distort averages. So, the chart above shows that when it comes to extremely bad outcomes, August through October dominate. On a median basis, June replaces September as one of the worst three months for drawdowns. I defined drawdowns by the lowest close of the month.
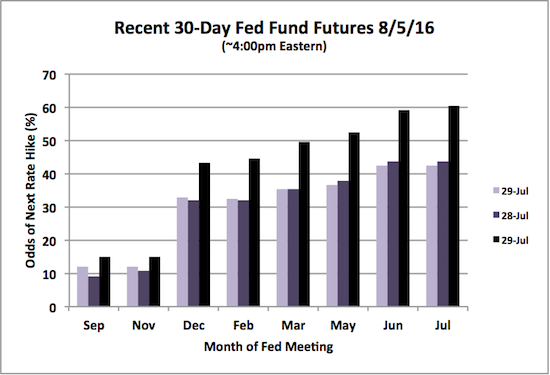
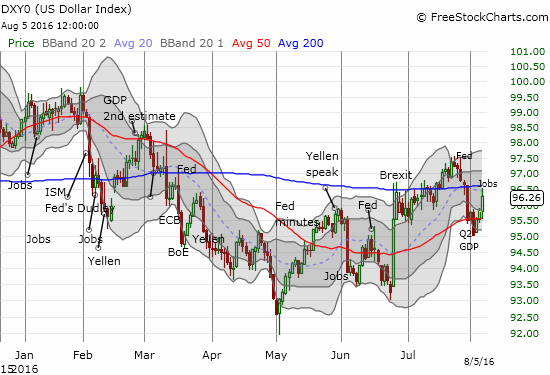
The S&P 500 closed at a new all-time high in the wake of a strong U.S. jobs report. While my bearish positions smarted, I was heartened to see the market actually respond positively to good economic news. I suspect the response occurred because of the renewed skepticism that the Fed will hike rates anytime soon and a growing recognition (acceptance) that the U.S. economy is one of the brightest sparks on the globe right now. The U.S. dollar (DXY0) strengthened accordingly although the odds for the next rate hike only moved from “don’t even think about it” to May, 2017.
Regardless, today’s reaction is a welcome relief from the whole system of good news is bad news because the Fed will kill the party with another tiny rate hike. Conversely, bad news is good news because the easy monetary conditions will continue.
In the last T2108 Update, I said a day like that day made it tough to stick to trading rules. Today’s rally was even tougher because I watched just about each bearish trade I placed in the prior two days melt like butter. However, nothing expressed my dismay more than the trade I ENDED in Apple (AAPL). As AAPL stumbled on Tuesday, almost half my profits in my call options disappeared. I decided that was enough of a signal to abandon the position even though expiration was not until the following week. On Friday, AAPL very nicely further confirmed its bullish post-earnings breakout above its 200DMA.
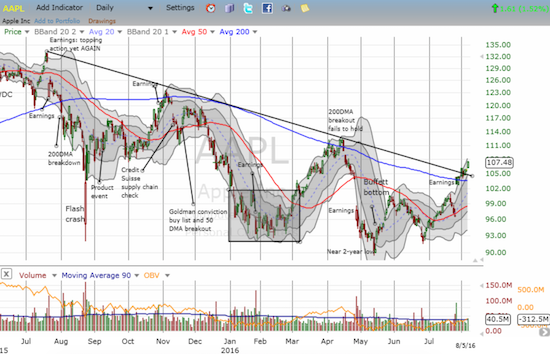
The path seems clear for AAPL to test the April high. In fact, my very next bullish trade will likely be to load back up on AAPL call options (maybe a spread) in anticipation of that retest by October earnings – intervening drawdowns notwithstanding.
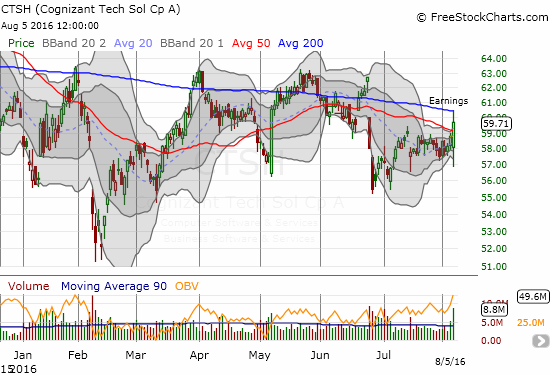
My dismay was compounded by a post-earnings trade on Cognizant Technology (CTSH) that will likely be my LAST bearish trade until/unless the S&P 500 truly breaks down below support. CTSH headline results disappointed the market, and the stock gapped down in what looked like a confirmation of 50DMA resistance. I was surprised to see the cheapness of the put options. I put in a limit order hoping to get in after more of the pre-earnings implied volatility bloat burned off. After my order triggered, CTSH never looked back. At the end of the day, the stock not only closed for a GAIN, but also it cleared resistance at the 50DMA (further insult to injury!).
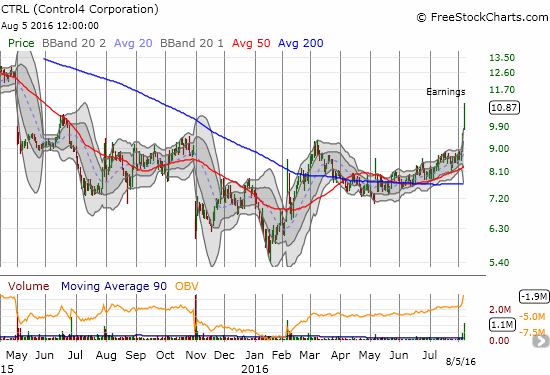
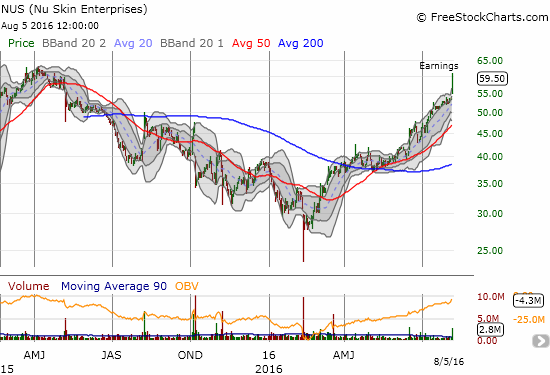
In the last T2108 Update I pointed out sharp bounces from gap down lows as evidence that buyers were still fishing for “bargains.” On Friday, I marveled at impressive breakouts in speculative names as evidence that buyers are not the least deterred. For example, Control4 Corporation (CTRL) and Nu Skin Enterprises Inc. (NUS) printed very impressive post-earnings breakouts. Whenever I see speculative stocks make moves like these, I have to assume speculation and buying are alive and well.
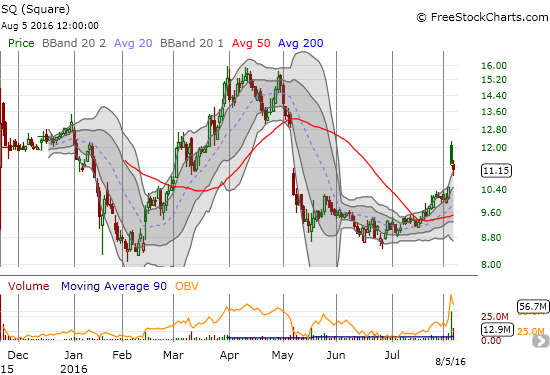
Still, there are surges that have yet to receive follow-through. On Thursday, Square (SQ) produced a gap and crap after reporting earnings. Traders wavered again on Friday but a bounce from lows gives some lingering hope for future follow-through. SQ is a potential gap-fill play.
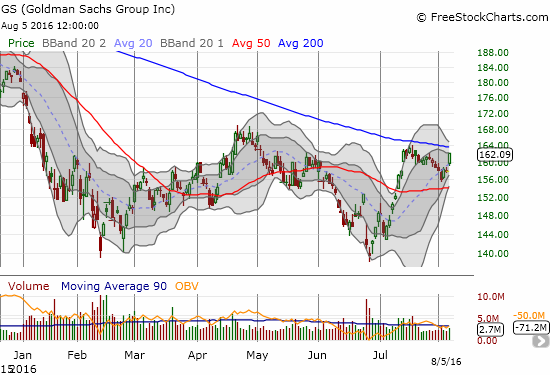
Speaking of financials…Goldman Sachs (GS) was one of the bearish positions which faded into oblivion. Thanks to the heightened potential of a rate hike, GS jumped 2.6% and looks set to give its 200DMA resistance another challenge. I am a bit skeptical GS can manage a strong enough catalyst to breakout given the volatile nature of the market’s rate hike expectations and recent news of expanded job cuts at Goldman.
Financials in general out-performed. While the S&P 500 gained 0.9%, the Financial Select Sector SPDR ETF (XLF) soared 1.9% to a new 7-month high.
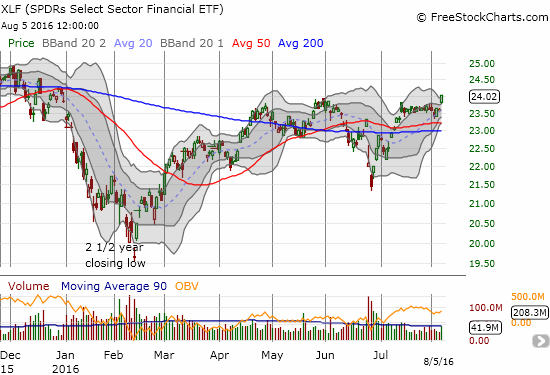
With financials strengthening, the prospects for the bulls are of course brighter.
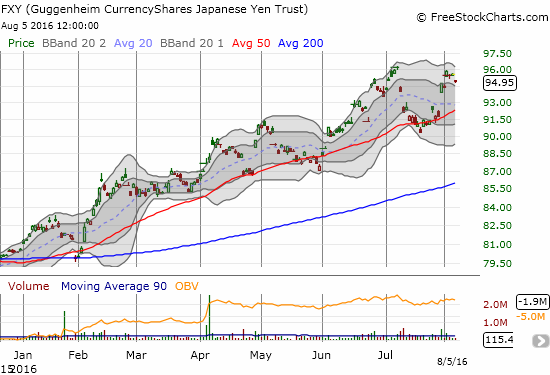
There is an interesting scenario developing here where the U.S.’s economic performance, recent GDP notwithstanding, starts to diverge from other developed economies. Even if the market fails to believe in policy divergence again, economic divergence could make U.S. assets look relatively more attractive along with the prospect of a strengthening dollar. On this note, I am particularly eyeing Japan where the yen (FXY) has enjoyed a resurgence despite economic prospects which look as bad as ever. If I am correct, continuing to bet against FXY makes a lot of sense. Accordingly, I renewed a bet against FXY with put options expiring in September (in addition to my on-going long in USD/JPY).
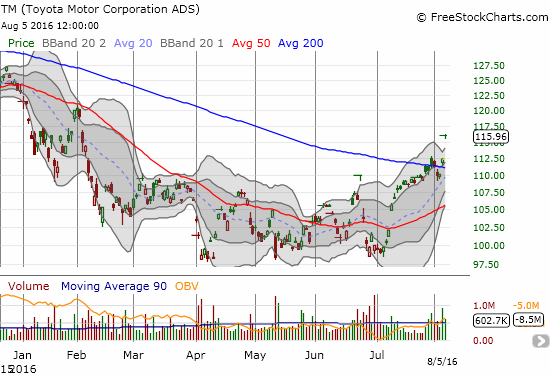
Ironically, the prospect of a double-top in the yen along with a strong U.S. jobs report helped blow up another of my bearish positions: Toyota Motor (TM) made an impressive gap up in a move that looks like it confirmed a 200DMA breakout…
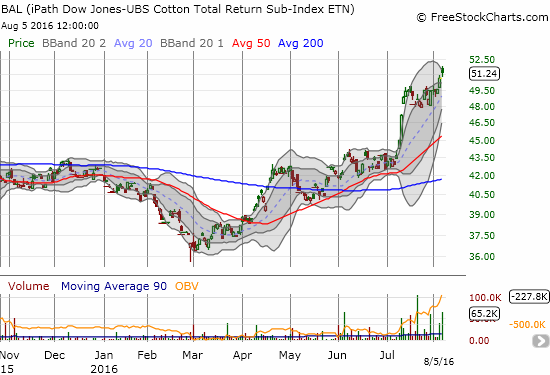
On the commodity side, cotton (BAL) has caught my attention in recent weeks, but it took me time to come around to a trade. The iPath Bloomberg Cotton SubTR ETN (BAL) has had an impressive year which includes a monster surge and breakout in July. It broke out again on Thursday, and I finally decided to nibble on some shares. Trends in commodities can run for a long time. In this case, definitive strength exists along with increasing buying interest.
Speaking of trading breakouts, I sold my position in Boise Cascade Company (BCC). I bought it after the stock made an impressive 200DMA breakout. I intended to hold BCC for a “long” time. However, the stock experienced a gap and crap following earnings on July 28th that closed BCC into a slight loss on the day. Although the stock seems to have stabilized, I decided to go ahead and lock in my profits here.
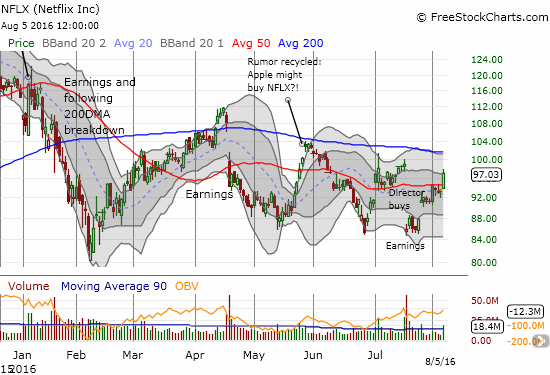
Finally, Netflix (NFLX) delivered another surge. I was positioned properly but the latest move came too late for me to profit. I sold my call options to break even against the cost of the puts. I will renew the strangle trade next week as NFLX now looks set to finish reversing its post-earnings loss. I will probably go for a two-week or longer play this time to allow for profiting from any untimely drawdowns as part of the risk of this season…
— – —
Reference Charts (click for view of last 6 months from Stockcharts.com):
S&P 500 or SPY
U.S. Dollar Index (U.S. dollar)
EEM (iShares MSCI Emerging Markets)
VIX (volatility index)
VXX (iPath S&P 500 VIX Short-Term Futures ETN)
EWG (iShares MSCI Germany Index Fund)
CAT (Caterpillar).
IBB (iShares Nasdaq Biotechnology).
Daily T2108 vs the S&P 500
")
Black line: T2108 (measured on the right); Green line: S&P 500 (for comparative purposes)
Red line: T2108 Overbought (70%); Blue line: T2108 Oversold (20%)
Weekly T2108

*All charts created using freestockcharts.com unless otherwise stated
The charts above are the my LATEST updates independent of the date of this given T2108 post. For my latest T2108 post click here.
Related links:
The T2108 Resource Page
Be careful out there!
Full disclosure: long SSO put options, long CTSH put options, long SQ, long BAL, long TM put options, net long the U.S. dollar, long FXY put options, net short the Japanese yen