
(T2108 measures the percentage of stocks trading above their respective 40-day moving averages [DMAs]. It helps to identify extremes in market sentiment that are likely to reverse. To learn more about it, see my T2108 Resource Page. You can follow real-time T2108 commentary on twitter using the #T2108 hashtag. T2108-related trades and other trades are occasionally posted on twitter using the #120trade hashtag. T2107 measures the percentage of stocks trading above their respective 200DMAs)
T2108 Status: 68.95% (was as high as 70.7%)
T2107 Status: 67.3%
VIX Status: 13.5
General (Short-term) Trading Call: neutral
Active T2108 periods: Day #103 over 20%, Day #9 over 30%, Day #8 over 40%, Day #7 over 50%, Day #2 over 60%, Day #21 under 70%
Commentary
I had my finger poised over the “buy button,” but the market failed to deliver the closing signal. At its high of the day, T2108, the percentage of stocks trading above their 40-day moving averages (DMAs), reached overbought status at 70.7%. A small wave of selling took T2108 down to 68.95%, a close just under the overbought threshold of 70%. The selling took the S&P 500 from a new intraday all-time high of 2143.16 to an all-time closing high of 2137.16.
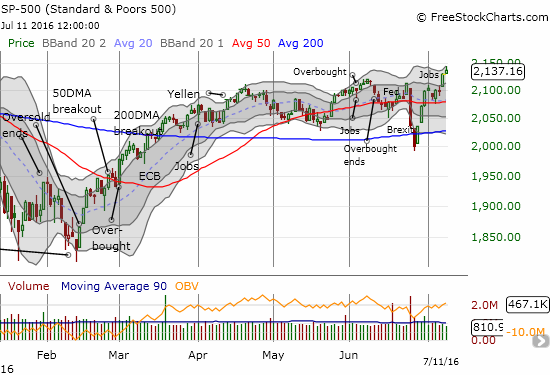
Technically, a new all-time is a very bullish event for the index that should be bought. T2018 tells me otherwise for today. Per the T2108 trading rules, I only flip bullish from bearish in this case once T2108 goes overbought. More importantly, if T2108 fails to break the overbought threshold, I get aggressively bearish on the next notable pullback. Interestingly, the intraday pullback into the close was strong enough to push the volatility index, the VIX, into the green.
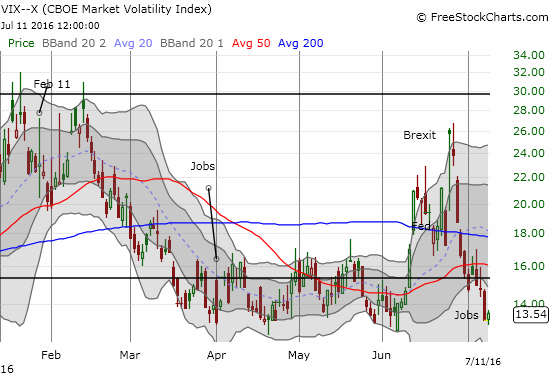
Ordinarily, such a small gain in the VIX would barely catch my notice. Here, the VIX is testing its recent lows (yet again), so any sign that the next bounce is about to begin gets me on alert. Needless to say, if the S&P 500 prints a notable pullback from here, I will assume the VIX can at least sustain a bounce back to its 15.35 pivot.
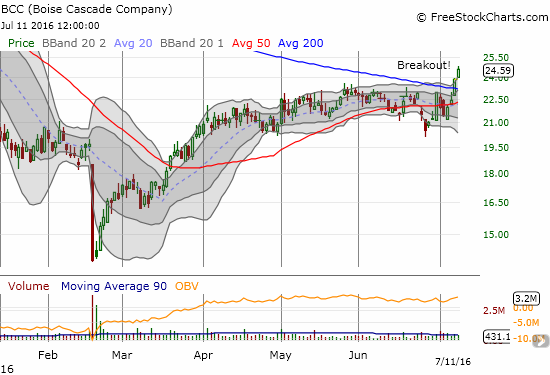
Although my short-term trading call stays at neutral, I was focused mostly on prospects for longs today. I decided to pull the trigger on a half position on Boise Cascade Company (BCC). On Friday, the stock broke out from its 200-day moving average (DMA) downtrend. I am on alert for housing-related plays given the great move of home builder stocks on Friday.
In fact, if the market continues on a roll, the housing industry will be my top focus.
Next up, commodities. The tension there is the U.S. dollar index (DXY0). Once again, the index pressed against its 200DMA resistance. This time around the index just barely managed to close above its 200DMA. A combined rally of the S&P 500 and the U.S. dollar would make for one fascinating partnership.

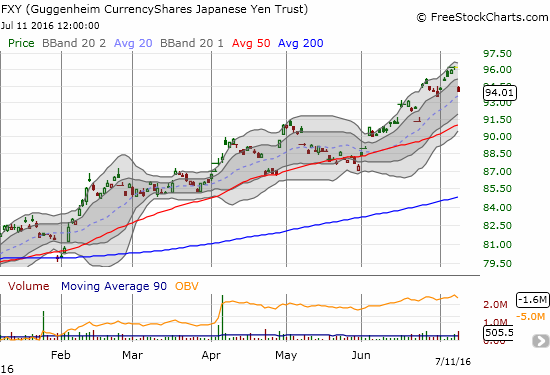
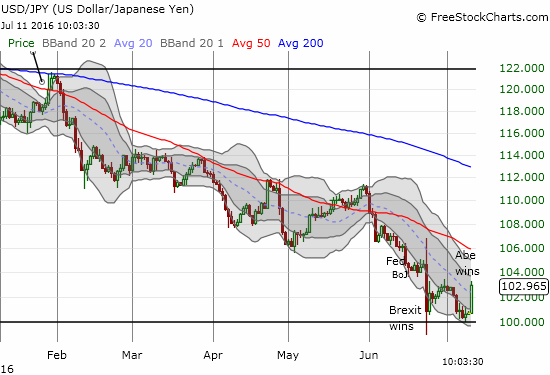
Helping the U.S. dollar today was a large sell-off in the Japanese yen (FXY). Japanese Prime Minister Shinzo Abe scored a victory when his party’s coalition won in parliamentary elections. The convincing victory now has the market starting to believe in another round of economic stimulus, aka Abenomics. If the market starts to bet on this by selling yen to buy risky assets, look out above. The S&P 500 could then be right on the edge of a very bullish run-up with a classic, extended, overbought rally. Commodities should become particularly attractive. I continue to stay net short the Japanese yen (FXY) and days like today seem to validate my stubbornness. I even continued to hold my latest tranche of put options on FXY in anticipation of further yen weakness.
Finally, some good reading in the UK’s Telegraph on the parallels between the current cycle and 1998 and 1999. Today, we have central banks panicking over deflationary pressures and Brexit and easing away even with equity markets doing so well already. Then, the Asian financial crisis and concerns over the digital flip to the year 2000, aka Y2K, prompted the Federal Reserve to go into easing mode. Those policies are at least partially credited with pushing the stock market over the hump into the tech bubble and bust. Such a parallel signals a double-edged sword. The market could be right on the edge of a major bullish run with rapid gains ahead, but the price paid for them could be particularly harsh. Read “Funds bet that emergency global stimulus will trump Brexit worries.”
— – —
Reference Charts (click for view of last 6 months from Stockcharts.com):
S&P 500 or SPY
U.S. Dollar Index (U.S. dollar)
EEM (iShares MSCI Emerging Markets)
VIX (volatility index)
VXX (iPath S&P 500 VIX Short-Term Futures ETN)
EWG (iShares MSCI Germany Index Fund)
CAT (Caterpillar).
IBB (iShares Nasdaq Biotechnology).
Daily T2108 vs the S&P 500
")
Black line: T2108 (measured on the right); Green line: S&P 500 (for comparative purposes)
Red line: T2108 Overbought (70%); Blue line: T2108 Oversold (20%)
Weekly T2108

*All charts created using freestockcharts.com unless otherwise stated
The charts above are the my LATEST updates independent of the date of this given T2108 post. For my latest T2108 post click here.
Related links:
The T2108 Resource Page
Be careful out there!
Full disclosure: long UVXY shares, long USD/JPY, long FXY put options, long ITB call options, long BCC