
(T2108 measures the percentage of stocks trading above their respective 40-day moving averages [DMAs]. It helps to identify extremes in market sentiment that are likely to reverse. To learn more about it, see my T2108 Resource Page. You can follow real-time T2108 commentary on twitter using the #T2108 hashtag. T2108-related trades and other trades are occasionally posted on twitter using the #120trade hashtag. T2107 measures the percentage of stocks trading above their respective 200DMAs)
T2108 Status: 64.1%
T2107 Status: 69.8%
VIX Status: 12.9
General (Short-term) Trading Call: bearish
Active T2108 periods: Day #120 over 20%, Day #26 over 30%, Day #25 over 40%, Day #24 over 50%, Day #1 over 60% (ending 1 day under 60%) (overperiod), Day #3 under 70%
Commentary
Days like these make it tough to stick to trading rules!
In the last T2108 Update, I determined that the S&P 500 (SPY) was “close enough” to a breakdown to change my short-term trading call from cautiously bearish to bearish. It turned out that the bears and sellers were not ready to follow-through. The S&P 500 bounced in near picture-perfect form from the bottom of the recent trading range. The index even closed on its high of the day.
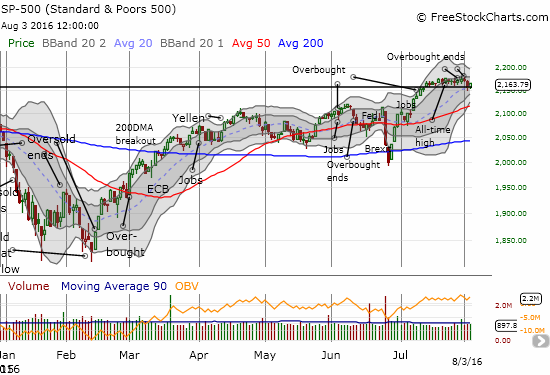
Along with the bounce, T2108 stepped over 60% again and closed at 64.1%. This puts my favorite technical indicator back in sniffing distance of the overbought threshold.
Dip buyers were in effect everywhere.
As I speculated could happen, oil bulls took the “bear market” in oil as a buying trigger. United States Oil (USO) hopped 3.9% but stayed within the downward trading channel.
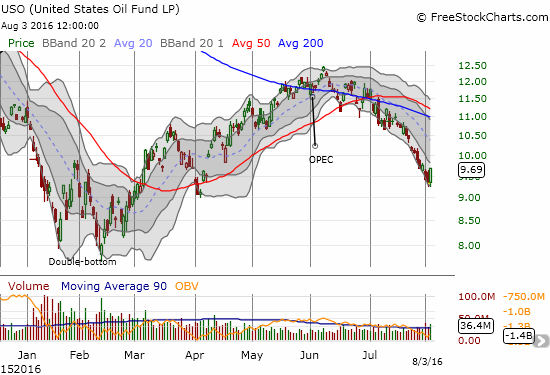
If oil sustains buying interest, I will likely need to stop out of my recent bear trades on oil. I would resume the trade on a fresh low for oil – I am not confident that attempting to find a top to fade will work any better than playing a breakdown. If I were a bull, I would just buy here and stop out on a new low. It is a great risk/reward trade that makes it tough to stick to my current trading rule (granted – there is no reason to assume that being bearish on stocks requires a bearishness on oil).
Oil hopped despite hops in the U.S. dollar (DXY0) as well. Once again, day-to-day correlations are dangerous to rely upon these days.
Oil and the dollar are marching in step again https://t.co/vZprKuzu7V pic.twitter.com/zHs4CoTrkS
— Bloomberg (@business) August 4, 2016
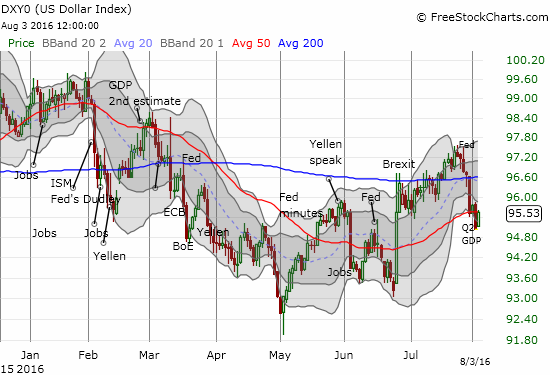
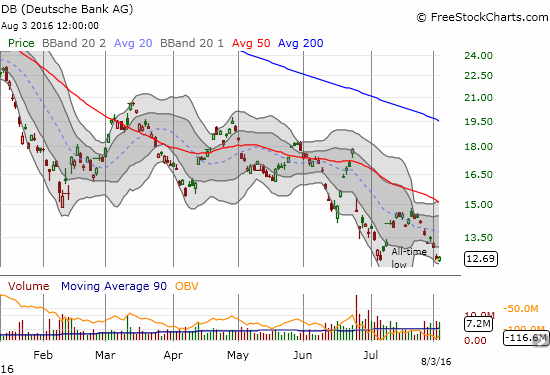
A sharp decline in the euro (FXE) was the main driver for U.S. dollar strength. The decline reminded of the on-going trouble in several European banks. The decline also reminded me that I failed to renew my bearish bets against Deutsche Bank (DB). DB is now retesting all-time lows and likely to bounce. I will look to fade such a bounce, but a hedged trade may be in order at these levels.
The buyers chased after retail stocks after a major gap down apparently exhausted sellers. Kate Spade & Company (KATE) suffered an 18% post-earnings loss and helped drag down the sector. While that gap was far too large to close in one day, SPDR S&P Retail ETF (XRT) closed its gap and even ended up in the green. The reversal was far too swift for me to even think about closing out my existing put options on XRT (they are in the red).
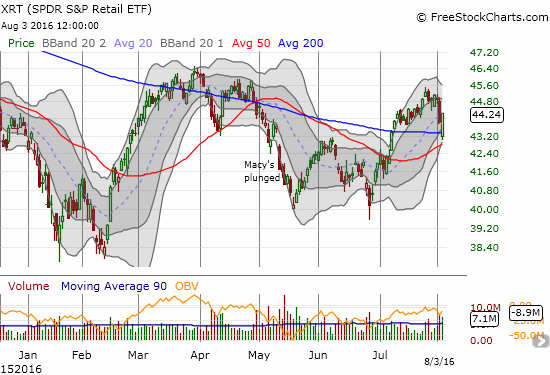
If I were bullish, I would have rushed to buy upon seeing XRT soar above 200DMA resistance – one more example of how tough it was to stick to trading rules.
Retailers were not the only stocks gap buyers chased.
Community Health Systems, Inc. (CYH) suffered a 10% gap down and sold further before buyers rushed in to fill the breach. The reversal was strong enough to deliver a 1% gain for CYH. The chart below shows that this buying interest is quite similar to the bounce after the last two post-earnings disappointments. Is CYH gradually carving out a sustainable bottom or are buyers exhausting themselves trying to prop up this stock?
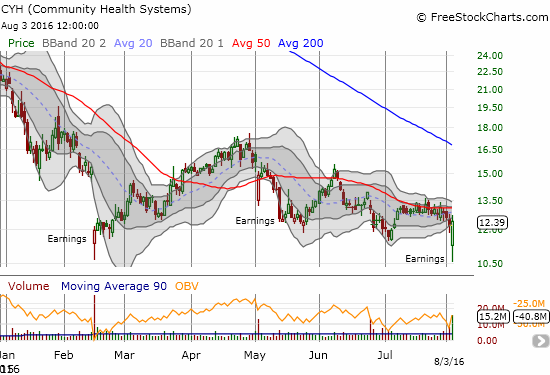
As regular readers know, I like buying plunges well-below the lower-Bollinger Band (BB) as a quick trade on (often intraday) oversold conditions. I will need to find a way to make exceptions for these trades even when my trading call is bearish!
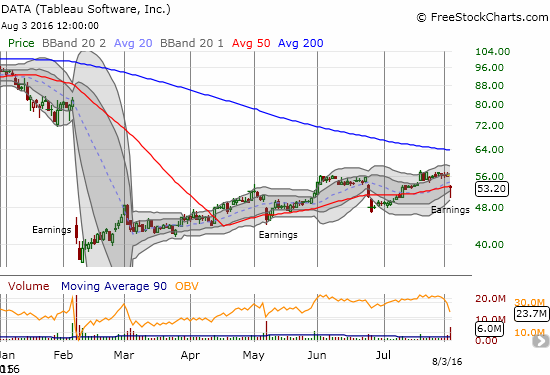
Like CYH, Tableau (DATA) delivered earnings that disappointed for the third time this year. Like CYH, buyers have stepped after each disappointment to deliver impressive reversals. Unlike CYH, DATA’s first gap down in 2016 was so deep that DATA has yet to come close to a complete reversal. Yet, the stock is gradually pushing onward with higher lows and higher highs – like it will not quit until it meets up with 200DMA resistance. This third episode is different from the first in that DATA managed to find substantial buying interest off the lows on the first post-earnings day. I originally shorted the stock expecting it to close near its lows and felt fortunate to decide to cover near the eventual low.
Even as bears failed to follow-through and buyers returned to scooping up “bargains,” I decided to go full speed ahead on my trading plan to accumulate bearish positions. Except for the brief day-trade on DATA, I chose put options. I faded intraday rallies on the following stocks: Expedia (EXPE) and Toyota Motor (TM) – which I mentioned in the last T2108 update; Nordstrom (JWN) – I felt it necessary to try to fade a retailer (JWN reports earnings next week); Goldman Sachs (GS) – it has trended downward ever since a gap up and brief post-earnings rally; and even DATA which triggered a limit order right before the close of trading. Of these trades, I am least sure of DATA and will look to take profits quickly if I can. I am good for now on bearish trades and will stand down until I see evidence that the sellers are ready to follow-through on yesterday’s bearish trading signal.
— – —
Reference Charts (click for view of last 6 months from Stockcharts.com):
S&P 500 or SPY
U.S. Dollar Index (U.S. dollar)
EEM (iShares MSCI Emerging Markets)
VIX (volatility index)
VXX (iPath S&P 500 VIX Short-Term Futures ETN)
EWG (iShares MSCI Germany Index Fund)
CAT (Caterpillar).
IBB (iShares Nasdaq Biotechnology).
Daily T2108 vs the S&P 500
")
Black line: T2108 (measured on the right); Green line: S&P 500 (for comparative purposes)
Red line: T2108 Overbought (70%); Blue line: T2108 Oversold (20%)
Weekly T2108

*All charts created using freestockcharts.com unless otherwise stated
The charts above are the my LATEST updates independent of the date of this given T2108 post. For my latest T2108 post click here.
Related links:
The T2108 Resource Page
Be careful out there!
Full disclosure: long SSO put options, long SPY call options, long XRT put options, long DATA put options, hedged options trade on USO, long put options on GS, TM, and EXPE