
(T2108 measures the percentage of stocks trading above their respective 40-day moving averages [DMAs]. It helps to identify extremes in market sentiment that are likely to reverse. To learn more about it, see my T2108 Resource Page. You can follow real-time T2108 commentary on twitter using the #T2108 hashtag. T2108-related trades and other trades are occasionally posted on twitter using the #120trade hashtag. T2107 measures the percentage of stocks trading above their respective 200DMAs)
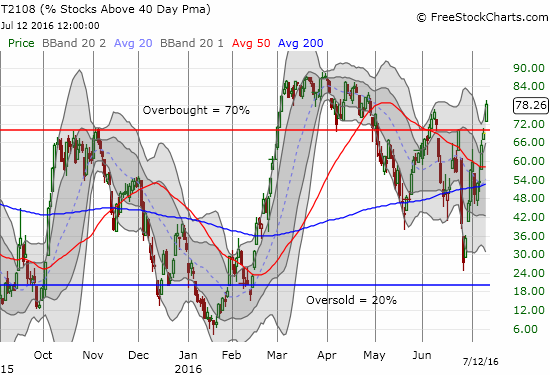
T2108 Status: 78.3% (1st day of overbought conditions)
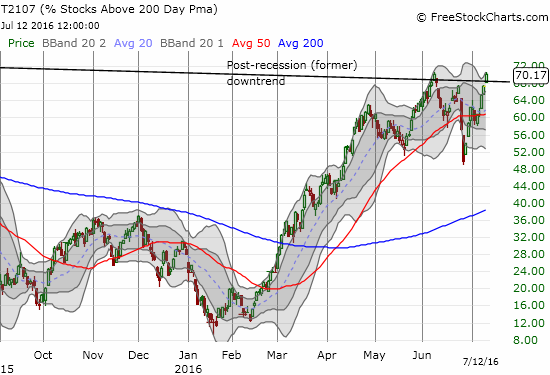
T2107 Status: 70.2%
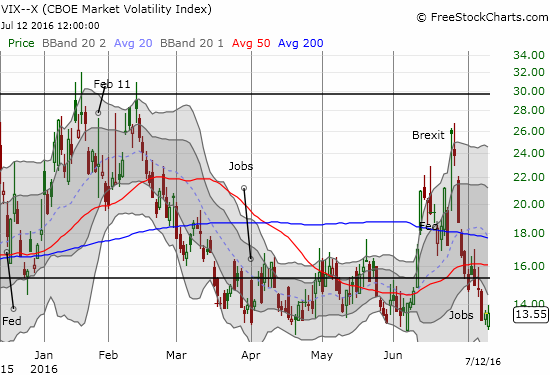
VIX Status: 13.6 (a fractional gain)
General (Short-term) Trading Call: bullish
Active T2108 periods: Day #104 over 20%, Day #10 over 30%, Day #9 over 40%, Day #8 over 50%, Day #3 over 60%, Day #1 over 70% (1st day of overbought conditions ends 21 days under 70%)
Commentary
And just like that the stock market is back to overbought conditions. This is a scenario that was far from my mind a month ago. I would have said this scenario was inconceivable in the immediate wake of post-Brexit woes. But here we are.
T2108 closed with a resounding thunderclap deep into overbought territory. My favorite technical indicator jumped from 68.95% all the way to 78.3%.
T2107, the percentage of stocks trading above their 200-day moving averages (DMAs), got back into the bullish act by returning to a breakout from the (now former) post-recession downtrend.
So NOW the breakout of the S&P 500 (SPY) to a fresh all-time high looks a LOT more convincing.
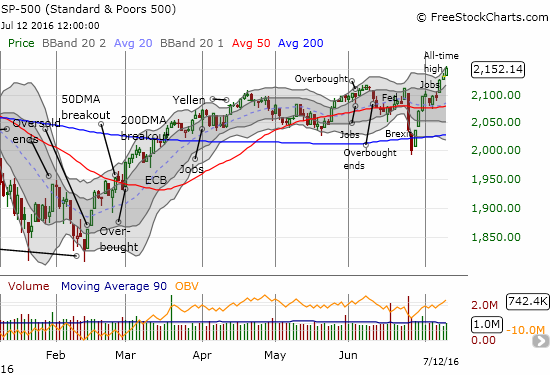
Except….the market will not let us off the hook so easily. This break out is actually a bit unbalanced and.
First of all, the volatility index, the VIX, rallied again to close in the green. It is another very marginal gain, but I am duly noting that support is holding at a point from which the VIX has staged numerous rallies. A sudden rise in volatility while the market is so far aloft typically makes for an unstable mix.
Secondly, the high beta stocks in the S&P 500 carried the entire load on this major breakout day. The “low volatility” stocks actually pulled back a bit. Now, I can understand traders and the like chasing after high beta on a major breakout to all-time highs: such stocks promise the biggest and fastest gains when buyers in the market are in “risk on” mode. However, thinning participation makes for a more vulnerable rally. We have seen this time and again. I am going to keep a close eye on developments here.
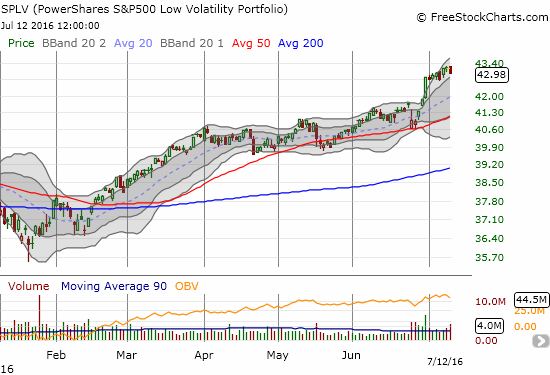
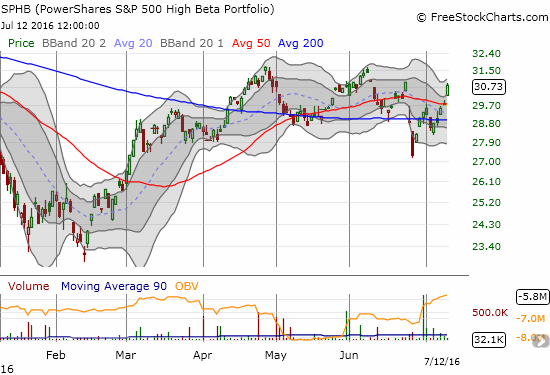
This divergence would be even more stark if SPLV were not pulling back from its own all-time high while SPHB remains well-off its all-time high. SPHB made its last all-time high around $35.68 in April, 2015, just ahead of the S&P 500’s last all-time high. Perhaps an overdue rotation is underway. Regardless, I am fine with SPHB outpacing SPLV, but I do not want to see the two moving in distinctly opposite directions on too many days.
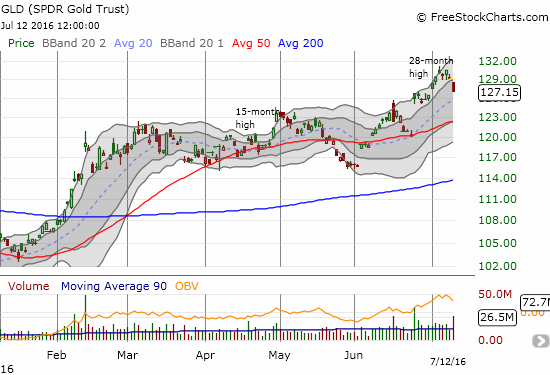
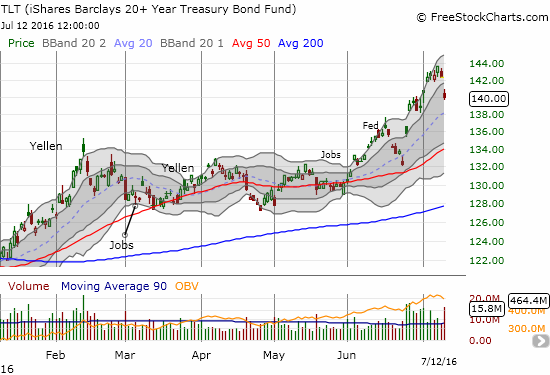
Rounding out some of the usual suspects for assessing the health of a rally are gold (GLD) and iShares Trust – iShares 20+ Year Treasury Bond ETF (TLT). Both declined and both moves should support the bullish case for stocks if they continue to decline.
I have been bracing for a top in the SPDR Gold Trust (GLD) over and over in the past few months. The post-Brexit malaise invalidated the last potential blow-off top for GLD. This time around, the “buy gold” sentiment indicator is flashing a much stronger signal that this latest extreme move in gold is due for a notable pullback.
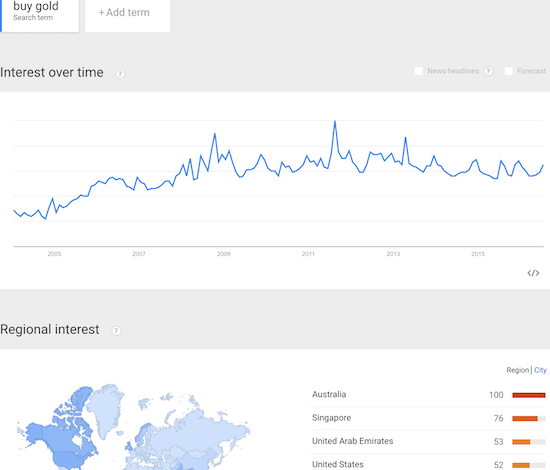
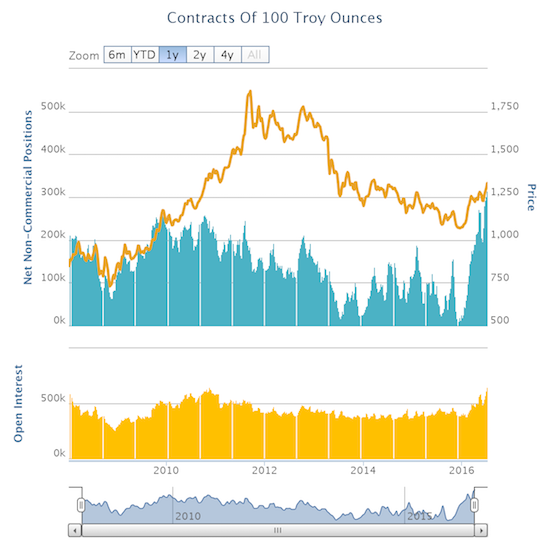
Source: Oanda’s CFTC’s Commitments of Traders
A pullback in bonds could begin a rush of money out of the “safety” of very low yielding instruments into chasing stocks ever higher. A move out of bonds into high beta stocks would be like a double-whammy of risk-on behavior.
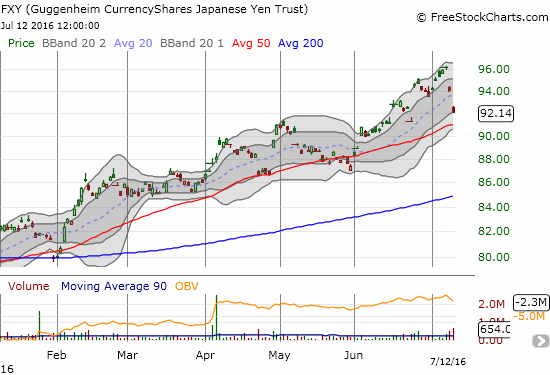
Rounding out the rush from safety is the current sharp pullback in the Japanese yen (FXY) in the wake of a major party victory for Japanese Prime Minister Shinzo Abe. Against several currency pairs, the yen has reversed all its post-Brexit gains in the span of just two days! I sold my FXY put options expiring this Friday. I am holding steadfast to the fistful of put options expiring next month.
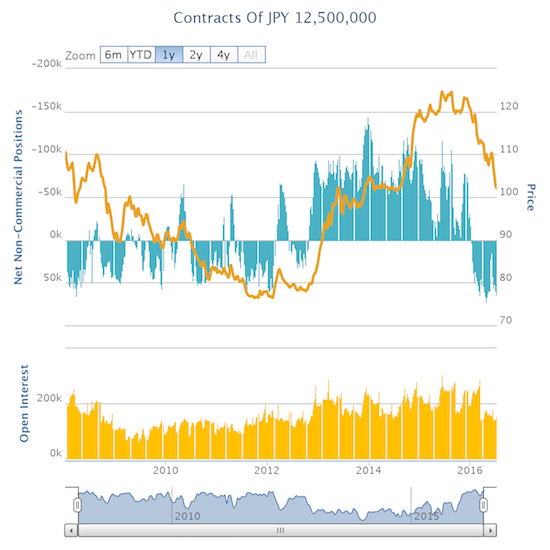
Source: Oanda’s CFTC’s Commitments of Traders
In honor of the traditional weights on the stock market, I am coining the term GraVITY: Gold-ra-VIx-Treasuries (or TLT)-Yen. Typically, or conventionally, the stronger GRAVITY gets, the more pressure should weigh on the stock market. As I pointed out in a recent T2108 Update, this time around, the stock market has rallied quite happily in the face of stronger GRAVITY. So imagine the lift-off possible when GRAVITY is lessening its grip on the market’s ankles! (I am taking ideas for the “ra” part of GRAVITY!).
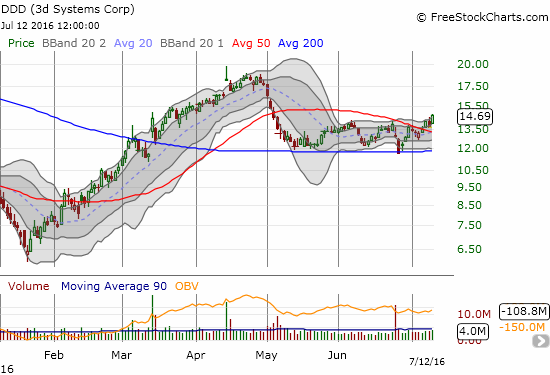
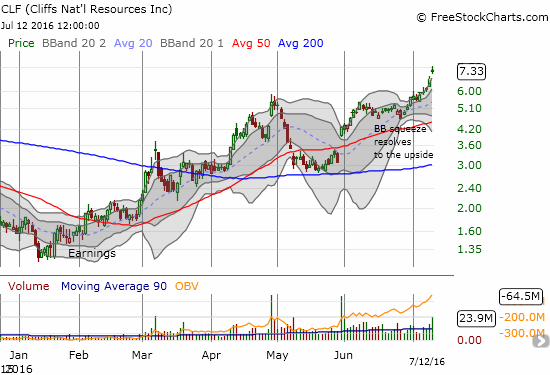
So the breakout for the S&P 500 (SPY) is not as clean as I would like but it is still a bullish breakout. My trading call now flips from neutral to bullish. I skip neutral and go straight to bearish, if (once) T2108 drops from overbought conditions. I am managing my wariness over the unbalanced nature of the breakout by honing in on specific breakouts. Not only could these breakout moves signal the start of a new run-up, but also they generate definitive stops (below support). I post some charts below to consider. I did not get a fill on orders for shares and call options on 3D Systems Corporation (DDD). I consider Cliffs Natural Resources Inc. (CLF) to be my latest big miss. I made an earlier attempt to play a breakout from the Bollinger Band (BB) squeeze, but I gave up after failing to get my preferred entry price on call options. Finally, I meant to load up on call options and shares of ProShares Ultra S&P500 (SSO) but failed to do so. I am looking to fill up on the next (intraday) dip.

— – —
Reference Charts (click for view of last 6 months from Stockcharts.com):
S&P 500 or SPY
U.S. Dollar Index (U.S. dollar)
EEM (iShares MSCI Emerging Markets)
VIX (volatility index)
VXX (iPath S&P 500 VIX Short-Term Futures ETN)
EWG (iShares MSCI Germany Index Fund)
CAT (Caterpillar).
IBB (iShares Nasdaq Biotechnology).
Daily T2108 vs the S&P 500
")
Black line: T2108 (measured on the right); Green line: S&P 500 (for comparative purposes)
Red line: T2108 Overbought (70%); Blue line: T2108 Oversold (20%)
Weekly T2108

*All charts created using freestockcharts.com unless otherwise stated
The charts above are the my LATEST updates independent of the date of this given T2108 post. For my latest T2108 post click here.
Related links:
The T2108 Resource Page
Be careful out there!
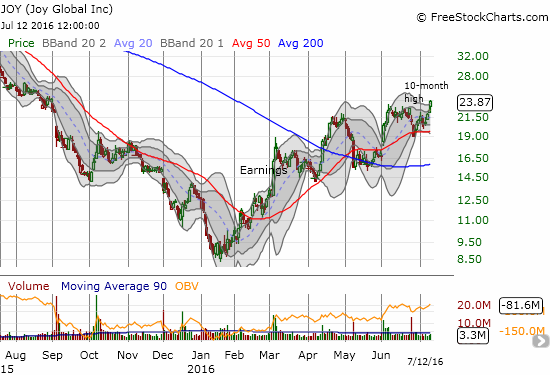
Full disclosure: long UVXY shares, long USD/JPY, long FXY put options, long JOY call options, long WYNN call options, long GLD