
(T2108 measures the percentage of stocks trading above their respective 40-day moving averages [DMAs]. It helps to identify extremes in market sentiment that are likely to reverse. To learn more about it, see my T2108 Resource Page. You can follow real-time T2108 commentary on twitter using the #T2108 hashtag. T2108-related trades and other trades are occasionally posted on twitter using the #120trade hashtag. T2107 measures the percentage of stocks trading above their respective 200DMAs)
T2108 Status: 79.7% (5th day of overbought conditions)
T2107 Status: 71.4%
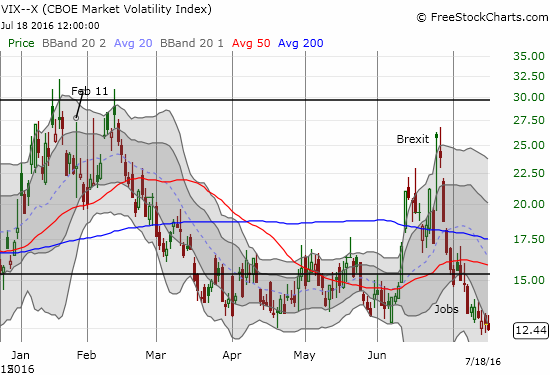
VIX Status: 12.4 (11-month closing low)
General (Short-term) Trading Call: bullish
Active T2108 periods: Day #108 over 20%, Day #14 over 30%, Day #13 over 40%, Day #12 over 50%, Day #7 over 60%, Day #5 over 70% (overbought)
Commentary
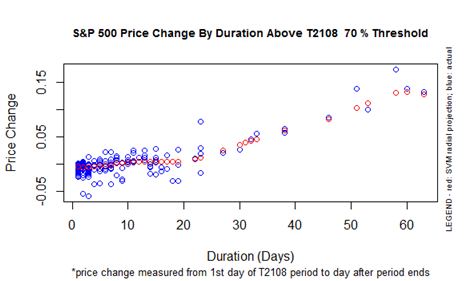
The stock market is on Day #5 of overbought conditions as the bullish momentum continues ever so slightly. T2108, the percentage of stocks trading above their respective 40-day moving averages (DMAs), has yet to crack 80%, but it does not need to do so to maintain bullish momentum in the market. I have noted in previous posts on overbought conditions that T2108’s level matters little at and above 80%. There is simply very little extra room for stocks to move at this point. T2108 is more important as a signal for the end of bullish conditions which occurs when T2108 falls OUT of overbought conditions. The DURATION of the overbought period is also more important than the level of T2108 at this point. Once the duration goes past 20 days, the market actually gets MORE bullish; the chart below shows how the S&P 500’s performance in the overbought period increases with overbought duration.
T2107, the percentage of stocks trading above their respective 200DMAs, also becomes more important at this juncture. At 71.4%, T2107 is inching along just like T2108. And like T2108, it is running out of room to move higher. At some point soon, it will be more important for it to remain aloft than for it to keep gaining.
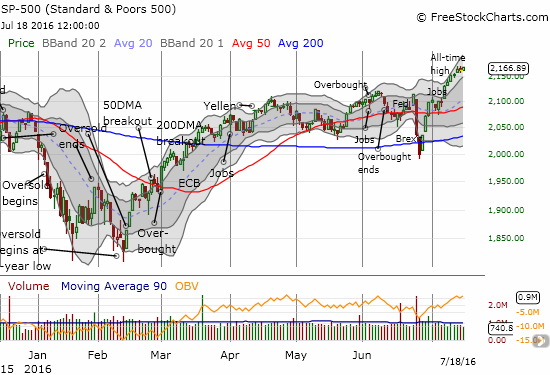
The S&P 500 (SPY) is doing its part by registering new all-time highs. Per plan, I used every little dip last week to load up on call options on ProShares Ultra S&P500 (SSO). It was a risky move to target a Friday expiration. However, I assumed that if the S&P 500 could not maintain momentum into the end of this week, the index would likely drop into a larger pullback. I did not buy any SSO shares as originally planned.
I noted in the last T2108 Update how the high beta stocks in the S&P 500 carried the entire load on that major breakout day. The divergence between the PowerShares S&P 500 Low Volatility ETF (SPLV) and the PowerShares S&P 500 High Beta ETF (SPHB) continues by the slightest of margins. I am looking for the divergence to widen and get more dramatic before warning that further momentum has become overly unbalanced.
Also in the last T2108 Update, I introduced the notion of GRAVITY: Gold-ra-VIx-Treasuries (or TLT)-Yen. GRAVITY consists of components that conventionally are supposed to weigh on the market. Ever since the big breakout day, GRAVITY has largely cooperated and lightened up. The SPDR Gold Trust (GLD) has been the most resilient by managing to stay mainly flat the last three days. On Thursday July 14, I sold the last of my put options on the CurrencyShares Japanese Yen ETF (FXY). FXY gapped down again and was “close enough” to retesting 50DMA support. Today, it closed marginally below this critical support line. The volatility index, the VIX, is of greatest interest. Its cooperation with market bullishness has now pushed it to levels last seen right before the August, 2015 flash crash. I remain on my toes given the VIX typically does not stay at such low levels for long…
Here is a quick update on trades/charts I mentioned in the last T2108 Update:
- 3D Systems (DDD): A downgrade today knocked DDD off its upward momentum. After DDD cracked 50DMA support, buyers regained enough force to close the stock above support. Trading volume was over 50% above the 90-day moving average. A lower close will confirm the end of the current bullish setup. Otherwise, I am sticking with the call.
- Wynn Resorts Ltd. (WYNN): WYNN has fought off a downgrade last week to reclaim 50DMA support. I think the stock can continue with its bullish setup from here.
- U.S. Steel (X): X is still making new marginal 52-week highs. I have not made a trade on this one.
- Cliffs Natural Resources Inc. (CLF): The stock’s levitation has now allowed the upper-Bollinger Band (BB) to drift up and away from the stock. Fresh upside potential is opening up. I have yet to make a new trade on this one. I might buy a new high OR a dip to support (like the bottom of the current uptrend channel).
- Joy Global (JOY): JOY made a picture-perfect bounce after a small 3-day pullback. It looks ready to run higher.
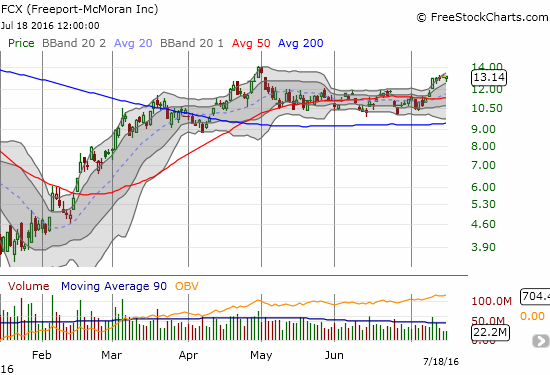
Lastly, I made a fresh trade on Freeport-McMoRan Inc. (FCX). In the past, I played the nice trading range in FCX. Last week, FCX finally broke out. I changed strategy with a hedged play: a strangle – out-of-the-money calls and puts. Wherever FCX is headed next should be a big move. Either 1) FCX will soon make a major breakout and move past its 2016 high, or 2) the current breakout will fail and FCX will quickly fall back to the bottom of the old trading range. I might grow this position depending upon general market conditions.
— – —
Reference Charts (click for view of last 6 months from Stockcharts.com):
S&P 500 or SPY
U.S. Dollar Index (U.S. dollar)
EEM (iShares MSCI Emerging Markets)
VIX (volatility index)
VXX (iPath S&P 500 VIX Short-Term Futures ETN)
EWG (iShares MSCI Germany Index Fund)
CAT (Caterpillar).
IBB (iShares Nasdaq Biotechnology).
Daily T2108 vs the S&P 500
")
Black line: T2108 (measured on the right); Green line: S&P 500 (for comparative purposes)
Red line: T2108 Overbought (70%); Blue line: T2108 Oversold (20%)
Weekly T2108

*All charts created using freestockcharts.com unless otherwise stated
The charts above are the my LATEST updates independent of the date of this given T2108 post. For my latest T2108 post click here.
Related links:
The T2108 Resource Page
Be careful out there!
Full disclosure: long SSO call options, long JOY call options, long WYNN call options, long calls and puts on FCX, long UVXY shares