
(T2108 measures the percentage of stocks trading above their respective 40-day moving averages [DMAs]. It helps to identify extremes in market sentiment that are likely to reverse. To learn more about it, see my T2108 Resource Page. You can follow real-time T2108 commentary on twitter using the #T2108 hashtag. T2108-related trades and other trades are occasionally posted on twitter using the #120trade hashtag. T2107 measures the percentage of stocks trading above their respective 200DMAs)
T2108 Status: 65.1%
T2107 Status: 65.2%
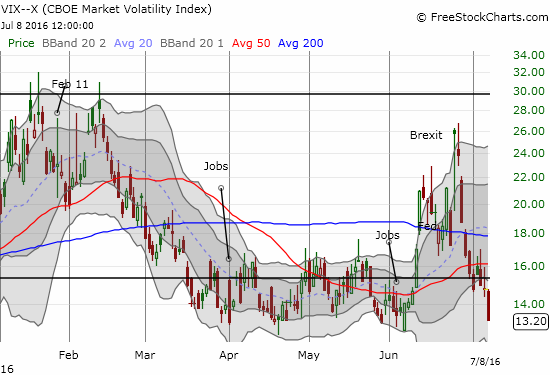
VIX Status: 13.2
General (Short-term) Trading Call: neutral
Active T2108 periods: Day #102 over 20%, Day #8 over 30%, Day #7 over 40%, Day #6 over 50%, Day #1 over 60%, Day #20 under 70%
Commentary
The S&P 500 (SPY) broke out to a new 2016 high that is also, amazingly, within a hair’s length of a fresh all-time high.
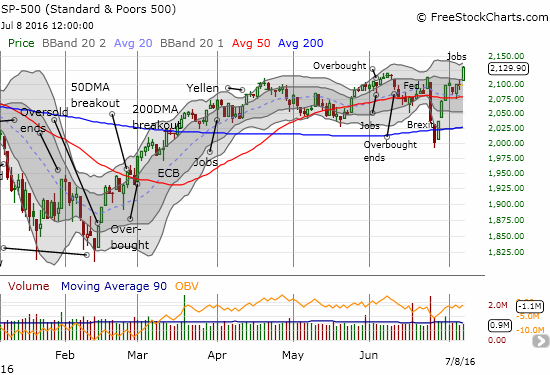
The last all-time high was set on May 21, 2015 (I have mistakenly given May 15th as the date in some earlier posts) with the S&P 500 at 2130.82. At the time, the index was laboring mightily making a series of sporadic new marginal all-time highs. T2108, the percentage of stocks trading above their 40-day moving averages (DMAs) closed that day at a paltry and unconvincing 53.3%. While the S&P 500 was struggling to gather more momentum, T2108 was also stuck and failing to confirm the bullishness that typically accompanies new all-time highs. The index went on to confirm the top and has had a series of wild gyrations up and down since then.
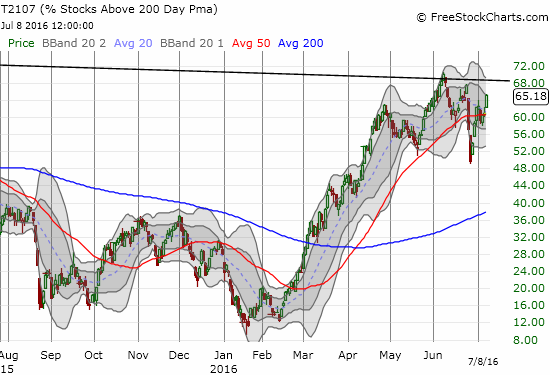
Today, T2108 is much stronger at 65.1%. Yet, a switch to a bullish short-term trading call must wait for T2108 to push back into overbought territory. Such a move provides more evidence that buyers may have sustaining power at these lofty levels. Right now, T2108 is still facing a downtrend from the last highs. T2107, the percentage of stocks trading above their respective 200DMAs, has yet to regain its bullish breakout from the post-recession downtrend (the thick black line cutting across the top of the chart).
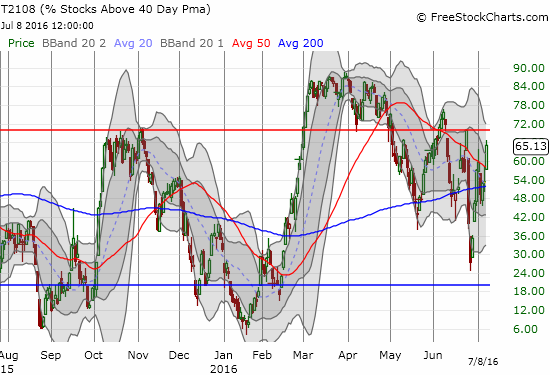
Recall that T2108’s fall from overbought conditions was a key bearish signal on June 10th. The S&P 500 invalidated that bearish signal when it closed above its 50DMA as part of a sharp, post-Brexit reversal and recovery. I switched to neutral at that point awaiting the catalyst for a bullish trading signal. If T2108 once again fails to break resistance at the threshold of overbought conditions, I will flag an even more bearish warning than the last time.
The presumed driver for the day’s trading was the jobs report for June. This report brought good economic news back into the foreground for the stock market on the heels of a series of tragic domestic shooting events in the U.S.. The jobs report was good enough to push up the odds for the next rate hike from the U.S. Federal Reserve. The gains were small but just enough to show that market expectations for a rate hike have not been completely forgotten. The chart below compares the change in rate expectations with the levels on June 16, 2016 – pre-Brexit and post the May jobs report. I assume these changes, as small as they are, confirm that the market interpreted the jobs report as good economic news.
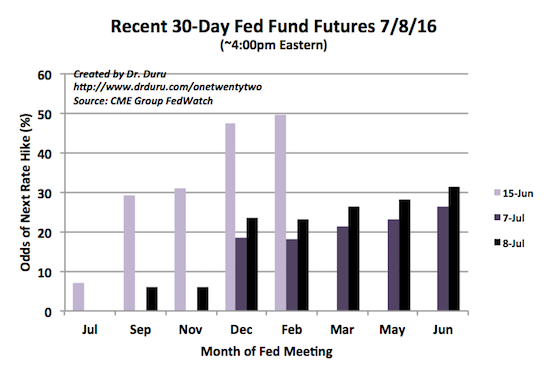
Source: CME FedWatch tool
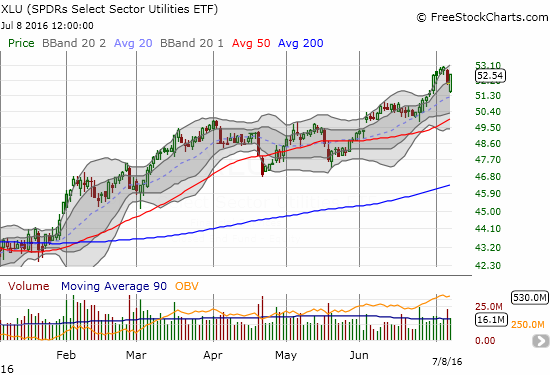
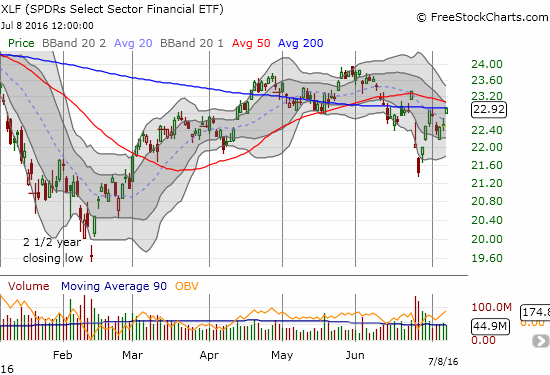
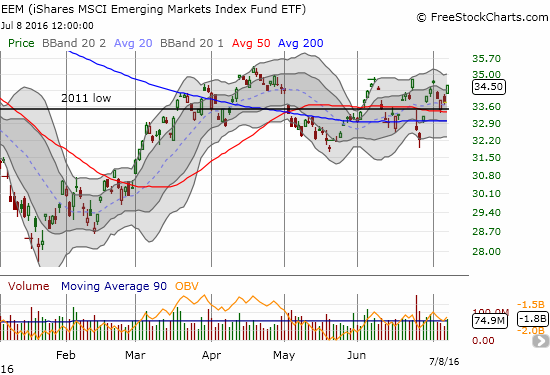
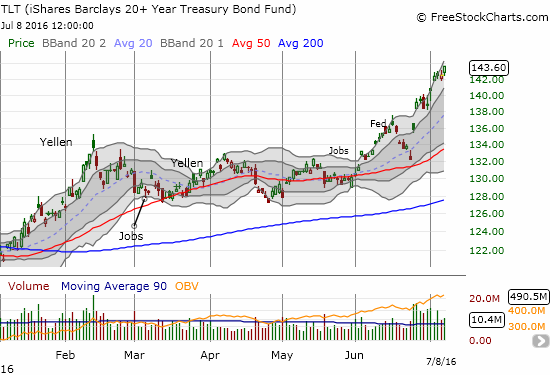
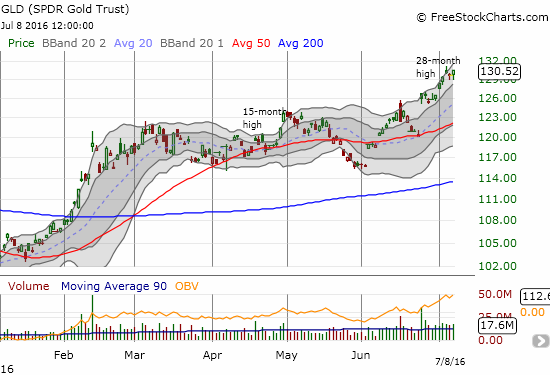
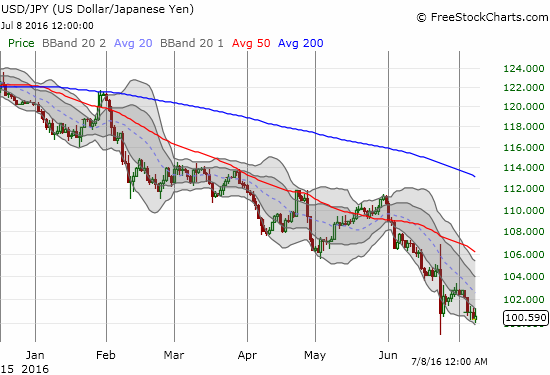
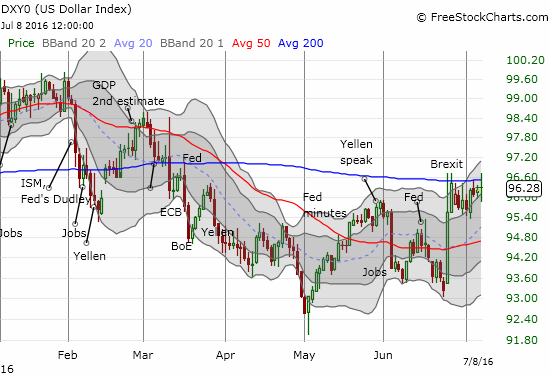
The most striking feature of the day’s trading was the near uniformity of gains across a range of asset classes, including assets which we expect to move inversely to each other. It was a true “goldilocks” moment: the stock market rallied, utilities (XLU) recovered nicely from an initial gap down, financials (XLF) soared, emerging markets (EEM) rallied, homebuilders broke out (ITB), volatility (VIX) sank, bonds (TLT) gained again, gold (GLD) finished in the green, the U.S. dollar (DXY0) stayed aloft, AND the Japanese yen (FXY) strengthened further. Being long something, almost anything, worked just fine on the day!

(Note I have also written about how the stubborn strength in the Australian dollar (FXA) seems to tell us that the market is not nearly as risk averse as the Japanese yen or bond yields may suggest).
The homebuilders are a special case. The iShares U.S. Home Construction ETF (ITB) soared with a 2.8% gain on almost 3x average volume from the last three months. This move is BOTH an affirmation of good economic news and a renewed belief that this news portends better performance ahead. This move wipes away my remaining and lingering misgivings about the ability of ITB to build upon the traditional seasonal strength from the Spring selling season…even with increasing warning signs from the Western region.
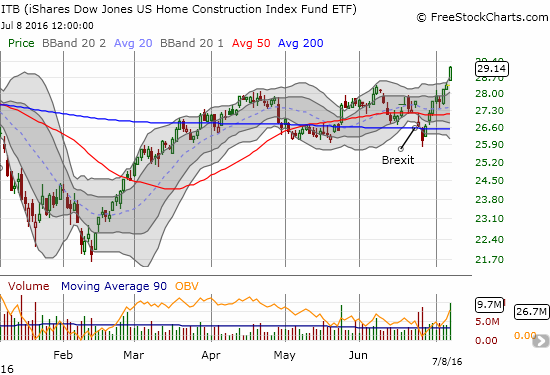
Source for above chart: StockCharts.com
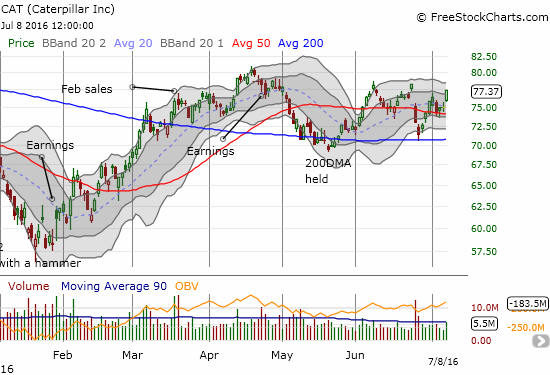
Caterpillar (CAT), one of my favorite individual stock indicators, seems to have confirmed 200DMA support. If CAT manages to break through recent highs, I will add to the list of confirming bullish moves. Regardless, I am keeping my collection of put options as they will go from a pure bearish bet to a small hedge on what will at that point be a flurry of bullish trades.
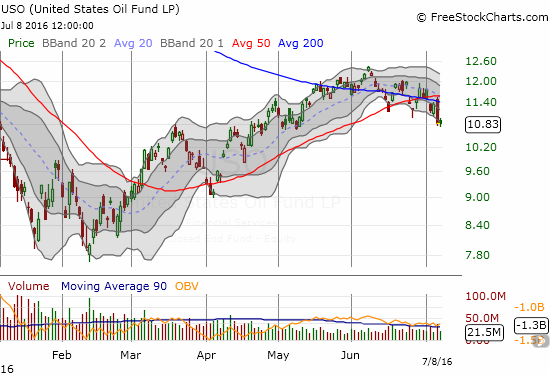
Oil is at least presenting a small dose of counter-reality as it continues along a downtrend in place since the early June high despite a marginal gain on the day. I almost missed this breakdown because suddenly the financial media are not talking about the (nutty) direct correlation between the stock market and oil. I find this new divergence extremely ironic on a day when just about everything gained in unison.
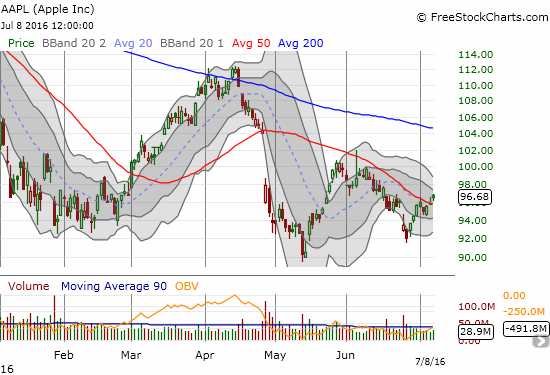
Finally, you KNOW things are getting giddy when even hapless Apple (AAPL) returns to some glory with a break above 50DMA resistance for the first time since the day before April earnings.
Seeing this collection of charts, any clear-headed trader must rightfully ask: how much longer can this rising tide that lifts all boats persist? Of course, we cannot definitively answer this question, but the need to ask the question serves as its own indicator of caution. Money is pouring into these markets from somewhere, somehow, but how much more momentum can be applied across competing assets? Perhaps China’s on-going devaluation and rising debt bubble, Japan’s deflation, and more and more accommodative monetary policies around the globe are now singing with the self-reinforcing dynamics of a perpetual motion machine. Perhaps the U.S. is once again a giant liquidity machine, sucking in a swell of invesmtnets from around the globe looking for a better home. I am skeptical of the sustainability of this action, but I am not too pure to trade it while it lasts. Stay alert!
— – —
Reference Charts (click for view of last 6 months from Stockcharts.com):
S&P 500 or SPY
U.S. Dollar Index (U.S. dollar)
EEM (iShares MSCI Emerging Markets)
VIX (volatility index)
VXX (iPath S&P 500 VIX Short-Term Futures ETN)
EWG (iShares MSCI Germany Index Fund)
CAT (Caterpillar).
IBB (iShares Nasdaq Biotechnology).
Daily T2108 vs the S&P 500
")
Black line: T2108 (measured on the right); Green line: S&P 500 (for comparative purposes)
Red line: T2108 Overbought (70%); Blue line: T2108 Oversold (20%)
Weekly T2108

*All charts created using freestockcharts.com unless otherwise stated
The charts above are the my LATEST updates independent of the date of this given T2108 post. For my latest T2108 post click here.
Related links:
The T2108 Resource Page
Be careful out there!
Full disclosure: long UVXY shares (just closed out latest short call options given the VIX is back to its lows), long EEM puts, long GLD, long USD/JPY, long ITB call options, long and short USO call and put options in a hedged trade