
(T2108 measures the percentage of stocks trading above their respective 40-day moving averages [DMAs]. It helps to identify extremes in market sentiment that are likely to reverse. To learn more about it, see my T2108 Resource Page. You can follow real-time T2108 commentary on twitter using the #T2108 hashtag. T2108-related trades and other trades are occasionally posted on twitter using the #120trade hashtag. T2107 measures the percentage of stocks trading above their respective 200DMAs)
T2108 Status: 40.2% (fell from 66.99%)
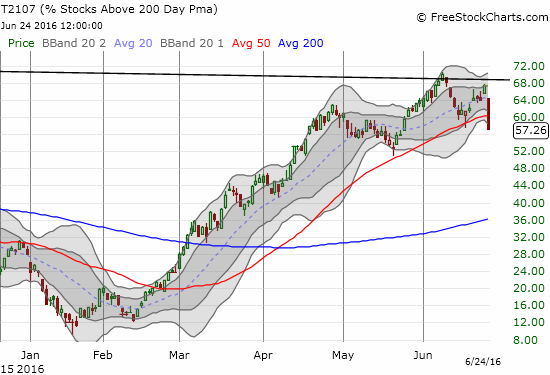
T2107 Status: 57.3% (fell from 67.4% – and from post-recession downtrend line)
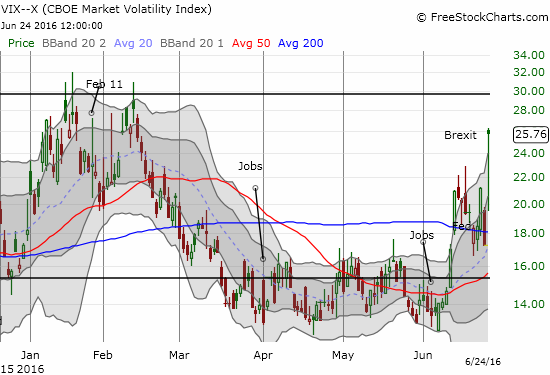
VIX Status: 25.8 (jumped 49%!!!)
General (Short-term) Trading Call: bearish
Active T2108 periods: Day #93 over 20%, Day #92 over 30%, Day #89 over 40%, Day #1 under 50% (ending 3 days over 50%), Day #1 under 60% (ending 1 days over 60%), Day #11 under 70%
Commentary
$FXY puts look "cheap". Bought July as hedge to bear pos & central bank intervention. $FXB puts looked cheap yesterday! $USDJPY #120trade
— Dr. Duru (@DrDuru) June 24, 2016
That tweet best describes my response to the carnage that was June 24, 2016, post-Brexit Day #1. After closing out a lot my bearish trades, I realized that I had to start thinking about a potential bounce. With USD/JPY trading around the 100 level, a fade on the Japanese yen (FXY) seemed like one of the more “obvious” trades. Going long the British pound (FXB), eventually, also looks like a great risk/reward trade for the longer-term (see “A Failed Hedge Underlines Potential For A Bottom In The British Pound“).
Sentiment on “Brexit” has to-date performed well as a trading tool. The steady increase in the search index, outside of one day with a downward blip, kept me focused on the bearish implications of the apparent anxiety. That anxiety reached a feverish pace by Friday with Luxembourg, of all things, suddenly topping the regional list of searchers. Note that Wednesday used to be the 100 (maximum) index level for what THEN looked like a rapid acceleration of searches. Now, the index for Wednesday is only a 9. Friday hit 100. Saturday fell back to 29. (The U.S. is nowhere to be found in the top 10 regions or cities – I will be looking to see whether this absence starts to change if/when Brexit has a larger impact on financial conditions in the U.S.)
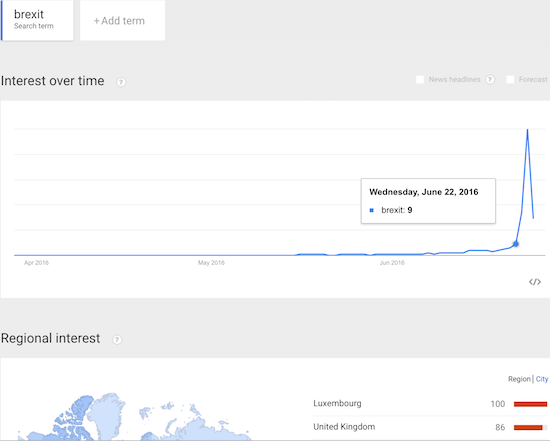
Source: Google Trends
I will next look to see whether Brexit returns to its previous insignificance as a search term or whether some new and higher baseline develops. A recognizable baseline will provide a platform for planning new trades. In the meantime, there is still ol’ reliable T2108, the percentage of stocks trading above their respective 40-day moving averages (DMAs).
In case you were confused about the UK’s relationship with Europe…
Friday’s reversal was a signature moment for T2108. Thanks to T2108’s tumble from overbought conditions on June 10th, I maintained a bearish bias. As I noted in the last T2108 Update, the rally into the Brexit vote was surreal relative to my bearish bias. Given my trading rules, Thursday’s rally was an irresistible opportunity to fade stocks and indices. The rally should have also been a time to increase my bullish bet on volatility. T2108’s sharp rejection from the edge of overbought territory (69.99%!) underlines my standing bearish short-term trading call.
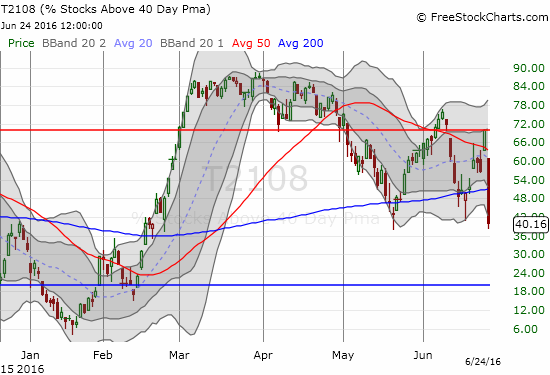
Note that T2108 bounced from current levels twice in the past month or so. Bears will be fortunate to get another bounce from here because I strongly suspect it will be the last one from these levels before a potential trip to oversold territory (below 20%).
T2107, the percentage of stocks trading above their 200DMAs, also made a definitive bearish move. Friday’s sell-off all but confirmed the post-recession downtrend line (shown streaking across the top part of the screen) as fresh resistance. I now assume that the earlier breakout was a fake-out.
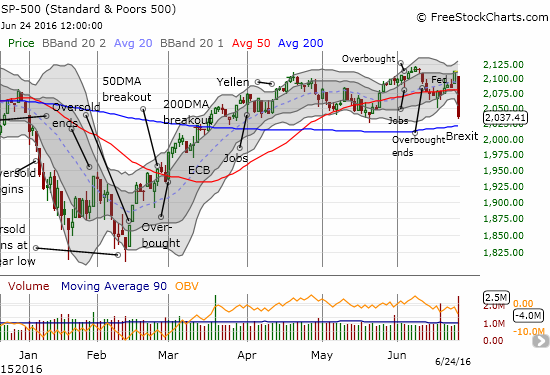
The major indices fell sharply on extremely high volume. The S&P 500 (SPY) is just a breath away from a 200DMA breakdown that will put the final confirmation on a freshly bearish tone of trading. For now, the latest 50DMA breakdown looks like the signature call of a top confirmed.
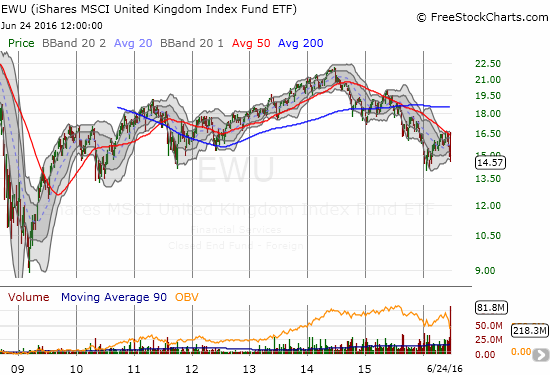
The carnage in Europe was much greater than in the U.S. The following ETF price changes are worsened by the unfavorable currency moves in the euro (FXE) and the British pound against the U.S. dollar.
- iShares MSCI United Kingdom (EWU) -12.0% (a 4-month low)
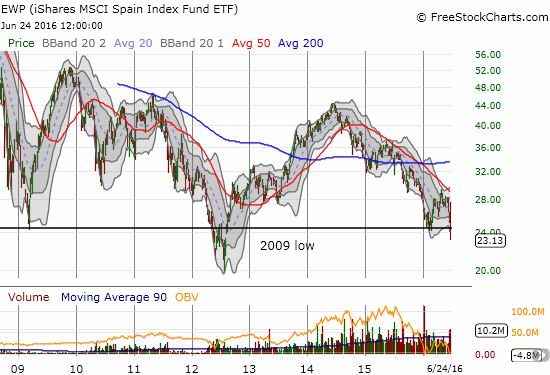
- iShares MSCI Spain Capped (EWP) -16.3% (a 4-year low and below the 2009 low)
- iShares MSCI Italy Capped (EWI) -15.0% (a 4-year low)
- iShares MSCI France (EWQ) -11.3% (a 4-month low)
- iShares MSCI Germany (EWG) -9.8% (a 4-month low)
- Shares MSCI Netherlands (EWN) -9.5% (a 4-month low)
It is particularly interesting to see how poorly EWU has fared since 2014 as the British pound has steadily lost value relative to the U.S. dollar.
Compare this to EWP which is also at a 4-year low.
The volatility index sums things all up. The VIX screamed higher for a 44% gain. Still, the VIX did NOT make a new high for the year. I strongly suspect it will before the Brexit volatility is finally behind us (not taking into account central bank interventions of course). Note how low the VIX fell after the big gap up: gap buyers went to work immediately at the open, but their buying power proved insufficient this time to keep the market propped up.
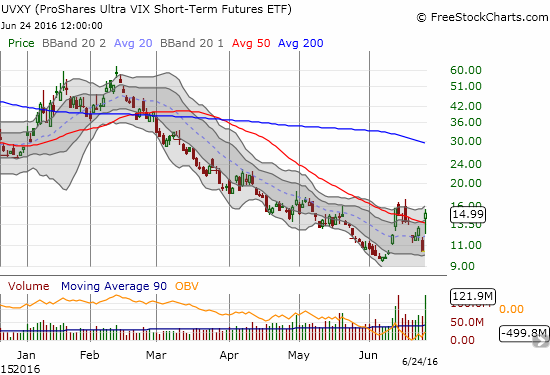
I decided to stand pat on my UVXY positions. I added a few puts just in case the VIX manages to plunge right away. My short calls sold against my UVXY shares expire this Friday. They have a $15 strike so I am fine with UVXY closing anywhere above $14 or so this week. The puts have a strike of $11.
Here is a summary of my other moves on Friday. As I noted, my main focus was on locking in profits on my latest bearish positions: sold put options in Deutsche Bank AG (DB), iShares MSCI Emerging Markets (EEM), Freeport-McMoRan Inc. (FCX), CurrencyShares British Pound Sterling ETF (FXB), and ProShares Ultra S&P500 (SSO); and covered short in BHP Billiton Limited (BHP). On the intraday rally I also faded Netflix (NFLX) and Baidu (BIDU) with put options.
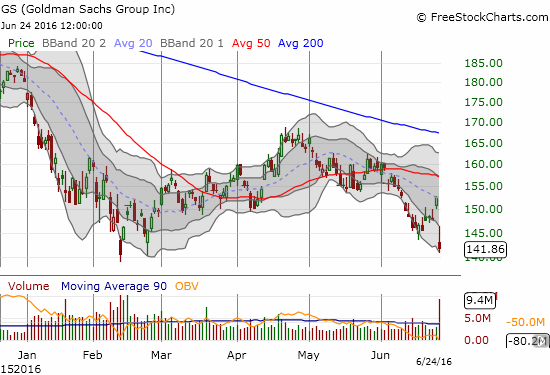
As my intro indicated, I was not 100% sour grapes on the day. I also decided to make some speculative buys as small hedges but, hopefully, very quick turn-around trades. I bought new call options on Rio Tinto (RIO) to start a new iron ore pairs trade. I took a flyer on call options on Goldman Sachs (GS).
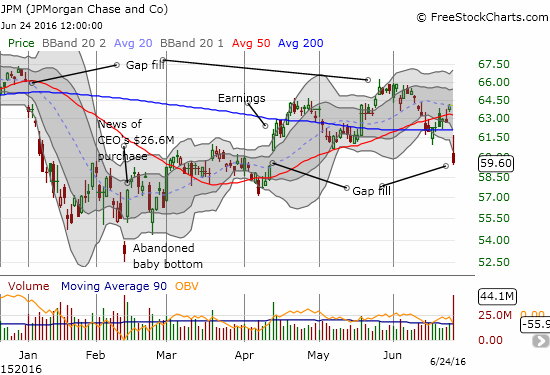
I also doubled down on JP Morgan Chase (JPM). I have become dedicated to playing JPM from the long side and buying dips. This move violated my technical sensibilities since JPM gapped down below 50 and 200DMA support. However, it filled the post-earnings gap which is a trigger point for a buy on a stock I want to accumulate. Observant traders will notice a breakdown from a head and shoulders (H&S) topping pattern – gulp….
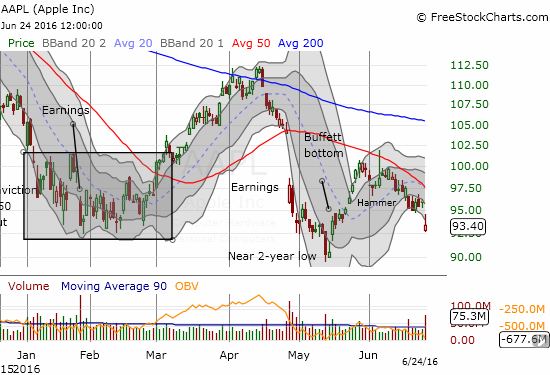
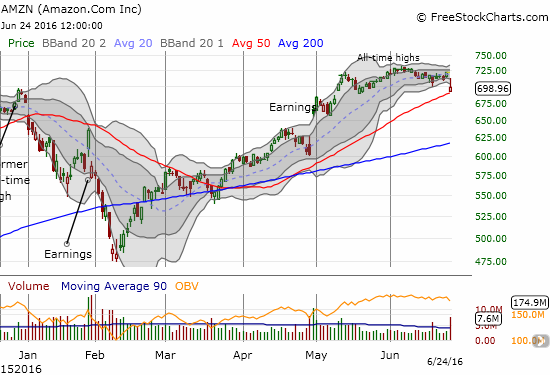
I even speculated on Apple (AAPL) call options. AAPL’s troubles may deepen given its great dependence on global growth for its own incremental growth. Troubles in Europe will transmit to China and both will transmit to Apple. Yet, I could not resist this trade given Apple’s tendency to have positive Mondays AND the now near complete reversal of the Buffett Bottom rally.
I noted in my last T2108 Update that the currency charts might look a lot different by the time readers reviewed the post. I did not suspect the bounce form the bottoms would be AS strong as they were! The Australian dollar stood out above others. The euro also bounced back against the U.S. dollar quite stubbornly. If I were not already in my full position, I would be shorting the euro here hand over fist. There is more post-Brexit fallout to come for the eurozone and the market remains uninterested in properly pricing in the risks.
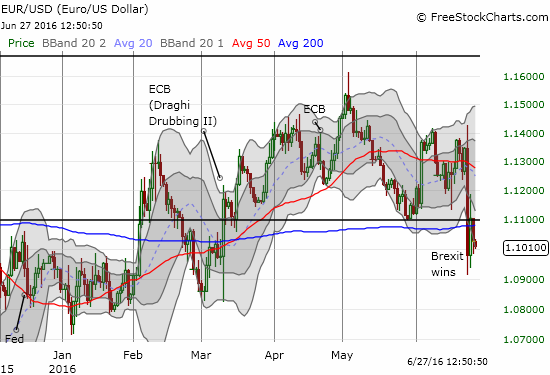
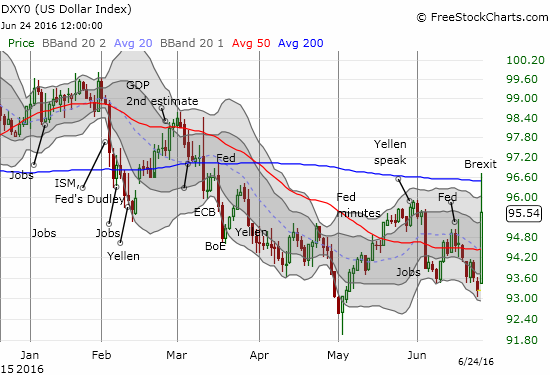
The U.S. dollar fared pretty well in currency trading but ended up fading from 200DMA resistance.
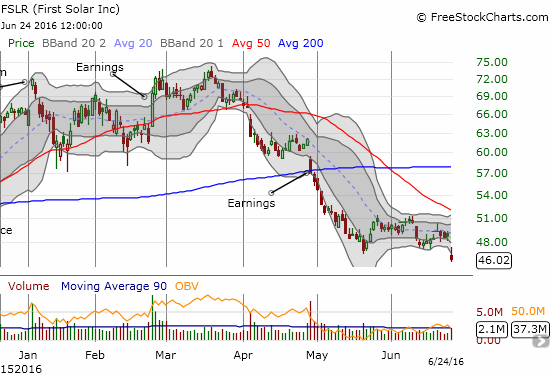
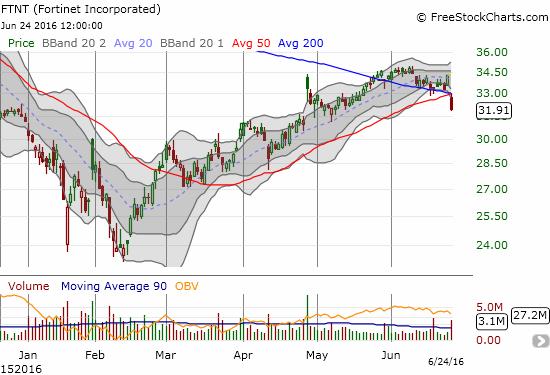
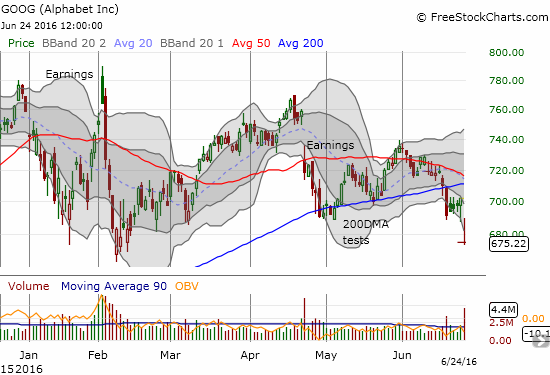
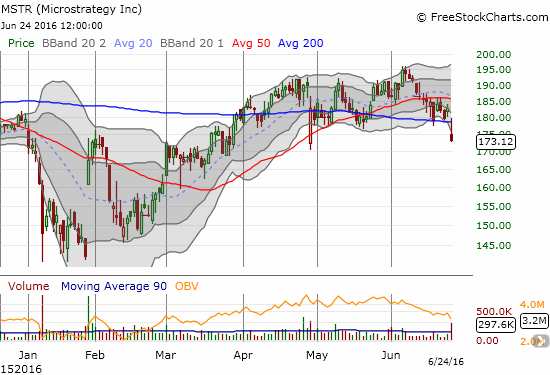
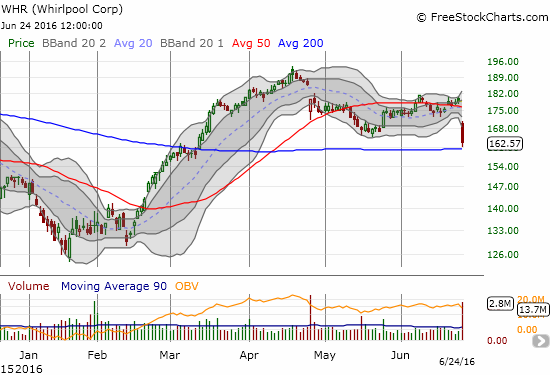
With my focus trained in on bearish opportunities, I am more actively scanning a wider range of stocks. There is still a good variety of setups and some stocks look like they are just getting started into a whole new world of trouble. See the captions for commentary on some key charts I reviewed today.
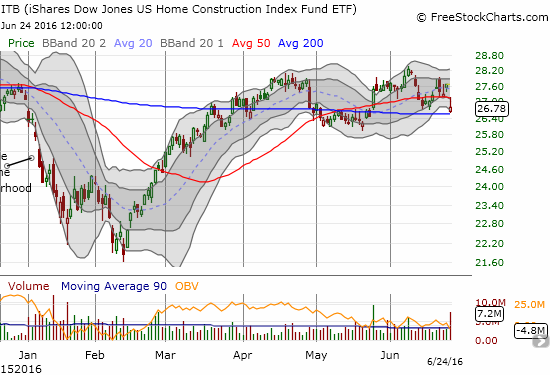
Finally, there are the home builders. These stocks should be relatively immune from global shockwaves. However, as cyclical stocks, home builders will get sold. The post-Brexit fallout is about to wash away the nascent bullish refresh that was growing from solid economic data from the sector. I should have an update of my Housing Market Review within a week. I also need to review critical earnings from Lennar (LEN) and KB Home (KBH).
— – —
Reference Charts (click for view of last 6 months from Stockcharts.com):
S&P 500 or SPY
U.S. Dollar Index (U.S. dollar)
EEM (iShares MSCI Emerging Markets)
VIX (volatility index)
VXX (iPath S&P 500 VIX Short-Term Futures ETN)
EWG (iShares MSCI Germany Index Fund)
CAT (Caterpillar).
IBB (iShares Nasdaq Biotechnology).
Daily T2108 vs the S&P 500
")
Black line: T2108 (measured on the right); Green line: S&P 500 (for comparative purposes)
Red line: T2108 Overbought (70%); Blue line: T2108 Oversold (20%)
Weekly T2108

*All charts created using freestockcharts.com unless otherwise stated
The charts above are the my LATEST updates independent of the date of this given T2108 post. For my latest T2108 post click here.
Related links:
The T2108 Resource Page
Be careful out there!
Full disclosure: long UVXY shares and put options, short UVXY call options, net long the British pound (at the time of writing!), net long the U.S. dollar, short the euro, long GS call options, long NFLX and BIDU put options, long JPM call options, long AAPL call options, long FXY put options