
The last Housing Market Review covered data released in March, 2016. At the time, the iShares US Home Construction ETF (ITB) was accompanying the market on an extended rally from the February lows. Resistance at the 200-day moving average (DMA) slowed down the advance. In April, ITB cleanly broke through resistance only to come to a halt after a promising gap up. I took profits on a few more positions in home builders as the seasonal trade in home builders wound down down. ITB stayed resilient and hung around just long enough until a double catalyst of soaring new home sales and strong earnings from Toll Brothers (TOL) generated a fresh breakout on tremendous volume.
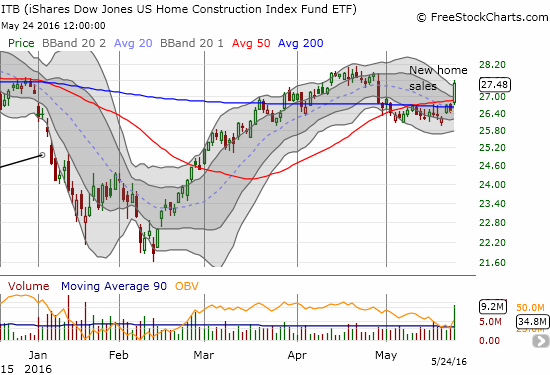
Source: FreeStockCharts.com
Suddenly, the trade on home builders has taken on new life even as time ticks down to the next rate hike from the Federal Reserve. From a strictly technical perspective, ITB is a strong buy all over again; buying on all dips as long as ITB stays above 50 and 200DMA support makes plenty of sense. I have adjusted my strategy accordingly.
New Residential Construction (Housing Starts) – April, 2016
In the last Housing Market Review I noted how a plunge in housing starts completed a series of bad signs in housing indicators. This month, starts stabilized to cling to the overall uptrend. Given the breakout in new home sales (see below), starts should succeed in keeping close to trend.
Privately owned housing starts for 1-unit structures came in at 778,000 for April. The March 1-unit starts were revised downward to 753,000 from 764,000. So, the month-over-month change was a gain of 3.6%. The year-over-year growth was 4.3%. The chart below shows the strong uptrend remains in place.
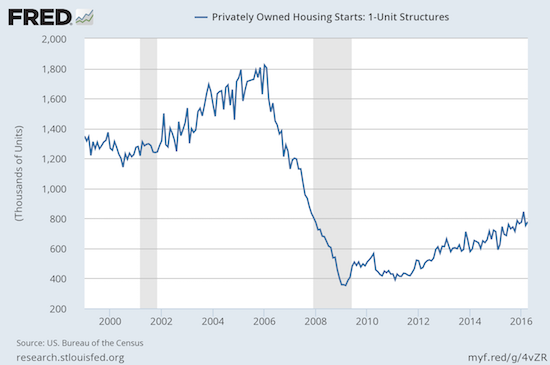
Source: US. Bureau of the Census, Privately Owned Housing Starts: 1-Unit Structures [HOUST1F], retrieved from FRED, Federal Reserve Bank of St. Louis, May 19, 2016.
The West stood out as the big loser for this report. Single unit starts dropped 14% from March, the second monthly drop in a row. Year-over-year, starts in the West dropped 20%. My concerns for the West region continue to grow as a result of this poor all-around performance. On the other hand, the South completely surprised me with an astounding 16% year-over-year jump that was also a 9% monthly gain. Is a new migration from the West to the South underway?
Existing Home Sales – April, 2016
With April delivering a second straight month of gains for existing home sales, February’s large month-over-month drop is confirmed as a blip. Despite the gains, the National Association of Realtors (NAR) was back to worrying about constrained housing supply and increasing prices:
“The temporary relief from mortgage rates currently near three-year lows has helped preserve housing affordability this spring, but there’s growing concern a number of buyers will be unable to find homes at affordable prices if wages don’t rise and price growth doesn’t slow.”
With the momentum returning in time for the Spring selling season, single-family homes performed well with a 6.2% year-over-year gain. The 4.81M homes sold was 0.6% above March’s pace. Total existing home sales had an interesting regional mix on a year-over-year basis. The Midwest and Northeast soared 12.1% and 17.5% respectively. However, both the South and the West experienced slight declines of 2.7% and 1.7% respectively. While the South gets a pass given strength in other categories, this breakdown keeps the West on my “caution” list.
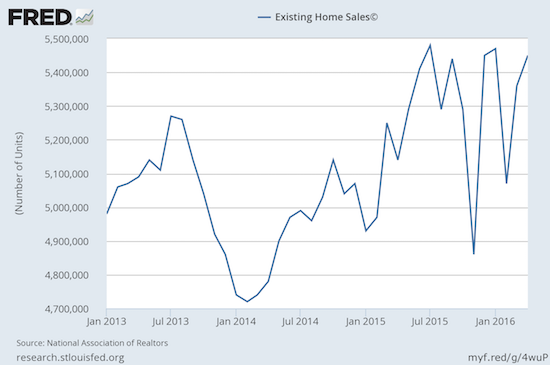
Source: National Association of Realtors, Existing Home Sales© [EXHOSLUSM495S], retrieved from FRED, Federal Reserve Bank of St. Louis, May 24, 2016.
Although housing inventory increased 9.2% from the prior month, inventory is still down 3.6% from a year ago. Over the last two months, inventory has had greater year-over-year and monthly drops. Yet, months of inventory increased again, this time from 4.4 to 4.7 months of supply. This level remains far short of the 6 months typically indicative of a balanced market. As a result, prices continue pushing upward. April’s 6.3% year-over-year increase in the median price of an existing home represents the 50th consecutive month of year-over-year increases.
Individual investors dropped again as a share of sales: from February’s 18% to March’s 14%, to April’s 13%. This share is still above the 12% trough in August, 2015. Recall that February’s 18% share was the highest since April, 2014.
First-time homebuyers trickled higher. Their share of purchases increased from 30% in March to 32% in April. The average for 2015 was 30%. Perhaps as interest rates move higher again, first-timers will come out in a larger numbers to get ahead of the rate cycle.
New Residential Sales – April, 2016
This month was ALL about the new home sales. Sure existing home sales were encouraging, but new home sales blew the roof off. Frankly, I was expecting nothing but disappointment given the lukewarm housing numbers in recent months.
New single-family home sales for April soared 16.6% above March’s level and a whopping 23.8% year-over-year. This is a dramatic turn-around from three straight monthly declines which housing bears overplayed. The 619,000 new homes sold takes the housing market all the way back to January, 2008 when sales hit 627,000 in the first month of the Great Recession. I earlier assumed new single-family home sales would settle into a range. This breakout stands out as very bullish, but I want to see home buyers sustain this momentum in coming months before I get too excited. For example, did the industry pull in future sales somehow? Regardless, this burst of buying could also put the seasonal trade on home builders back in play. Stay tuned on that one!

Source: US. Bureau of the Census, New One Family Houses Sold: United States [HSN1F], retrieved from FRED, Federal Reserve Bank of St. Louis, May 24, 2016.
New home inventory plummeted to 4.7 months after sitting at 5.8 months for two straight months. The next big question is whether home builders will use this surge in activity as an opportunity to more aggressively push prices in strong markets.
Three of the four regions contributed to April’s strong performance. While the Northeast, South, and West jumped 323%, 18%, and 24% respectively year-over-year, the Midwest was a big laggard by managing a 9% decline. Given the Northeast contributed so heavily to April’s performance, I am expecting May to deliver numbers more in line with the range going into April. The Northeast is off to a hot start this year with year-over-year changes of 100%, -4%, and 30% in the first three months of the year. The West has proven exceptionally volatile with year-over-year changes of -24%, +10%, and -21% to start the year. Perhaps May will prove to be a down month and further contribute to more tame aggregate new home sales.
Home Builder Confidence: The Housing Market Index– May, 2016
The Housing Market Index (HMI) has essentially flatlined with a reading of 58 for the fourth consecutive month. Underneath this stabilization is the encouraging sign of single-family detached 6 months continuing a very slight rebound. The single-family detached present is still locked in a downtrend. This persistent drop is VERY surprise in the context of the strong new home sales for April; thus, one more reason to expect May sales to return to recent norms. The rebound in the traffic of prospective buyers has flattened out. The Spring selling season failed to renew upward momentum in the HMI. In the last Review, I noted that the numbers seemed to confirm a plateau for HMI. I believe in this projection even more firmly now.
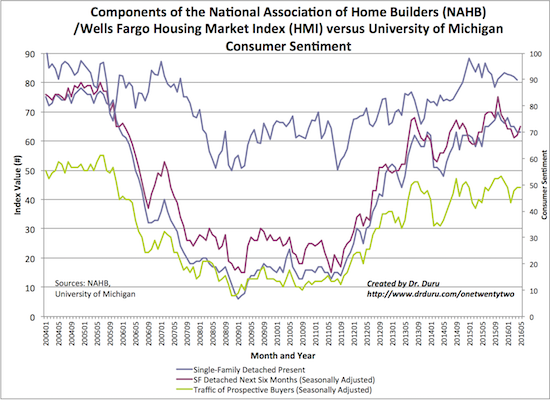
Source: The National Association of Home Builders (NAHB)
In May, the three-month moving averages for regional HMI scores for the South and Midwest perked up by a point and reversed the previous month’s one point loss. The West stopped the 2-point bleed from the previous month by holding steady. The Northeast was the laggard with a 3-point loss that follows a 2-point loss in the previous month. Given the apparent slowing in the West, I am surprised sentiment there did not continue to decline as it has in the Northeast. The overall decline in sentiment in the Northeast contrasts with the strong year-over-year showing there so far in 2016.
Parting thoughts
Until this Review, I had concluded that the data and trading technicals were flashing signs of caution for trades on home builders. I even claimed “I just think the odds for near-term upside no longer out-weight the near-term risks…I think ITB has plateaued for the seasonal trade.” I now find myself with just two remaining positions: Tri Pointe Group (TPH) {still maintaining patience} and Toll Brothers (TOL).
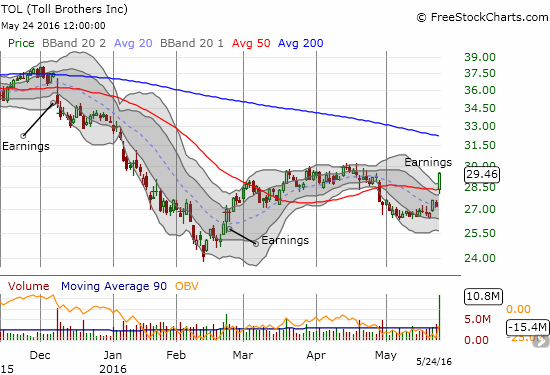
In the last review, I labeled Toll Brothers as a “huge enigma” given its low valuation and steep discount to recent multi-year highs. The market’s positive response to TOL’s earnings was encouraging, but it only returns the stock to around its price during the last Review. The strong buying volume and fresh 50DMA breakout suggests TOL should stay above water for a while.
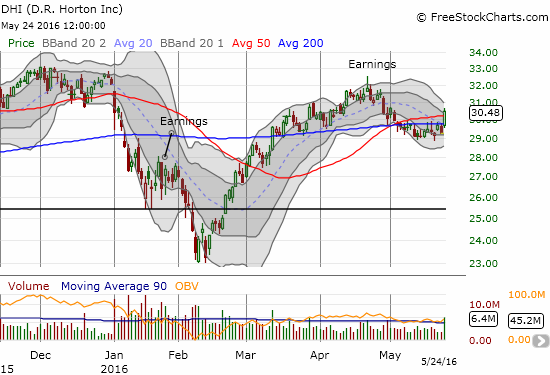
With the builders having such a good day, I reviewed my entire list of housing-related charts. Surprisingly enough, D.R. Horton (DHI) is the only stock of the bunch that is cleanly clearing out overhead resistance. If I go for another individual stock – not likely as long as the seasonal trade home builders is inactive – DHI will top the list.
Source for stock charts: FreeStockCharts.com
Be careful out there!
Full disclosure: long TOL, TPH