
(T2108 measures the percentage of stocks trading above their respective 40-day moving averages [DMAs]. It helps to identify extremes in market sentiment that are likely to reverse. To learn more about it, see my T2108 Resource Page. You can follow real-time T2108 commentary on twitter using the #T2108 hashtag. T2108-related trades and other trades are occasionally posted on twitter using the #120trade hashtag. T2107 measures the percentage of stocks trading above their respective 200DMAs)
T2108 Status: 69.99% (jumped from 56.7%)
T2107 Status: 67.4%
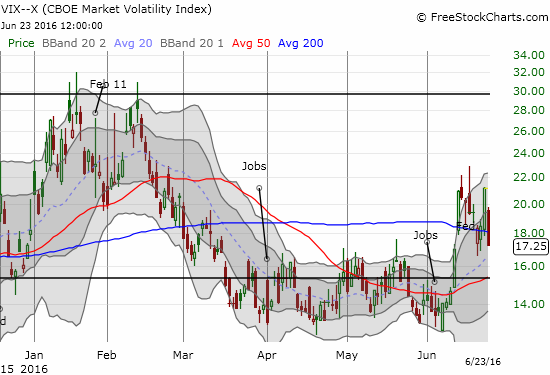
VIX Status: 17.3
General (Short-term) Trading Call: bearish
Active T2108 periods: Day #92 over 20%, Day #91 over 30%, Day #88 over 40%, Day #3 over 50%, Day #1 over 60% (ending 2 days under 60%), Day #10 under 70%
Commentary
Voters in the United Kingdom rejected membership in the European Union (EU) in the referendum affectionately known as “Brexit.” The vote came down to 51.9% for leaving, and 48.1% for staying. Given the contentious nature of the debate, this margin of victory should be large enough to compel the government in the UK to proceed with a divorce from the EU. Indeed, UK Prime Minister David Cameron, who launched the referendum, announced his resignation in the wake of this defeat.
This result is being described as a shock and a huge surprise in some media headlines. I think of the result as more surreal than shocking. Surely when looking at the rallies in financial markets and the retreat in many typical indicators of fear, I can excuse anyone for expecting Brexit to fail. The rallies were an extension of the market celebrations that kicked off the week as polls showed the remain side regaining advantage. However, the polls never showed a decisive victory for either side and a large block of undecideds consistently hung out in the wings ready to swing the vote. Under such conditions, I would have expected an abundance of caution from traders. Instead, caution was essentially tossed to the wind.
So when the volatility index, the VIX, reversed sharply form the previous day’s surge, I just marveled at the trading action.
The VIX’s plunge left sentiment as shown by Google Trends as the last piece of evidence of elevated anxiety. Searches on “Brexit” reached a new high on Wednesday (index = 100).
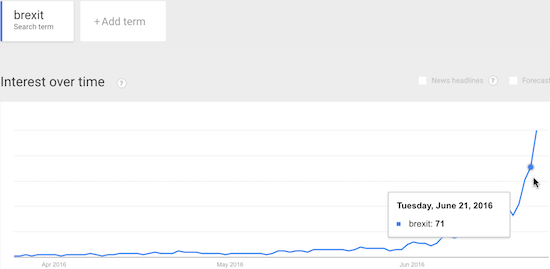
Source: Google Trends
(I cannot wait to see how Brexit sentiment changes for the rest of the week!)
The market has delivered one surreal day after another. Assuming that the market “knew” something I just did not understand, I did not even cover the call options on ProShares Ultra VIX Short-Term Futures (UVXY) that I sold short the previous day (for details on that trade see “Fear Indicators Diverge On Brexit Eve“). I started to expect a huge implosion of implied volatility following the Brexit vote (no matter the outcome). However, I was stubborn enough to stick to my bearish trading call. T2108 even delivered a surreal confirmation of my bearishness by closing right at the edge of overbought conditions with a value of 69.99%. I used two decimals to make clear that T2108 did NOT hit overbought territory at the close.
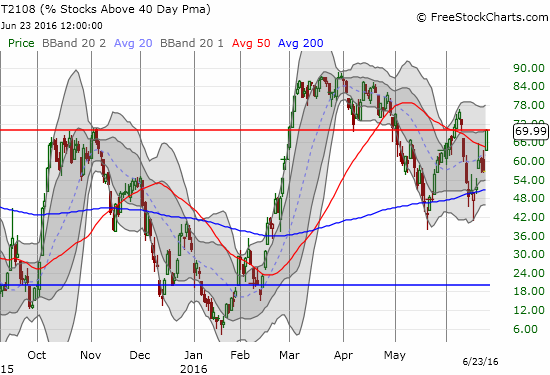
Assuming Friday delivers a gap down at the open, the market will confirm the short-term bearish call with an exclamation point. As a reminder, I describe the market as bearish whenever T2108 falls from overbought conditions or reverses at the border of overbought territory. (For more details, see my recently updated primer on T2108).
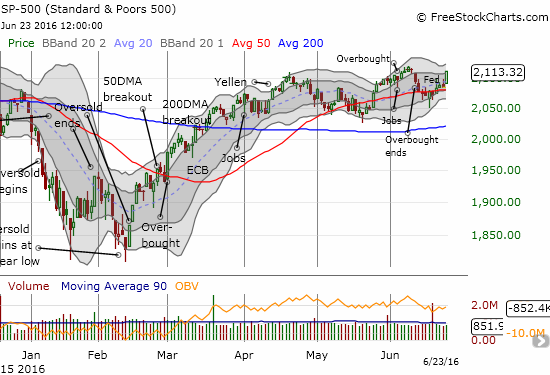
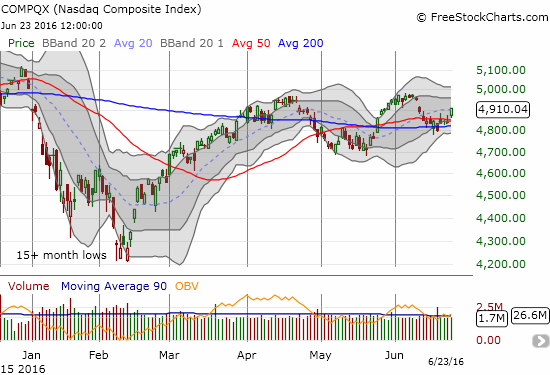
Given my bearish stance, my trades were dominated by closing out more longs and initiating new shorts to fade the rally. There was plenty to fade because the major indices soared in what looked like very bullish fashion to complement the plunge in volatility. The S&P 500 (SPY) jumped 1.3% in a move that confirmed 50DMA support. The bullish move was highlighted by a firm close right at the high of the day. The NASDAQ (QQQ) also confirmed 50DMA support.
I used the rally to double down on put options on ProShares Ultra S&P500 (SSO). I made another change in my iron ore pairs trade by locking in profits on my Rio Tinto (RIO) call options and adding to my short on BHP Billiton Limited (BHP). I doubled down on my put options on Deutsche Bank AG (DB). I restarted a position on iShares MSCI Emerging Markets (EEM) with new put options. I even moved a day early and reloaded on put options on Freeport-McMoRan Inc. (FCX). For good measure I bought a single put option on CurrencyShares British Pound Sterling ETF (FXB). Of course, I wish I had loaded up on FXB put options!
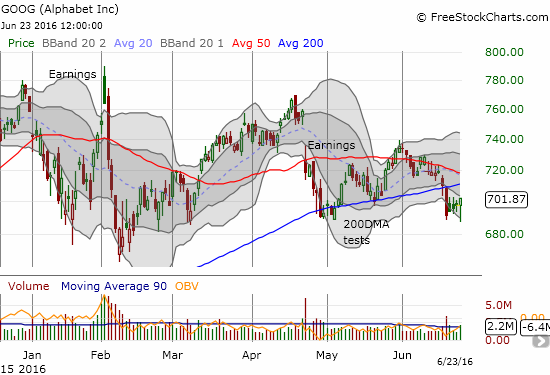
Perhaps my biggest misses on the day were in failing to fade the rally in Netflix (NFLX) and Alphabet (GOOG) – two darling stocks I pointed out were in the middle of breakdowns. GOOG was particularly interesting because at its lows, the stock confirmed the 200DMA breakdown. The rally on the day placed the stock right back into post-breakdown limbo. However, assuming the stock market remains in bearish position, GOOG’s 200DMA breakdown should be played form the short side.
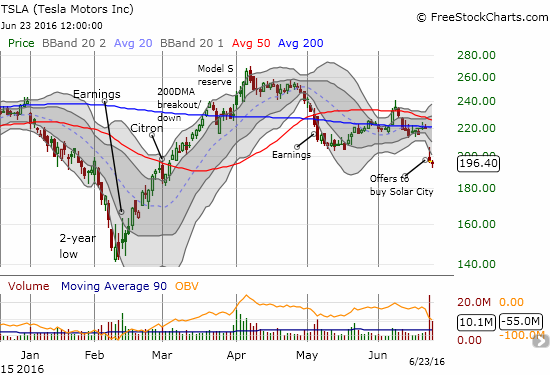
The trade I will probably most regret in the morning is going long Tesla (TSLA) for a day trade. Until Brexit, the doji below the lower-Bollinger Band (BB) looked ripe for a bounce. A fresh lesson against turning a day trade into a swing trade, especially when it flies against the short-term trading bias!
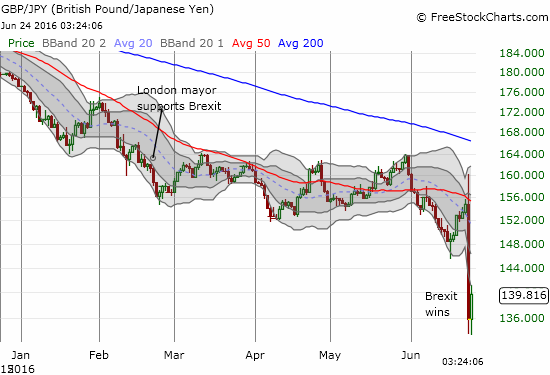
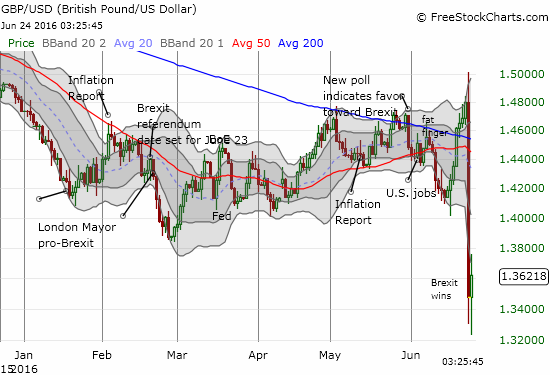
The currency markets are of course roiling from the Brexit vote. Even though I heard plenty of warnings about the potential depth of selling in the pound in the Brexit scenario, I am still left astounded. At one point I saw the pound trading off about 13% against the Japanese yen (JPY) and off 9% or so against the U.S. dollar. Here are the charts as I am writing. They are bound to be different by the time you read this – especially if major central banks decide to start forex and other market interventions before the weekend. Note that the pound has been putting up a valiant battle to hold the lows for the last few hours or so.
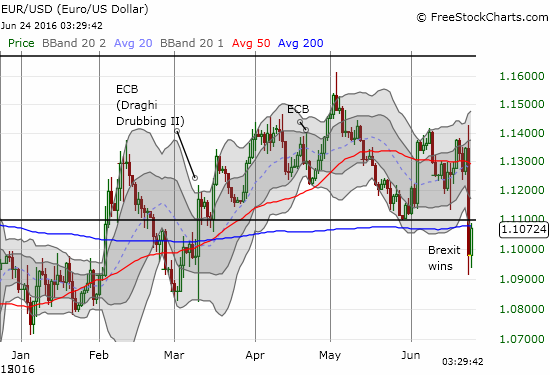
The British pound is not the only story. The euro (FXE) is also in the crosshairs. The current sell-off vindicates my long-suffering short position that I have stubbornly held for many months now! In previous commentary I noted how the euro was largely being ignored as a source of risk in a Brexit vote. I have come to appreciate the resilience of the euro and the stubbornness of euro fans (longs), so I do not expect the euro to just roll over easily from here.
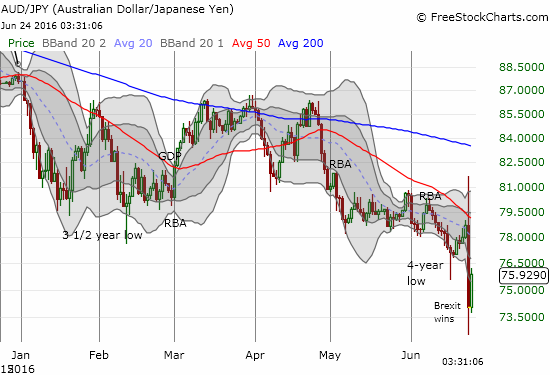
The Australian dollar is also suffered some blows as risk off is the order of the day. AUD/JPY now screams bearishness with a fresh, and major, breakdown in the wake of Brexit.
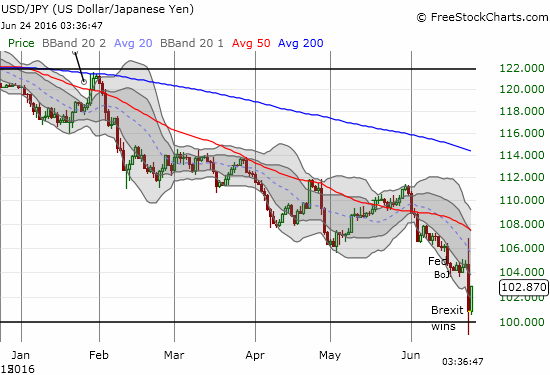
My big outstanding question now is whether I can navigate around the likely imminent interventions from the world’s major central banks. In particular, the Bank of England (BoE) and the European Central Bank (ECB) have already promised to provide liquidity and support to markets in the wake of post-Brexit volatility. They will have to shoot bullets judiciously because the EU-UK break-up will take months and feature plenty of on-going uncertainty. The restless citizens of other countries may also start to clamor for their own referendums on EU membership. With USD/JPY temporarily plunging below the magic 100 level, I have to imagine the BoJ is finally ready to give another shot at weakening the yen. I am hoping this achievement completes my strategy to accumulated USD/JPY down to this presumed level of support while hedging in other positions (particularly GBP/JPY and AUD/JPY).
For now, my forex strategy is fading rallies in the British pound, locking in profits as quickly as practical, and periodically riding counter-rallies. This trade was a lot easier to do in the immediate wake of the Brexit results, so I think this strategy may be coming to the end of its effectiveness. Stay tuned!
— – —
Reference Charts (click for view of last 6 months from Stockcharts.com):
S&P 500 or SPY
U.S. Dollar Index (U.S. dollar)
EEM (iShares MSCI Emerging Markets)
VIX (volatility index)
VXX (iPath S&P 500 VIX Short-Term Futures ETN)
EWG (iShares MSCI Germany Index Fund)
CAT (Caterpillar).
IBB (iShares Nasdaq Biotechnology).
Daily T2108 vs the S&P 500
")
Black line: T2108 (measured on the right); Green line: S&P 500 (for comparative purposes)
Red line: T2108 Overbought (70%); Blue line: T2108 Oversold (20%)
Weekly T2108

*All charts created using freestockcharts.com unless otherwise stated
The charts above are the my LATEST updates independent of the date of this given T2108 post. For my latest T2108 post click here.
Related links:
The T2108 Resource Page
Be careful out there!
Full disclosure: long UVXY shares and put options, short UVXY call options, net short the British pound, net short the Japanese yen, net long the U.S. dollar, short the euro, net short the Australian dollar, long SSO put options, other positions noted in the post.