
(T2108 measures the percentage of stocks trading above their respective 40-day moving averages [DMAs]. It helps to identify extremes in market sentiment that are likely to reverse. To learn more about it, see my T2108 Resource Page. You can follow real-time T2108 commentary on twitter using the #T2108 hashtag. T2108-related trades and other trades are occasionally posted on twitter using the #120trade hashtag. T2107 measures the percentage of stocks trading above their respective 200DMAs)
T2108 Status: 75.9% (overbought)
T2107 Status: 70.1%
VIX Status: 14.1
General (Short-term) Trading Call: cautiously bullish
Active T2108 periods: Day #81 over 20%, Day #80 over 30%, Day #77 over 40%, Day #11 over 50%, Day #10 over 60%, Day #3 over 70% (overbought)
Commentary
It finally happened. T2107, the percentage of stocks trading above their respective 200-day moving averages (DMAs), finally broke through its post-recession downtrend. The last downtrend was set with 2013’s peak and confirmed by 2014’s peak. While this move is a very significant technical development, I must duly note that previous downtrends ended with breakouts in 2012 only to precede some nasty sell-offs. For now, I assume the breakout reinforces the current bullishness of the market. I am now on alert for any signs that T2107 is finally running out of gas. The trading bias stays on “cautiously” bullish until the S&P 500 (SPY) follows T2107’s breakout with its own breakout to new all-time highs.
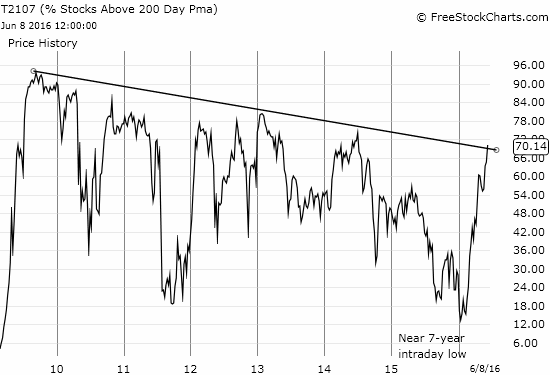
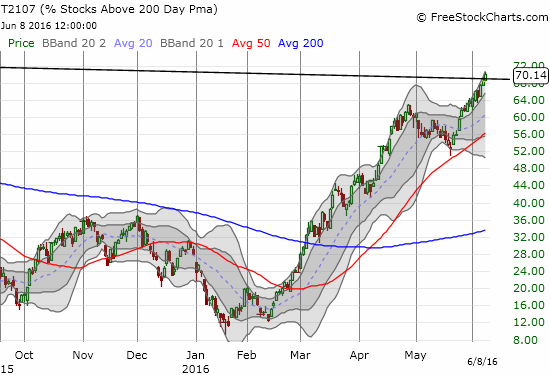
T2107’s breakout is particularly notable given it occurred on the heels of printing a near 7-year low during a very strenuous oversold period. This momentum and turn-around is impressive.
T2108, the percentage of stocks trading above their respective 40DMAs, continues its extension into overbought territory by closing at 75.9%. The S&P 500 (SPY) once again printed marginal gains in what looks like a drip-by-drip approach to the all-time high.
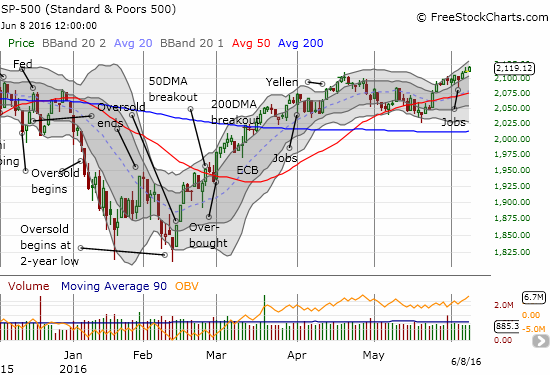
Note how the poor May U.S. jobs report barely interrupted the S&P 500’s current march higher.
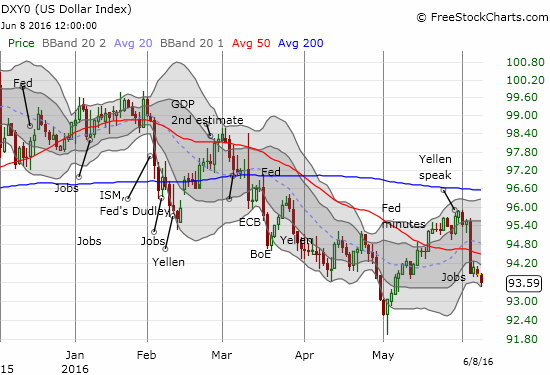
On the flip side, the jobs report completely disrupted the U.S. dollar’s (DXY0) bounce from its most recent low. The selling in the dollar experienced follow-through today. It looks like the recent low could get retested sooner than later.
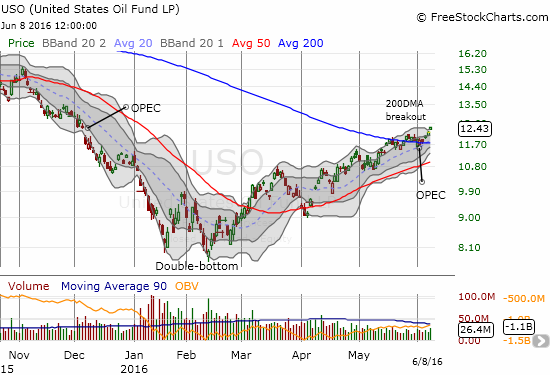
The dollar’s renewed weakness has boosted commodities and other anti-dollar plays. Oil has benefited with an extra boost that adds to a steady uptrend in place since the January/February double-bottom. Strong dollar or weak dollar, oil has has trended higher and higher. The recent gains for United States Oil Fund LP (USO) this week confirm its breakout above its 200DMA last week. (Surprisingly, my hedged USO play is still only breakeven right now!).
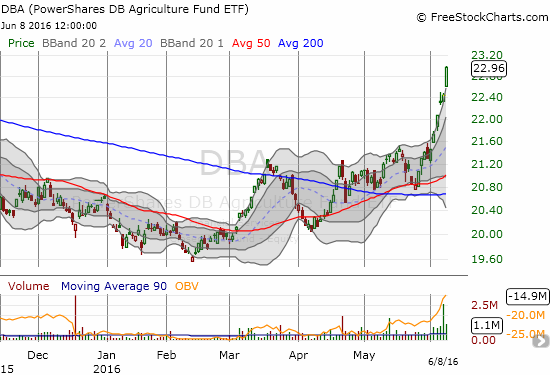
On a related note, a STRONG rally in agricultural commodities is only just now regaining my attention. The Powershares DB Agriculture Fund (DBA) has soared in recent days. DBA broke out to a new 10-month high the day before last week’s jobs report. The agricultural index is now stretching for an important retest of a peak from last June/July.
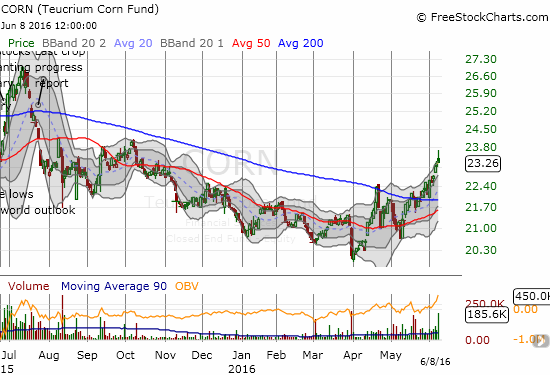
Even my much maligned position in Teucrium Corn ETF (CORN) has regained some long lost momentum. The latest fundamental factors driving corn are explained well in “The Price Of Corn Could Keep Rising” from May 31, 2016.
I find it particularly ironic that commodities may have finally bottomed just as the U.S. Federal Reserve is struggling desperately to start “normalizing” interest rates.
I end on a pet topic of mine: trading volume.
Summer trading is upon us and complaints about trading volume will likely reach seasonal highs. I continue to run into fellow traders who want to make a big deal out of trading volume even though the stock market and individual stocks have had no problem rising on poor volume for much of this post-recession period. As a result of these complaints, I take notice when I find counter-examples.
I stumbled upon one great counter-example of the importance of trading volume in Verifone Systems (PAY). PAY plunged 24.7% in reaction to a very poor earnings report. Right before this collapse, buyers ramped up the stock for all of June on increasing trading volume. This volume spiked just ahead of earnings. Starting in August, 2015, PAY experienced six bouts of strong buying volume. All but two of these periods preceded notably lower prices. In other words, strong buying volume tended to signal the beginning of the end of a rally instead of confirming its strength.
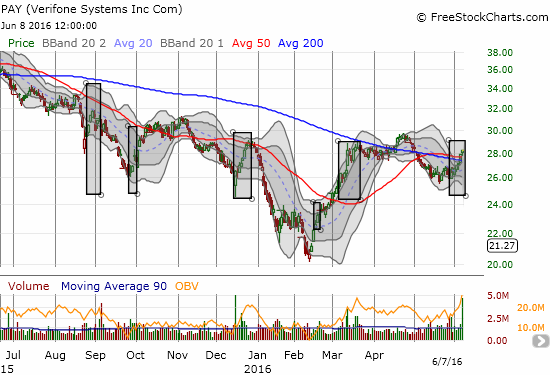
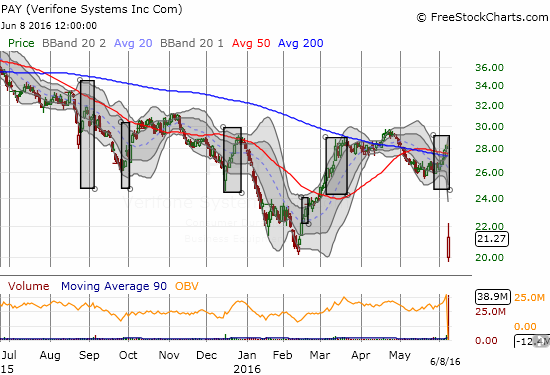
I bought PAY as it bounced off its post-earnings low as a play on an over-extension below the lower Bollinger Band (BB).
Amazon.com (AMZN) is trading at all-time highs. Yet, trading volume fell off a cliff starting in late May.
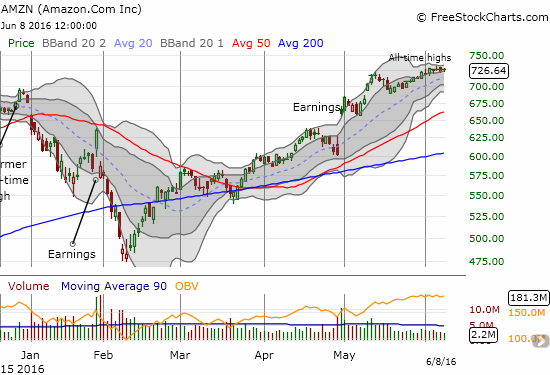
In other words, context is everything when it comes to trading volume. In one context a surge in buying volume can flag the final exhaustion of buying power when a stock is fundamentally weak. In another context a stock can continue higher as long as sellers refuse to step in the way of the advance. A lack of volume is not conclusive in of itself. Having said that, strong trading volume SHOULD confirm a big move up or down that generates a breakout or breakdown.
As volume dries up during the seasonally slow summer months, I do not expect stocks or indices to “decide” to wait for better participation before making more significant moves.
— – —
Reference Charts (click for view of last 6 months from Stockcharts.com):
S&P 500 or SPY
U.S. Dollar Index (U.S. dollar)
EEM (iShares MSCI Emerging Markets)
VIX (volatility index)
VXX (iPath S&P 500 VIX Short-Term Futures ETN)
EWG (iShares MSCI Germany Index Fund)
CAT (Caterpillar).
IBB (iShares Nasdaq Biotechnology).
Daily T2108 vs the S&P 500
")
Black line: T2108 (measured on the right); Green line: S&P 500 (for comparative purposes)
Red line: T2108 Overbought (70%); Blue line: T2108 Oversold (20%)
Weekly T2108

*All charts created using freestockcharts.com unless otherwise stated
The charts above are the my LATEST updates independent of the date of this given T2108 post. For my latest T2108 post click here.
Related links:
The T2108 Resource Page
Expanded daily chart of T2108 versus the S&P 500
Expanded weekly chart of T2108
Be careful out there!
Full disclosure: long PAY, long CORN, net long the U.S. dollar, short USO puts and calls, long USO calls