
(T2108 measures the percentage of stocks trading above their respective 40-day moving averages [DMAs]. It helps to identify extremes in market sentiment that are likely to reverse. To learn more about it, see my T2108 Resource Page. You can follow real-time T2108 commentary on twitter using the #T2108 hashtag. T2108-related trades and other trades are occasionally posted on twitter using the #120trade hashtag. T2107 measures the percentage of stocks trading above their respective 200DMAs)
T2108 Status: 71.8% (overbought)
T2107 Status: 68.2% (below post-recession downtrend again)
VIX Status: 14.6
General (Short-term) Trading Call: cautiously bullish
Active T2108 periods: Day #82 over 20%, Day #81 over 30%, Day #78 over 40%, Day #12 over 50%, Day #11 over 60%, Day #4 over 70% (overbought)
Commentary
%stocks>40DMA falling below overbought threshold (70%). A close below would be (short-term) bearish. $SPY #T2108
— Dr. Duru (@DrDuru) June 9, 2016
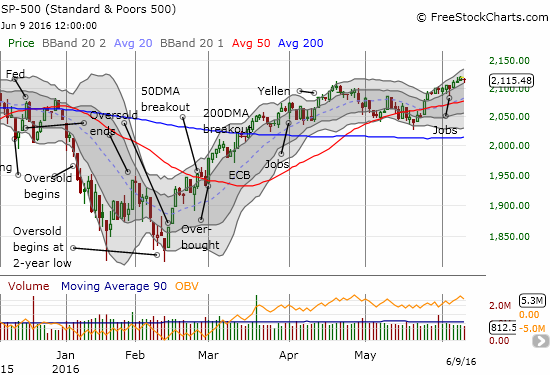
Today was a close call! T2108 closed at 71.8%, just barely recovering from a breach of the overbought threshold at 70%. A close below this level would have flipped my short-term trading bias to bearish per my T2108 trading rules. T2107, the percentage of stocks trading above their 200-day moving averages (DMAs), closed at 68.2%, just below the big post-recession downtrend line that gave way just yesterday. I celebrated the big breakout (with caution of course) in the last T2108 Update.
Sellers once again proved unable to muster enough motivation to follow-through on an initial advantage. The S&P 500 (SPY) made a shallow dip to the bottom of its current uptrend channel – defined by the upper Bollinger Bands (BB) – and then neatly bounced back for a minute 0.2% loss on the day.
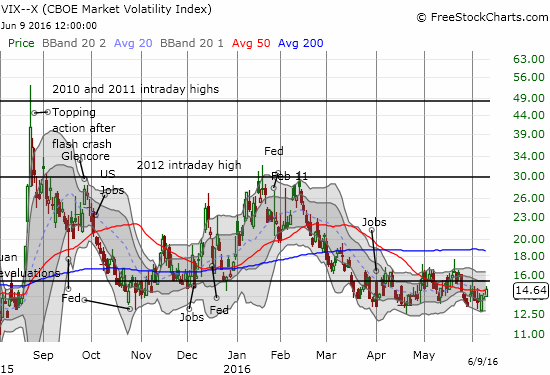
While sellers fail on the indices, the traditional gauge of fear, the VIX, continued its gains off the bottom of the recent trading range. I am watching closely but will not get concerned until the VIX closes above the 15.35 pivot. Even then, the VIX needs to break out above the current range (above 17.50 or 18 or so) before fear/concern makes a point worth noting. My purchase of call options on ProShares Ultra VIX Short-Term Futures (UVXY) turned out to be well-timed but the gains are minimal so far.
The VIX probably made such a big move relative to the S&P 500 because roiling under the surface of the market were some significant downward moves on the day in key sectors and stocks. I even had to open fresh bearish positions because of them (when I am cautiously bullish I allow myself some select bearish trades).
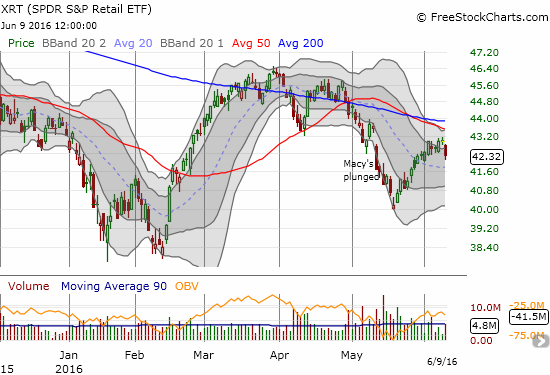
The SPDR S&P Retail ETF (XRT) lost 1.5% as it appeared to fail just below 50DMA resistance. A limit order for put options executed. I am targeting around $40. I do not expect that level to break unless the entire market turns bearish. I have followed this sector more closely ever since one retailer after another produced major stinkers this past earnings cycle.
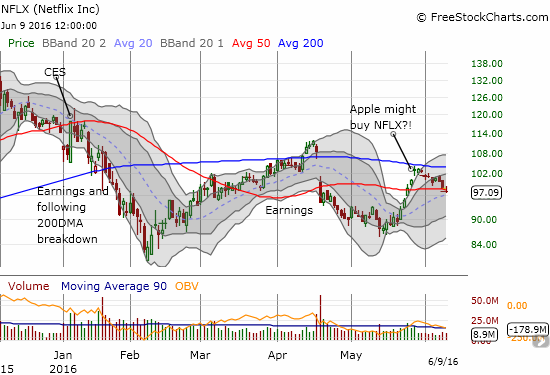
Netflix (NFLX) has not been the same ever since someone recycled rumors about Apple’s (AAPL) interest in buying the company. That gap up took the stock right to resistance at its 200DMA and now NFLX trades below 50DMA support. If not for the unimpressive selling volume and the steeply upward trending 20DMA, I would be aggressively shorting NFLX here. Still, the 50DMA breakdown IS a bearish signal.
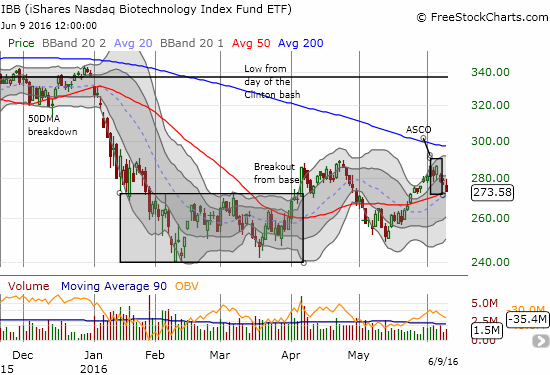
The iShares Nasdaq Biotechnology ETF (IBB) added to the red on the day with a 1.8% loss. I never got a chance to swing during the run-up form the last low, and I waited for the market’s reaction to the American Society of Clinical Oncology (ASCO) annual meeting before deciding to enter. The market’s reaction was to buy on the way in and sell on the way out.
Bad economic data from China was blamed for broad-based selling in related plays. The iShares MSCI Emerging Markets ETF (EEM) gapped down for a 1.2% loss that seemed to end a steady run-up from the May low. (Hmmmm – starting to notice that the sell-in-May and go away crowd must be getting a bit anxious at this point). I neglected to note in the last T2108 Update that I pulled the trigger on a fresh strangle position on EEM (out of the money call and put options).

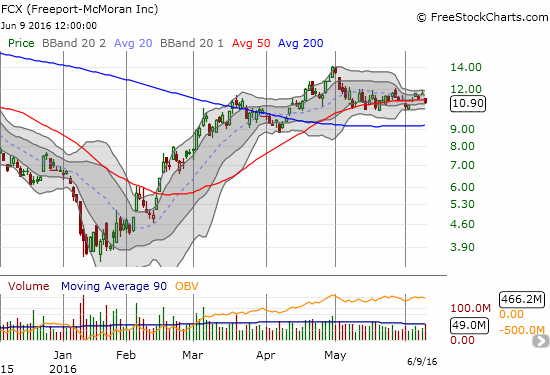
Copper is the main driver for Freeport-McMoRan Inc (FCX). A nasty plunge in copper helped pushed FCX close to a year 2000 and all-time low. Since then, the stock has increased an incredible 3x. That run-up ended with April. In its place is churn around 50DMA support. After watching this a while, I am thinking of how best to play the range. I am getting ready to buy call options (on top of an existing position of shares bought a while ago) as my first attempt. As part of the China-driven pullback, FCX lost 5.9% on a gap down.
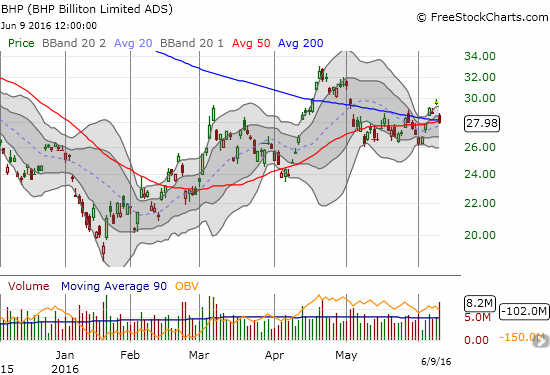
Iron ore plays also took a beating on the day. BHP Billiton Limited (BHP) gapped down and ended the day with a 5.6% loss. Like FCX, BHP is pivoting around its 50DMA. However, I think BHP is setting up for a fresh breakdown. Since April’s high, selling volume has overwhelmed buying volume. The volume on today’s gap down was particularly large, and it left behind a small abandoned baby top. As part of my dynamic pairs trade strategy, I faded BHP on the latest rally and now hold a substantial short paired with call options on Rio Tinto (RIO) and now hedged with call options on BHP.
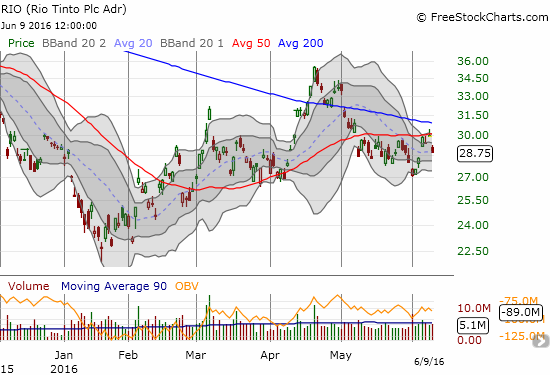
RIO did not lose as much as BHP. Its 3.9% loss did not come with out-sized selling volume. However, RIO is struggling to overcome 50DMA resistance. With the 200DMA now bearing down, RIO looks headed for a fresh sell-off. On the flip side, a breakout above the double resistance could be a lot more sustainable than the last one. So I REALLY like buying call options on RIO as part of the pairs trade with BHP as it sets up a combination with a lot of upside potential on either a fresh sell-off or a big breakout.
— – —
Reference Charts (click for view of last 6 months from Stockcharts.com):
S&P 500 or SPY
U.S. Dollar Index (U.S. dollar)
EEM (iShares MSCI Emerging Markets)
VIX (volatility index)
VXX (iPath S&P 500 VIX Short-Term Futures ETN)
EWG (iShares MSCI Germany Index Fund)
CAT (Caterpillar).
IBB (iShares Nasdaq Biotechnology).
Daily T2108 vs the S&P 500
")
Black line: T2108 (measured on the right); Green line: S&P 500 (for comparative purposes)
Red line: T2108 Overbought (70%); Blue line: T2108 Oversold (20%)
Weekly T2108

*All charts created using freestockcharts.com unless otherwise stated
The charts above are the my LATEST updates independent of the date of this given T2108 post. For my latest T2108 post click here.
Related links:
The T2108 Resource Page
Expanded daily chart of T2108 versus the S&P 500
Expanded weekly chart of T2108
Be careful out there!
Full disclosure: long XRT puts, long RIO calls, short BHP and long BHP calls and puts, long UVXY call options, long EEM call and put options