
(T2108 measures the percentage of stocks trading above their respective 40-day moving averages [DMAs]. It helps to identify extremes in market sentiment that are likely to reverse. To learn more about it, see my T2108 Resource Page. You can follow real-time T2108 commentary on twitter using the #T2108 hashtag. T2108-related trades and other trades are occasionally posted on twitter using the #120trade hashtag. T2107 measures the percentage of stocks trading above their respective 200DMAs)
T2108 Status: 73.4% (overbought)
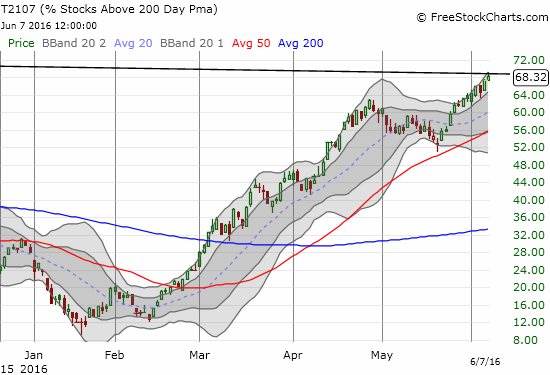
T2107 Status: 68.3%
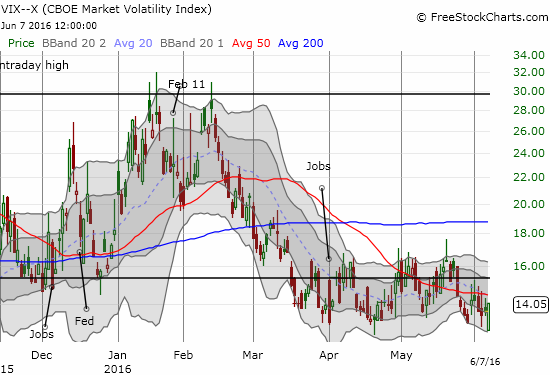
VIX Status: 14.1
General (Short-term) Trading Call: cautiously bullish
Active T2108 periods: Day #80 over 20%, Day #79 over 30%, Day #76 over 40%, Day #10 over 50%, Day #9 over 60%, Day #2 over 70% (overbought)
Commentary
The S&P 500 nudged higher with marginal gains thanks to a late day fade from the highs. The meager 0.1% gain on the day was of course unimpressive. Yet other indicators were a lot more encouraging. T2108, the percentage of stocks trading above their respective 40-day moving averages (DMAs), followed-through on the previous day’s punch into overbought territory with a close at 73.4%. This close near the highs of the day and a 2.48 percentage point gain delivered the convincing follow-through gain that the index did not. Even the NASDAQ underwhelmed with a 0.1% loss on the day.
The highlight of the day was T2107, the percentage of stocks trading above their respective 200DMAs. Like T2108, T2107 followed through on the previous day’s gain, but it did not deliver the big breakout from the post-recession downtrend that I am eager to see. The chart below is a close-up on the recent action with the downtrend line represented by the black line in the upper-right corner. T2107 closed right under that line after a small fade…
The volatility index, the VIX, made an interesting move by gapping down to 12.77 and then rallying for the rest of the day. The VIX is valiantly trying to hold the lows of the recent range. The failure of the VIX to proceed lower provides perfect tension against the market’s attempt to break out to a new all-time high.
Two big moves caught most of my attention on the day: housing and retail.
The iShares U.S. Home Construction ETF (ITB) popped 1.6% to easily out-perform the S&P 500 on the day. Despite a fade from the intraday high, ITB still managed to score a marginal 6-month high. This is the follow-through buying I was looking for to confirm that the ITB likely has more room to run past the expiration of the seasonal trade on home builders. I will be launching a fresh tranche of call options on ITB and getting back into Toll Brothers (TOL). TOL looks like it sells well under potential value.


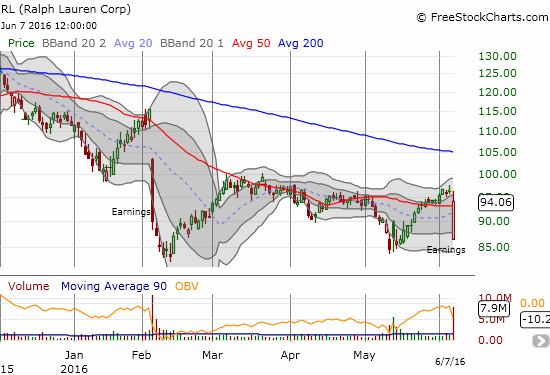
Ralph Lauren (RL) provided the other big move. The stock gapped down at the open for a 10.2% loss. Buyers took over from there with a bold move to completely close the gap! This move is another example of the eagerness of buyers to grab “bargains”; the move represents an underlying preference to buy over sell in the current market. Before I turned cautiously bullish on the market, I had targeted SPDR S&P Retail ETF (XRT) for a short given all the bad news from retailers this past earnings cycle. RL reminded me that sentiment may have already turned for the better in the sector.

— – —
Reference Charts (click for view of last 6 months from Stockcharts.com):
S&P 500 or SPY
U.S. Dollar Index (U.S. dollar)
EEM (iShares MSCI Emerging Markets)
VIX (volatility index)
VXX (iPath S&P 500 VIX Short-Term Futures ETN)
EWG (iShares MSCI Germany Index Fund)
CAT (Caterpillar).
IBB (iShares Nasdaq Biotechnology).
Daily T2108 vs the S&P 500
")
Black line: T2108 (measured on the right); Green line: S&P 500 (for comparative purposes)
Red line: T2108 Overbought (70%); Blue line: T2108 Oversold (20%)
Weekly T2108

*All charts created using freestockcharts.com unless otherwise stated
The charts above are the my LATEST updates independent of the date of this given T2108 post. For my latest T2108 post click here.
Related links:
The T2108 Resource Page
Expanded daily chart of T2108 versus the S&P 500
Expanded weekly chart of T2108
Be careful out there!
Full disclosure: long UVXY call options