(T2108 measures the percentage of stocks trading above their respective 40-day moving averages [DMAs]. It helps to identify extremes in market sentiment that are likely to reverse. To learn more about it, see my T2108 Resource Page. You can follow real-time T2108 commentary on twitter using the #T2108 hashtag. T2108-related trades and other trades are occasionally posted on twitter using the #120trade hashtag. T2107 measures the percentage of stocks trading above their respective 200DMAs)
T2108 Status: 65.3% (ends an epic 44-day overbought period!)
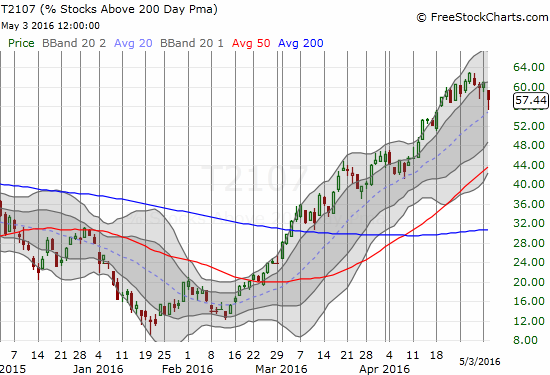
T2107 Status: 57.4%
VIX Status: 15.6
General (Short-term) Trading Call: cautiously bearish
Active T2108 periods: Day #56 over 20%, Day #55 over 30%, Day #52 over 40%, Day #49 over 50%, Day #45 over 60%, Day #1 under 70% (ends 44 days over 70% – overbought period)
Commentary
%stocks>40DMA has plunged to 62%. %stocks>200DMA testing uptrend. Bull technicals breaking down. But $SPY has 50DMA support #T2108 #T2107
— Dr. Duru (@DrDuru) May 3, 2016
In the last T2108 Update, I feared an imminent end to this extended overbought period. Today was the day. T2108, the percentage of stocks trading above their respective 40-day moving averages (DMAs), plunged soon after the open and buyers this time were unable to save the day. The close at 65.3% marks the end of a 44-day overbought period and marks the first time I have changed my trading call to bearish in a very long time. I included the “cautious” caveat since the S&P 500 still enjoys support from its 50DMA.
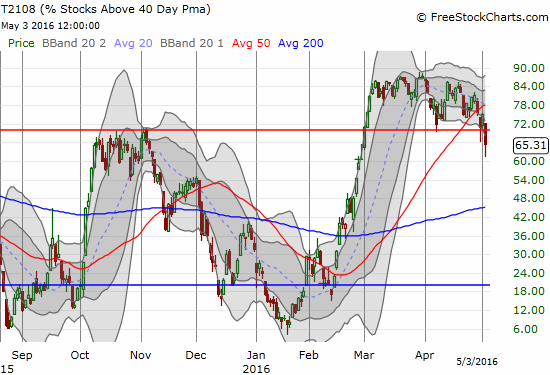
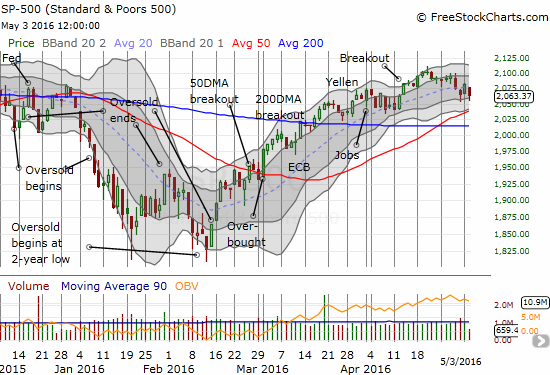
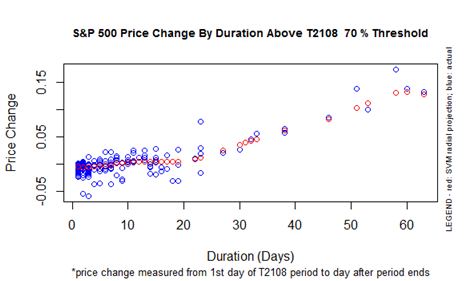
The S&P 500 (SPY) started the overbought period on March 1st. The overbought period ended with a 4.3% gain over that period. This is about half the expected performance based on the history of overbought periods since 1986 although there are few overbought periods that have lasted as long as this most recent one.
Adding to the bearish danger is T2107, the percentage of stocks trading above their respective 200DMAs. T2107 has broken off from its primary uptrend that has defined most of the bullish run of the last overbought period. Although the 20DMA uptrend remains intact for T2107, the break from the primary uptrend is more of a concern with T2108 ending the overbought period.
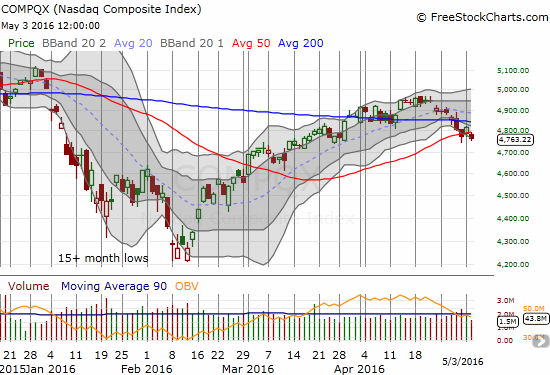
The NASDAQ (QQQ) has already entered bearish territory with a breakdown below its 200DMA support last Thursday, a 50DMA breakdown the next day, and what looks like a confirmation of that breakdown today. This was enough for me to load up on QQQ put options and follow my new bearish trading call.
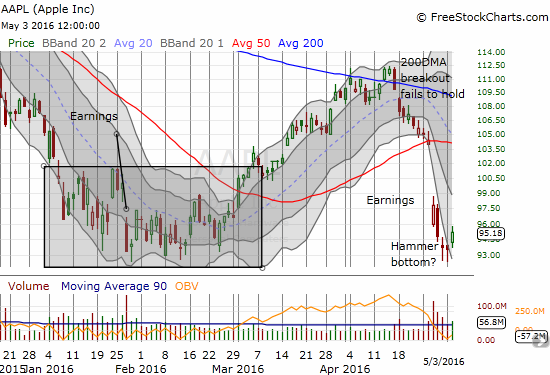
Ironically, the NASDAQ broke down just as Apple (AAPL) FINALLY experienced an up day after 8 straight days of losses. Suddenly, AAPL looks like it is bottoming given the previous two days featured hammer candlestick-like patterns. AAPL provides a sliver of hope for the NASDAQ to survive its growing breakdown.
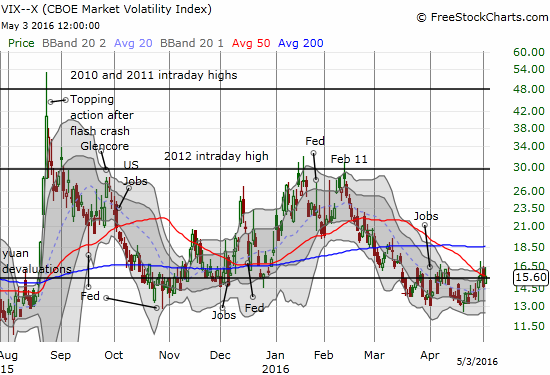
The volatility index, the VIX, actually could not hold its high of the day and settled close to the 15.35 pivot. It is hard to see the VIX taking off just yet. Still, I decided to load up on call options on ProShares Ultra VIX Short-Term Futures (UVXY) as part of my bearish trading call. I do not plan to add any more bearish T2108 trades until the bear call gets confirmed further. (Note that my trades in anticipation of a rally to start May’s trading – puts on UVXY and shares of roShares Short VIX Short-Term Futures (SVXY) – worked out just as I had hoped when I wrote about them in the last T2108 Update.)
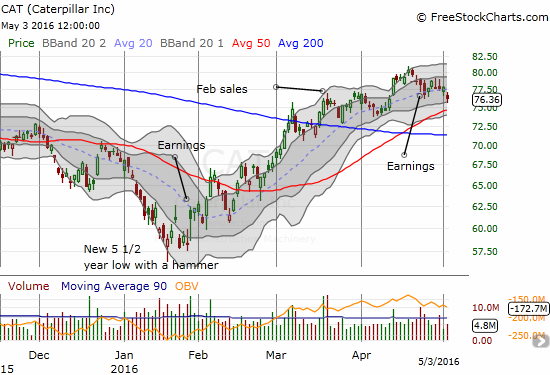
Caterpillar (CAT) has not confirmed a bearish turn in market sentiment. While CAT is still trading down from April earnings, the stock remains comfortably above 50DMA support.
As an example of a stock that has fallen from the ranks of contributors to T2107, I show the post-earnings chart of Mellanox Technologies, Ltd. (MLNX).
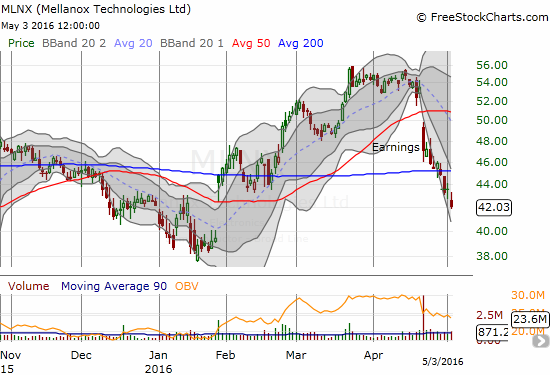
Another example is First Solar (FSLR). Fickle solar investors are losing patience again. FSLR cracked 200DMA support following April earnings and has sold off every day since.

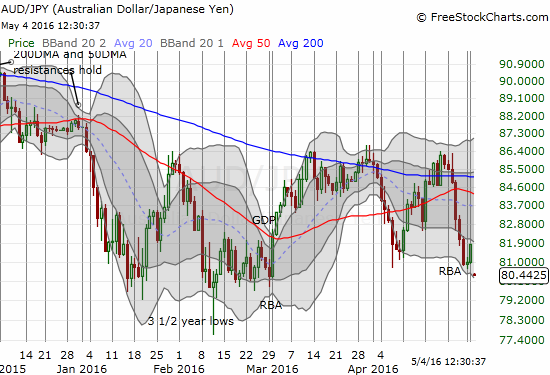
For those interested in currencies, I strongly recommend seeing my latest posts on the Australian dollar (FXA) and the Japanese yen (FXY). In both cases, I think the market is on the edge of big unwinds of exceptionally large net long positions. Since I look to AUD/JPY as a currency-based indicator of market sentiment, I am VERY interested in how these dynamics unfold. At the moment, the weakness of the Australian dollar is winning out over the weakness of the Japanese yen. AUD/JPY has broken the April low which confirms my bearishness.
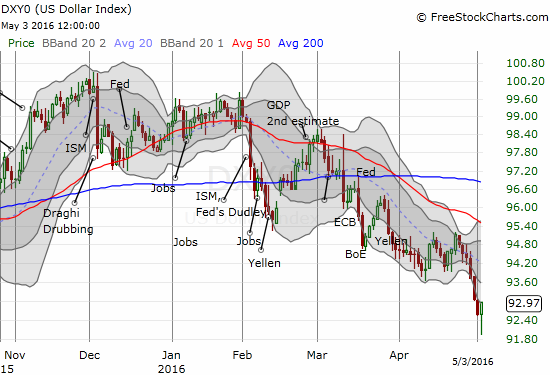
Another interesting development in foreign exchange is the potential blow-off bottom for the U.S. dollar index. Until now, conventional wisdom has insisted that the market needed dollar weakness to support earnings and stocks. Yet, the breakdown and acceleration of losses in the past 4 days has accompanied notable market weakness. The dollar was well below its lower-Bollinger Band (BB) when buyers finally stepped in to provide relief. This looks like a blow-off bottom to me. Needless to say, a new low should take the dollar a lot lower.
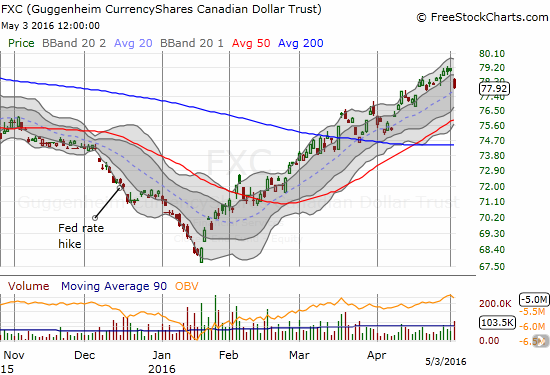
I took this moment as a signal to finally take profits on my position in CurrencyShares Canadian Dollar ETF (FXC). It was a great run that I wish I had timed a little better!
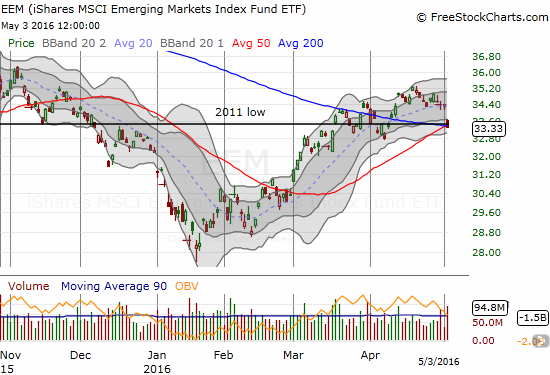
The accelerated weakness in the dollar has not even helped emerging markets. The iShares MSCI Emerging Markets ETF (EEM) gapped down into support at its 50 and 200DMA. My last trade of call options is essentially worthless now. Yet, at this critical juncture, I think it makes a lot of sense to get back to my more traditional play of out-of-the-money call and put options (an options strangle).
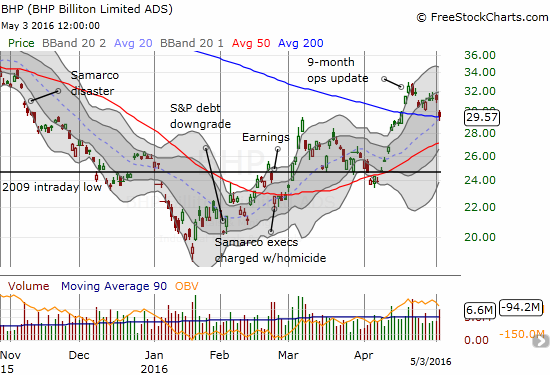
A rebound in the dollar could spell trouble for the great rally in commodities. Already, the iron ore plays have stumbled. BHP Billiton Limited (BHP) gapped down to its 200DMA support. I am still working the iron ore pairs trade here.
The biggest caveat on the looming bearish story is Friday’s U.S. jobs report. I cannot be clear on what scenario creates a bullish response from the market, but I am bracing for a big reaction either way given this imortant moment for the market. It IS the month of May after all…
— – —
For readers interested in reviewing my trading rules for an oversold T2108, please see my post in the wake of the August Angst, “How To Profit From An EPIC Oversold Period“, and/or review my T2108 Resource Page.
Reference Charts (click for view of last 6 months from Stockcharts.com):
S&P 500 or SPY
U.S. Dollar Index (U.S. dollar)
EEM (iShares MSCI Emerging Markets)
VIX (volatility index)
VXX (iPath S&P 500 VIX Short-Term Futures ETN)
EWG (iShares MSCI Germany Index Fund)
CAT (Caterpillar).
IBB (iShares Nasdaq Biotechnology).
(Reload page and/or click on the image, if it is not correct. At time of writing, server is having cache issues)
Daily T2108 vs the S&P 500

Black line: T2108 (measured on the right); Green line: S&P 500 (for comparative purposes)
Red line: T2108 Overbought (70%); Blue line: T2108 Oversold (20%)
Weekly T2108

*All charts created using freestockcharts.com unless otherwise stated
The charts above are the my LATEST updates independent of the date of this given T2108 post. For my latest T2108 post click here.
Related links:
The T2108 Resource Page
Expanded daily chart of T2108 versus the S&P 500
Expanded weekly chart of T2108
Be careful out there!
Full disclosure: long UVXY call options, long QQQ put options, short BHP, long BHP call options, short AUD/JPY, long EEM call options
