
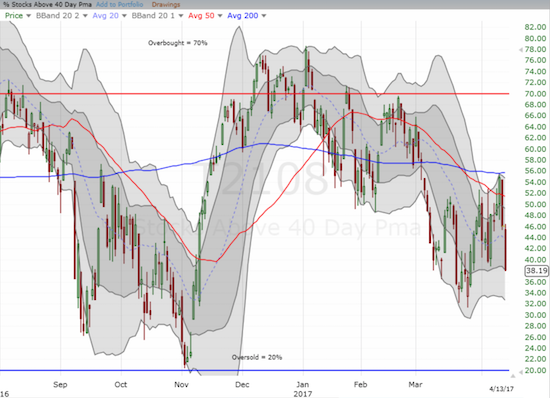
AT40 = 38.2% of stocks are trading above their respective 40-day moving averages (DMAs)
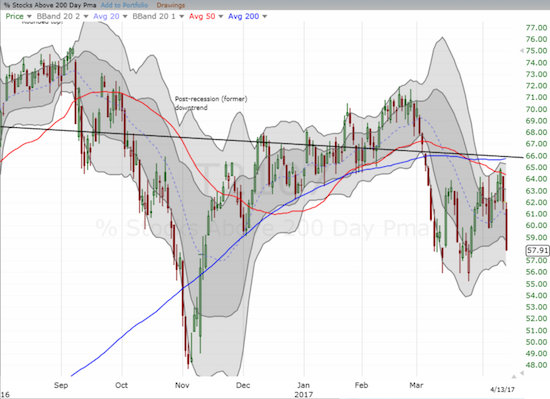
AT200 = 57.2% of stocks are trading above their respective 200DMAs
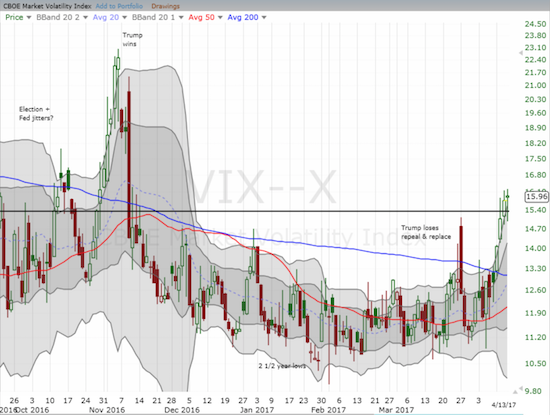
VIX = 16.0 (volatility index)
Short-term Trading Call: cautiously bullish (notable caveats explained below)
Commentary
The 50-day moving average (DMA) is no longer golden. It figures that on a day with the smallest gain in the volatility index, the VIX, during the current melt-up, the S&P 500 (SPY) experienced its ugliest close since the November U.S. Presidential election.
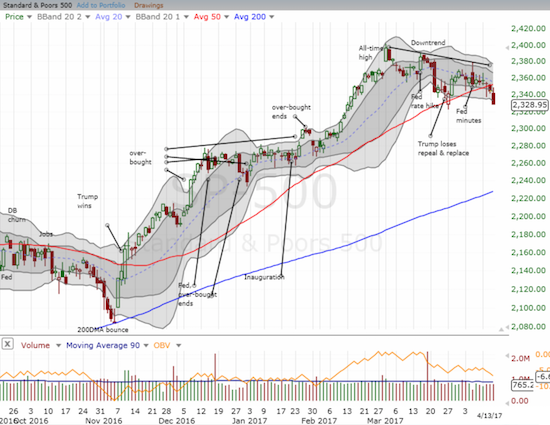
The previous day the S&P 500 (SPY) closed below its 50DMA for the first time since election day November 8, 2016. Thursday’s drop below the lower-Bollinger Band (BB) marked a 42-trading day low. The last time the index closed at a 42-trading day low was….you guessed…right before the U.S. Presidential election – November 4, 2016 to be exact. The S&P 500’s 50DMA breakdown confirmed the on-going downtrend from its all-time high and also confirmed the incrementally higher danger embedded in the market.
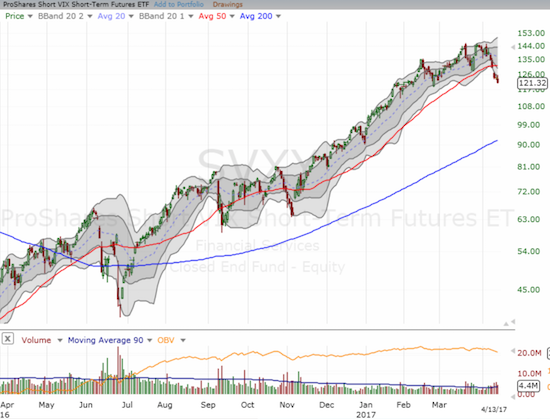
Despite the clear and present dangers, I watched the open of trading with optimism. The VIX had faded below the all-important 15.35 pivot, so I assumed a big VIX fade was on its way like so many other times before this. I even bought shares of ProShares Short VIX Short-Term Futures (SVXY) for a day-trade. I eventually stopped out at a loss.
If the S&P 500 closes below the intraday low from March 27th, I will be compelled to retreat from a cautiously bullish to a neutral trading call and, presumably, wait for AT40 (T2108) to flip to oversold trading conditions. AT40, the percentage of stocks trading above their respective 40DMAs, decisively ended a brief period of (uncomfortable) bullish divergence by collapsing over the last two trading days from 54.8% to 38.2%.
The rapid reversal in fortunes for AT40 was bad, but AT200 (T2107), the percentage of stocks trading above their respective 200DMAs, fared even worse. AT200 closed right around the recent closing lows. Like AT40, AT200 was rejected by its moving averages, yet AT200 confirmed fresh resistance at the former post-recession downtrend. AT200 seems in fresh danger of confirming this downtrend as active.
Given the bearish turn of events, I checked out some other key tells: the financials and the small caps.
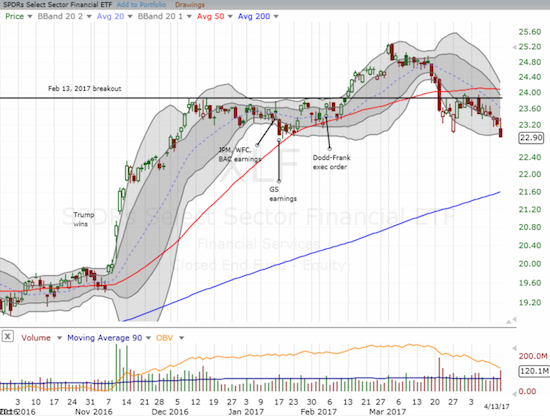
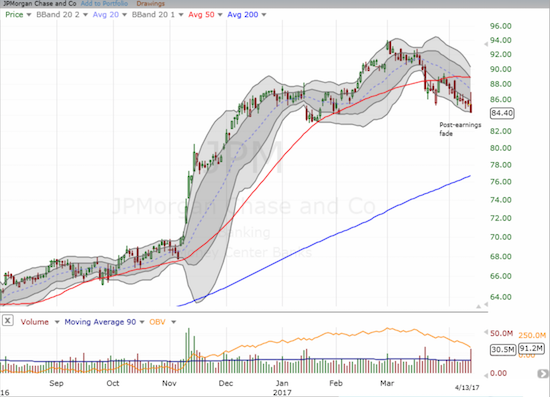
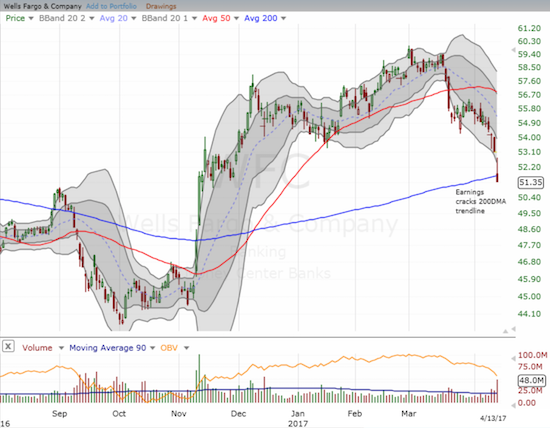
The Financial Select Sector SPDR ETF (XLF) lost 1.3% in the wake of important bank earnings from JP Morgan (JPM), Citigroup (C), and Wells Fargo (WFC). XLF has not traded this low since December 5, 2016 and is now down fractionally for the year. The financials have officially transitioned from front of the line to the anchor weighing the market down. I include charts of JPM and WFC to show examples of the technical damage done today in fiancials.
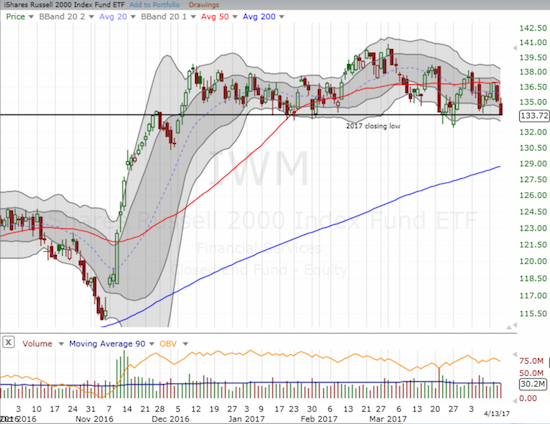
The iShares Russell 2000 (IWM) lost 1.0% and closed exactly at its 2017 low. Needless to say, another lower close will put a test of 200DMA support into play.
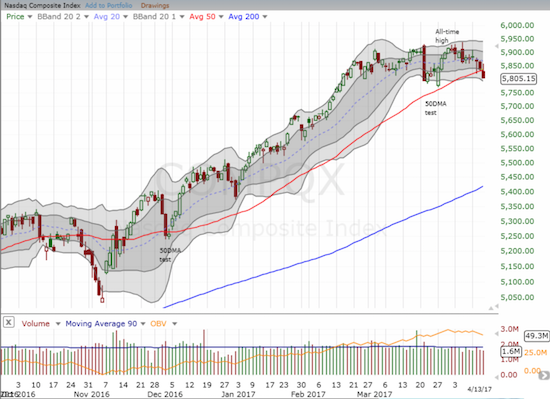
Tech is also suffering. The NASDAQ (QQQ) closed below its 50DMA for the first time since December 1, 2016. Pretty ironic to recall that at the time the fear was a President Trump was going to favor America’s industrial economy to the detriment of high-tech.
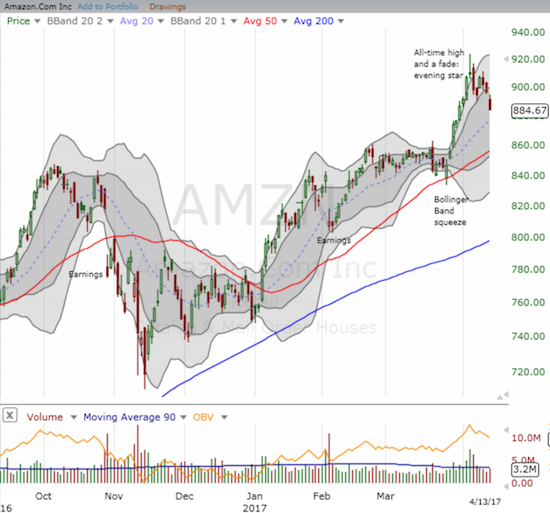
The most iconic member of the NASDAQ flagged its own warning a week ago with an evening star topping pattern confirmed with a bearish engulfing pattern. Sellers managed to quickly quash a 1-day attempt to reignite a rally. It was a rare show of force for this period in which bulls and buyers have consistently stymied the bears and sellers.
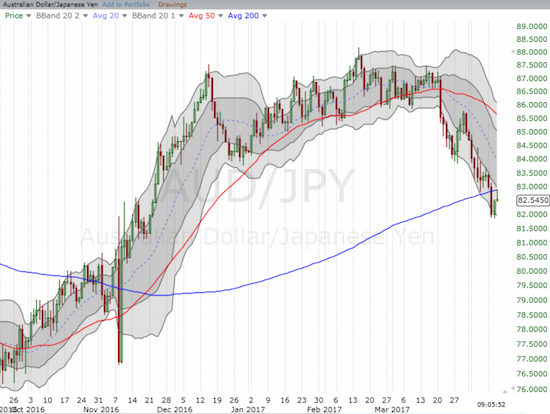
While the S&P 500 spent the last two days selling off, the Australian dollar (FXY) experienced a counter-trend jump partially thanks to a positive reaction to Australia’s latest jobs report. The jump in AUD/JPY could have provided a last vestige for bullish divergence. Unfortunately, AUD/JPY neatly faded from resistance at its 200DMA. This important currency pair now looks ready to reconfirm the on-going pressure facing the market.
Under the weight of all these bearish signals, I am very tempted to switch the trading call all the way back to bearish. However, I am reluctant to do so given AT40 is so low. So I will go to neutral if the pressure continues by breaking last month’s intraday low on the S&P 500.
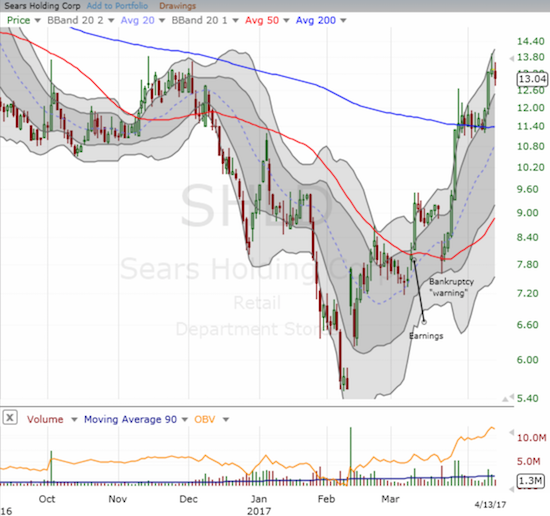
And then there are stocks like Chipotle Mexican Grill (CMG) and Sears Holding Corporation (SHLD) that give the eager bears whispering in my ears some pause. CMG broke out this week. Even Ackman is now in the green on this position. The extended chart below makes the breakout plain and reminds me of the overhead resistance that lies ahead. Sears is having a breakout of its own. This stock with a short interest consisting of a whopping 76.4% of its float has gained an equally whopping 63% since reporting earnings on March 9th. This period includes a bankruptcy “warning” on March 22nd that initially wiped out all of the stocks post-earnings gains at that time.
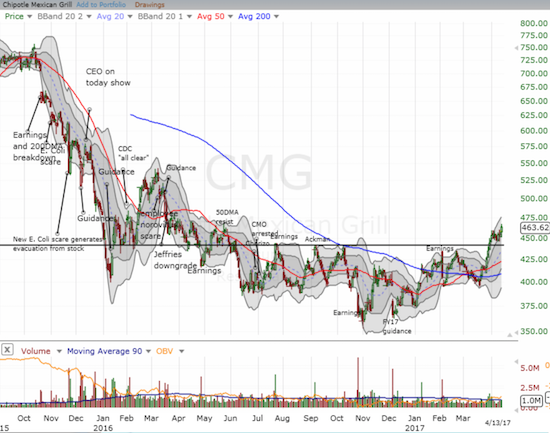
Speaking of short interest, CMG still has 18.2% of its float sold short. Tesla Motors (TSLA) hit all-time highs this week despite the weight of 38.3% of its float being sold short. Hmmm…
In trading action, I sold my call options in SPDR Gold Shares (GLD). If these calls were not expiring in a week, I would have definitely held onto them. I did not want to roll into a new position ahead of a three-day weekend. So I will look to buy back into call options on the first pullback. The increasingly bearish tone of the market has me carefully eyeing my remaining positions in home builders. As I noted earlier, a successful upgrade of Toll Brothers (TOL) stayed my hand from locking in profits…
— – —
FOLLOW Dr. Duru’s commentary on financial markets via email, StockTwits, Twitter, and even Instagram!
“Above the 40” uses the percentage of stocks trading above their respective 40-day moving averages (DMAs) to assess the technical health of the stock market and to identify extremes in market sentiment that are likely to reverse. Abbreviated as AT40, Above the 40 is an alternative label for “T2108” which was created by Worden. Learn more about T2108 on my T2108 Resource Page. AT200, or T2107, measures the percentage of stocks trading above their respective 200DMAs.
Active AT40 (T2108) periods: Day #290 over 20%, Day #110 over 30% (overperiod), Day #1 under 40% (underperiod, ending 5 days above 40%), Day #3 under 50%, Day #31 under 60%, Day #62 under 70%
Daily AT40 (T2108)
")
Black line: AT40 (T2108) (% measured on the right)
Red line: Overbought threshold (70%); Blue line: Oversold threshold (20%)
Weekly AT40 (T2108)

*All charts created using freestockcharts.com unless otherwise stated
The charts above are my LATEST updates independent of the date of this given AT40 post. For my latest AT40 post click here.
Related links:
The T2108 Resource Page
You can follow real-time T2108 commentary on twitter using the #T2108 or #AT40 hashtags. T2108-related trades and other trades are occasionally posted on twitter using the #120trade hashtag.
Be careful out there!
Full disclosure: long GLD shares and call options, long SSO shares and call options, long TSLA put and call spread, short the Australian dollar