
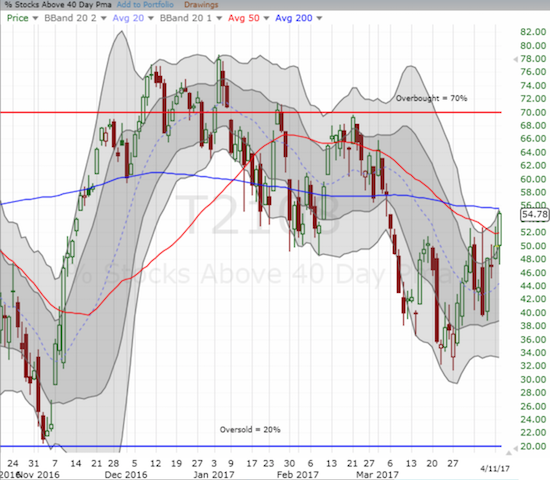
AT40 = 54.8% of stocks are trading above their respective 40-day moving averages (DMAs)
AT200 = 64.8% of stocks are trading above their respective 200DMAs
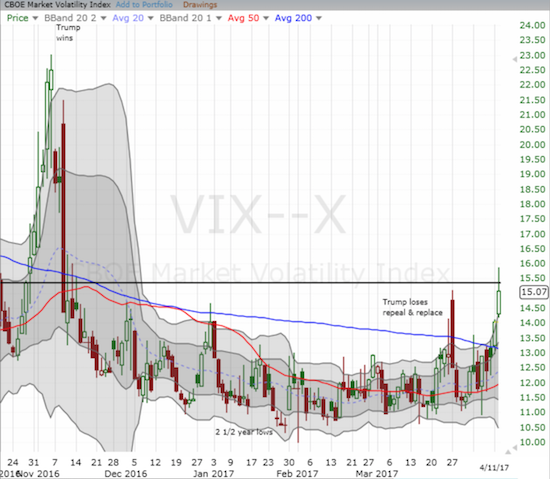
VIX = 15.1 (volatility index)
Short-term Trading Call: cautiously bullish (notable caveats explained below)
Commentary
The stock market has become incrementally more dangerous, yet buyers and bulls continue to succeed in bottling up the headwinds and in frustrating the sellers and bears.
The 50-day moving average (DMA) was once again golden as the S&P 500 (SPY) fought off early weakness to bounce right back over this critical line of uptrending support. You just can’t make up these technical patterns!
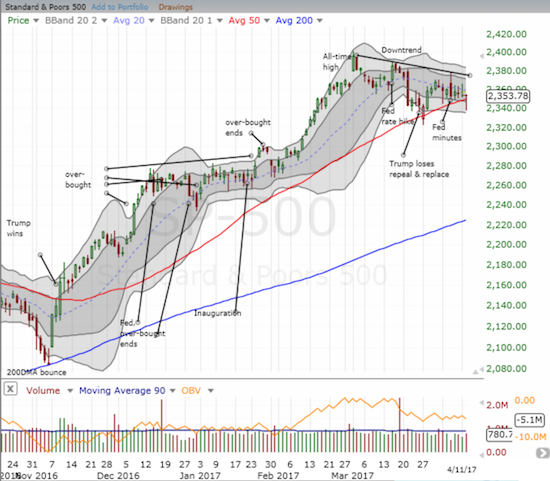
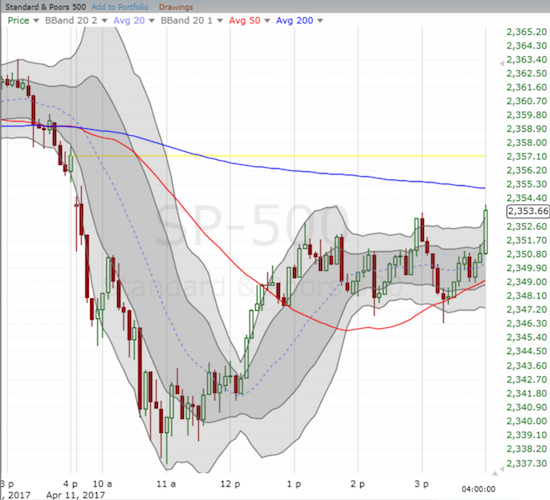
The S&P 500 has closed above its 50DMA every day since Donald J. Trump was elected President. The two breaks of this uptrending support over the past three weeks are the only real tests of this uptrend. The uptrend was so strong that the 20DMA played tour guide until mid-March. So, the struggle here is exceptionally important from a technical standpoint. As long as the sellers lack the will and the firepower to seize opportunities of weakness like today, my trading call sticks to (cautiously bullish).
Interestingly, AT40 (T2108), the percentage of stocks trading above their 40-day moving averages, has displayed the market’s underlying bid in recent days. Even as the S&P 500 just barely recovered from a 50DMA breakdown, AT40 comfortably closed at a one-month high. In fact, as the S&P 500 has struggled to go anywhere (up or down measured from the close) over the past four days since it sold off post-Fed minutes, AT40 has delivered notable gains three out of these four days. This is about as bullish a divergence as I have seen in a long time. (Is the market trying to anticipate the sudden eruption of world peace?)
This persistent bullish divergence would normally have me rushing out to get aggressively bullish on the S&P 500 and its 50DMA support. Instead, the volatility index, the VIX, and the currency market, the Japanese yen in particular, are making me increasingly uncomfortable with this bullish divergence.
The VIX should be melting in the shadow of a rising AT40. Instead, the VIX has pressed higher for most of April. In my last few “Above the 40 posts”, I have called out the rising pressure on the VIX. Today, the VIX jumped so high that it hit the all-important 15.35 pivot. Even after fading, the VIX closed at a new post-election high. The last time the VIX closed higher was on the day of the election (I seem to be making such comparisons a LOT lately!).
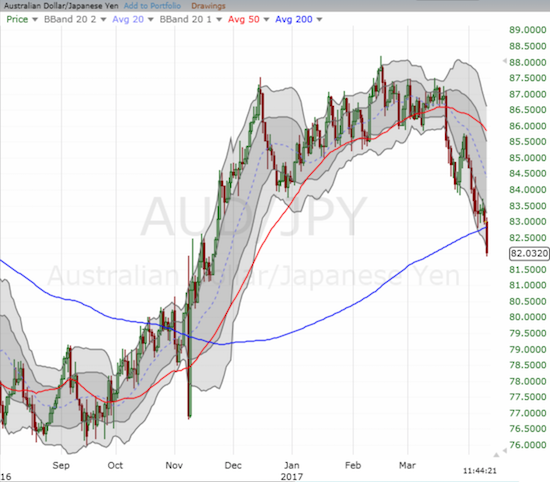
Even this rising VIX would not normally deter me from an aggressively bullish interpretation of AT40’s divergence from the S&P 500. Indeed, I would actively fade the VIX with put options on ProShares Ultra VIX Short-Term Futures (UVXY). Instead, today I applied profits from a call option to buy shorter-term call options paired with longer-range puts. My eye on the currency market solidified my discomfort and delivered the deal breaker on aggressive bullishness. The Australian dollar (FXA) versus the Japanese yen (FXY) finally broke down below its 200DMA. That signal alone raises all sorts of fresh red flags as the Japanese yen gains against all major currencies.
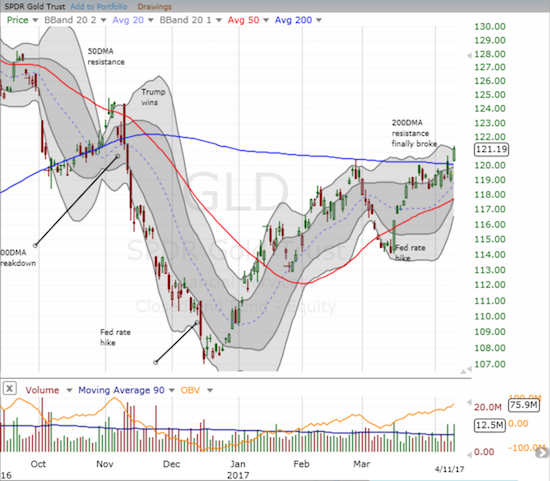
Finally, nothing flags change is afoot like a breakout for gold. The SPDR Gold Shares (GLD) cleanly broke out above its 200DMA resistance after three failed attempts in recent weeks. With the Bollinger Bands (BBs) closing in for a squeeze, this breakout becomes exceptionally bullish. Moreover, this close is GLD’s second highest since Trump’s election.
Trading Implications
This mix of important trading signals complicates my strategizing. First off, I have purposely reduced my bullish positions and greatly shortened the time I am willing to hold onto more speculative trades. In my last post or two I discussed abstaining from new bullish positions if the S&P 500 closed below its 50DMA. Given the current backdrop, I think today’s close call was “close enough” to a breakdown to convince me to trigger the abstention and look to focus on managing current positions.
Today’s trades were a microcosm of the juggling acts I am attempting to manage with the market doing its best to ignore the geopolitical risks looming in the background. With the S&P 500 trading below its 50DMA, I went to Caterpillar (CAT) and doubled down on put options as a hedge against bullishness. Right after that move, I noticed that AT40 was not confirming the selling in the market…
mar
Surprising (bullish?) divergence: % of stocks above 40DMAs gaining, yet to show stress from #VIX. #AT40 #T2108 $SPY pic.twitter.com/63tjGMh3Gn
— Dr. Duru (@DrDuru) April 11, 2017
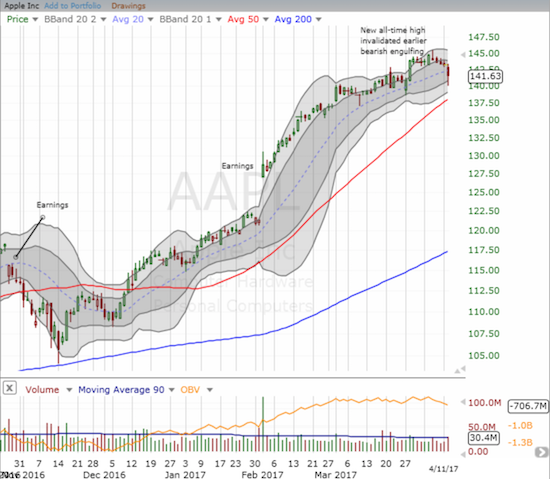
At that moment I figured the market could easily snap back. Yet, I remained reluctant to get aggressively bullish. So I looked through some big cap market darlings and found Apple (AAPL) tagging its first lower-Bollinger Band (BB). I flipped the call options as soon as AAPL hit its 20DMA.
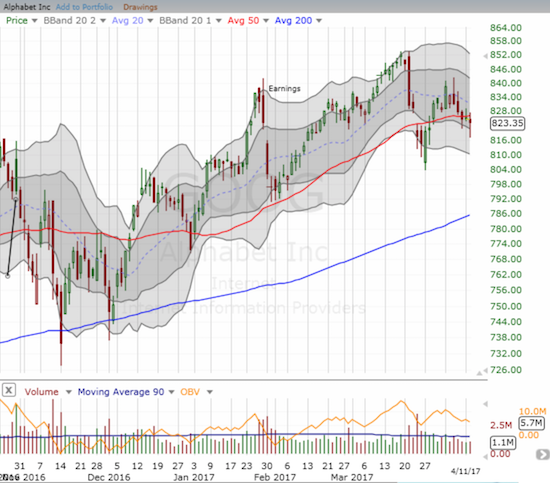
I could not let AAPL ride solo. So I married it with a put option on Alphabet (GOOG). GOOG looks like it is topping out. The stock made a valiant effort to get over the YouTube advertising ructions, but another break below the 50DMA made the stock look vulnerable all over again. I doubled down on my put at the close and think the position is a great tech-related hedge to bullishness.
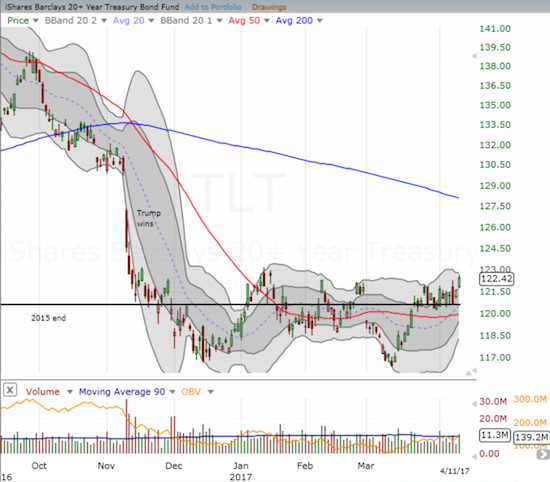
While enjoying the gains in my gold positions, I am now watching the clock ticking away on my call options the SPDR Gold Shares (GLD). The position is a remnant from my gold versus bonds pairs trade, so I should be content to let the call options ride out. Yet, visions of sellers and bears folding played in my head and motivated me to restart the pairs trade with put options on the iShares 20+ Year Treasury Bond ETF (TLT) expiring in May.
In summary, I am not willing to heavily commit on either side of the ledger, bull or bear, even as AT40 keeps me on the side of the cautious bulls. I want to make sure I have positions in place to take advantage of the next big move.
— – —
FOLLOW Dr. Duru’s commentary on financial markets via email, StockTwits, Twitter, and even Instagram!
“Above the 40” uses the percentage of stocks trading above their respective 40-day moving averages (DMAs) to assess the technical health of the stock market and to identify extremes in market sentiment that are likely to reverse. Abbreviated as AT40, Above the 40 is an alternative label for “T2108” which was created by Worden. Learn more about T2108 on my T2108 Resource Page. AT200, or T2107, measures the percentage of stocks trading above their respective 200DMAs.
Active AT40 (T2108) periods: Day #288 over 20%, Day #108 over 30%, Day #4 over 40%, Day #1 over 50% (overperiod ending 16 days under 50%), Day #29 under 60%, Day #60 under 70%
Daily AT40 (T2108)
")
Black line: AT40 (T2108) (% measured on the right)
Red line: Overbought threshold (70%); Blue line: Oversold threshold (20%)
Weekly AT40 (T2108)

*All charts created using freestockcharts.com unless otherwise stated
The charts above are my LATEST updates independent of the date of this given AT40 post. For my latest AT40 post click here.
Related links:
The T2108 Resource Page
You can follow real-time T2108 commentary on twitter using the #T2108 or #AT40 hashtags. T2108-related trades and other trades are occasionally posted on twitter using the #120trade hashtag.
Be careful out there!
Full disclosure: long GLD shares and call options, long SSO shares and call options, long GOOG put options, long TLT put options, long UVXY call and put options