
(T2108 measures the percentage of stocks trading above their respective 40-day moving averages [DMAs]. It helps to identify extremes in market sentiment that are likely to reverse. To learn more about it, see my T2108 Resource Page. You can follow real-time T2108 commentary on twitter using the #T2108 hashtag. T2108-related trades and other trades are sometimes posted on twitter using the #120trade hashtag. T2107 measures the percentage of stocks trading above their respective 200DMAs)
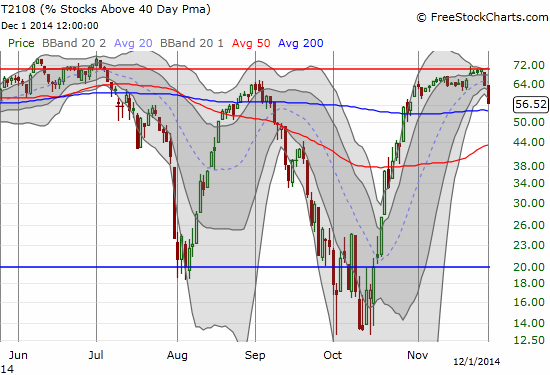
T2108 Status: 56.5% (2-day decline of 20% qualifies for quasi-oversold status)
T2107 Status: 49.4%
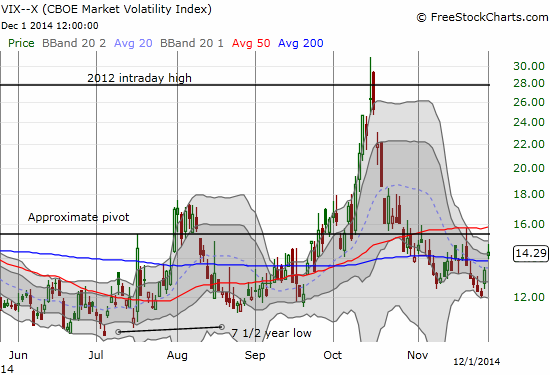
VIX Status: 14.3
General (Short-term) Trading Call: Hold bullish positions but start taking profits if S&P 500 selling follows through. Aggressive bears can start shorting with stops at new all-time highs
Active T2108 periods: Day #30 over 20%, Day #28 over 30%, Day #25 over 40%, Day #23 over 50%, Day #1 under 60% (the underperiod ends 17 days over 60%), Day #100 under 70%
Reference Charts (click for view of last 6 months from Stockcharts.com):
S&P 500 or SPY
SDS (ProShares UltraShort S&P500)
U.S. Dollar Index (volatility index)
EEM (iShares MSCI Emerging Markets)
VIX (volatility index)
VXX (iPath S&P 500 VIX Short-Term Futures ETN)
EWG (iShares MSCI Germany Index Fund)
CAT (Caterpillar).
Commentary
My favorite technical indicator, T2108, never did quite hit overbought status, but I declared it “close enough.” On “Black Friday”, T2108 beat a definitive retreat from the overbought threshold to flash a bearish signal even clearer than September’s retreat. Today’s downward extension for T2108 confirms a bearish topping pattern even as the 20% 2-day decline creates a quasi-oversold condition. The T2108 Trading Model (TTM) produces 62% odds of another drop on Tuesday. However, the classification error is 51% which renders the prediction effectively useless. I am not surprised since the model is much better at projecting upside than downside, especially from lofty levels like these.
The S&P 500 (SPY) declined 0.68%. It was a fractional loss, but the selling volume pushed the index into a close of the gap created by the surprise rate cut from China on November 21, 2014.
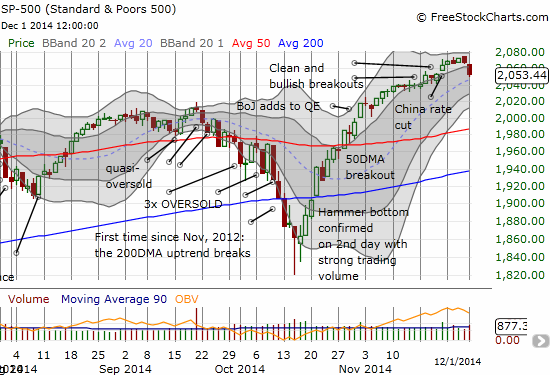
According to the overbought trading rules I set out, I still need follow-through selling from here to confirm the end of the gap up before I can get fully bearish. Even with such confirmation, I will be VERY reluctant to get aggressively bearish. I WILL reluctantly retreat on my very bullish plan to hold my ProShares Ultra S&P500 (SSO) shares into next Spring. They were hard-earned after two purchases during October’s oversold periods; I like to consider them on-going reminders of the power and potential of the T2108 trading methodology.
Aggressive bears can feel freer to short here with tight stops at new all-time highs on the S&P 500. Bears note well that THIS is the kind of scenario where I think it finally makes sense to try to predict a top. I have been constantly startled at the willingness of bears I see on social media (twitter and stocktwits) to just short the market at what seem like almost random spots just because of a feeling that the market is “over-valued” or fundamentals look “awful” – all the while ignoring the steamroller that is the current upward trend. Anyway, bears have at it. I cannot quite join you though!
Instead of looking for fresh shorts today, I speculated on some call options on stocks like Amazon.com (AMZN) and Baidu (BIDU) in case the market rebounds sharply by the end of the week. I also closed out some hedges including the put option side of the strangle set-up on iShares MSCI Emerging Markets (EEM). I discussed this trade when EEM broke out in response to the Chinese rate cut. Just as I noted then, the options were not properly priced for what I saw as high odds of a big move up or down (my bias was for a continuation of the bullish move). The puts tripled in price today and almost paid for my call options. That was good enough for me to close them out. Granted, at the current pace and setup, I highly doubt EEM will turn-around enough by January to put me in the black.
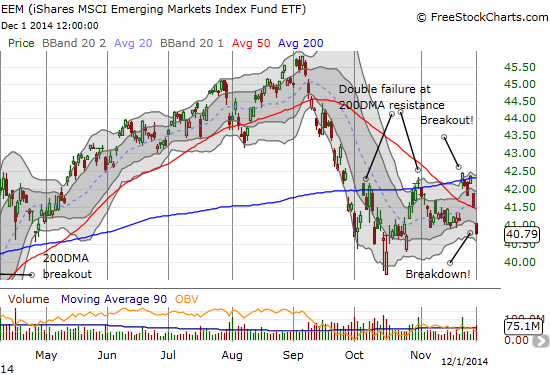
This rapid move from breakout to breakdown for EEM is VERY bearish. Adding to the bearish look of the market is one of my favorite bulldozers in the coal mine: Caterpillar (CAT). CAT already plunged last Friday to provide a clear and early warning signal. Today’s breakdown below the 50DMA and the psychologically important $100 level confirm the bearish warning sign from CAT.
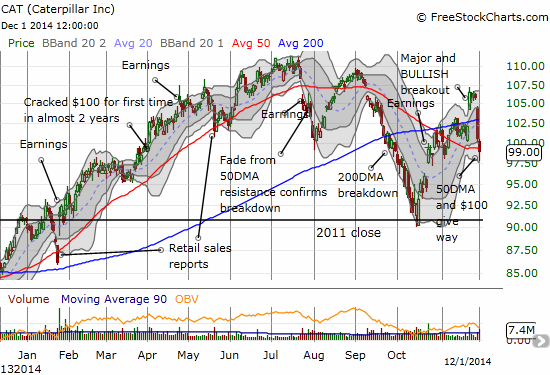
My put spread on CAT is now solidly profitable. Since it does not expire until January, I am in no hurry to close it out. I will be better served letting the position ride as a hedge as long as I can given the bearish breakdown.
Given what I see as clearly bearish signals, I am surprised that the volatility index, the VIX, “only” rose 7.2%. Still, I used the pop to move back into put options on the ever-declining ProShares Ultra VIX Short-Term Futures (UVXY). This trade is a good substitute for reflexively going for ProShares Ultra S&P500 (SSO) call options. The UVXY put options are VERY expensive, so it seems the market is still expecting high odds of an eventual reversal of volatility sooner than later. I will likely need the sooner in order to make a profit commensurate with the risk.
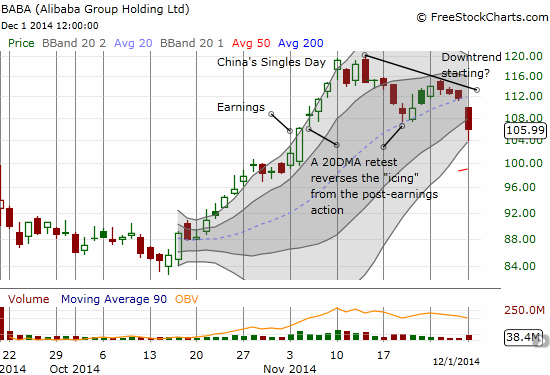
My trade in Alibaba Group Holding Limited (BABA) ended today as I stopped out of the position. I described the setup last week. It triggered the very next day. I was tempted to take my profits and run 2 days later. Instead, I tried to let the trade run. You win some, you lose some. NOW, BABA is looking more precarious as a definitive downtrend is developing from the all-time peak. Coincidentally, the 50DMA is developing right around $100. I fully expect a test of those levels. Such a test will also perfectly reverse all the post-earnings gains – making it a great spot to try another buy.
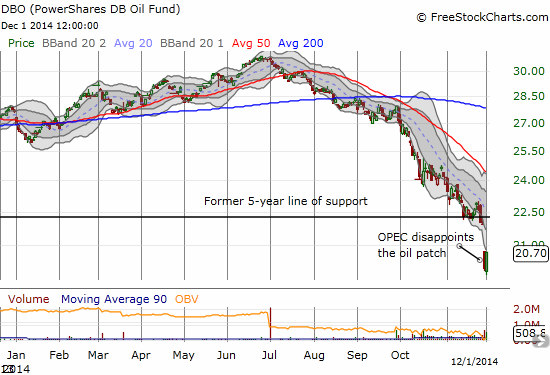
The energy complex found a SMALL modicum of relief as oil jumped off its multi-year lows. Note how PowerShares DB Oil ETF (DBO) bounced from oversold conditions over-extended below its lower-Bollinger Band. I wish I had been alert enough last Friday when I set up my arbitraged oil play to buy DBO outright.
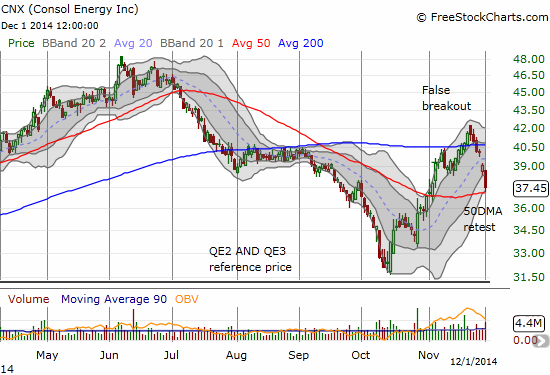
It seemed nothing else in the oil patch or energy complex in general benefited from oil’s bounce. I made an attempt last week to play the breakout on CONSOL Energy Inc. (CNX). That trade is now going up in flames unless the 50DMA manages to hold better than the 200DMA.
Finally, Apple (AAPL) produced the most alarming move of the day. I went into the day with a typical bullish Monday on my mind according to the Apple Trading Model (ATM). So when AAPL instead pulled back, I happily started buying call options as my favorite ATM play is to get a discounted purchase on the eventual direction of the stock. As AAPL continues to weaken, I set up a limit order for a second tranche of call options. Soon after that, the “flash dip” occurred. It executed my trade AND put it into the green within minutes.
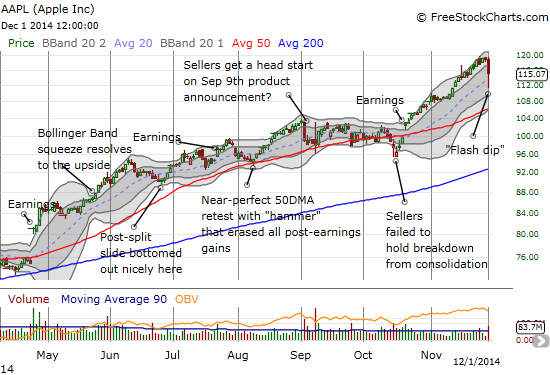
Needless to say, my position eventually faded back into the red as AAPL failed to regain much more momentum. There are undoubtedly some freshly nervous holders of AAPL stock thinking back to the May, 2010 flash crash. The good news is that the entire stock market quickly recovered from that episode. I am expecting the same from AAPL.
On the way there though the ATM is projecting very mixed odds for Tuesday’s performance. It is VERY definitive on AAPL fading from its Tuesday open with around 86% odds. The classification errors on all ATM projections are at reasonable levels: all under 30%. If AAPL starts to retreat, I am likely to buy puts into the swoon. Stay tuned.
Overall, the cautionary tale here is that some kind of top is likely in the market now. I highly doubt it is THE top, but it should be a meaningful one. Since I am still in the bullish camp, my expectation is that this topping pattern will lead us into a chopping pattern that will drive bears and bulls nuts. The lesson from AAPL and so many tech stocks that got creamed today is that no one should rest easy going into what is supposed to be a seasonally strong period for stocks.
Daily T2108 vs the S&P 500
")
Black line: T2108 (measured on the right); Green line: S&P 500 (for comparative purposes)
Red line: T2108 Overbought (70%); Blue line: T2108 Oversold (20%)
Weekly T2108

*All charts created using freestockcharts.com unless otherwise stated
The T2108 Resource Page
Expanded daily chart of T2108 versus the S&P 500
Expanded weekly chart of T2108
Be careful out there!
Full disclosure: long SSO shares; long UVXY puts; long put spread on CAT; long call options on AAPL, AMZN, BIDU, CNX, and EEM.