
The Apple Trading Model (ATM) has become one of my favorite trading tools. I am writing this post to serve as a clear and comprehensive reference point when I write about it in future posts. Interested traders should bookmark this page. (As of writing, my last major AAPL post was another sentiment analysis that ended up anticipating a dip ahead of Apple’s September 9th product announcement).
History
I first thought about an AAPL-related trading model when I realized that AAPL tended to trade higher on Mondays and lower on Fridays. In August, 2012, I wrote “A Guide For Day-To-Day Trading In Apple’s Stock” which laid out my first case showing the surprising regularity in Apple’s day-to-day trading. Almost a year later, I wrote “ATM: The Apple Trading Model Formalized” to apply more systematic machine learning techniques to the analysis. The results produced even more confirmation that AAPL exhibits enough regularities in its trading to make trading worthwhile under certain conditions. The ability to update the model with fresh data represents one of the most powerful features of this approach. The past is a good guide, but it does not guarantee the future.
Since the original formulation, I have made several enhancements to the model as well as refined rules of execution.
The Approach
In machine learning terms, I am using regression (or classification) trees and Bayesian modeling. (For further information on regression trees, see Wikipedia for starters. Ditto for Bayesian classifiers.) The regression trees form the core of the model. I use the e1071 package in R with optimal tuning and 10-fold cross-validation for regression trees. I use the same package for naiveBayes modeling. I only use the Bayesian model as a kind of tie-breaker if the regression trees are producing conflicting and/or inconclusive results, AND I have determined a very good risk/reward trade seems possible. Probably about ninety-percent of the time, I trade just based on the regression tree results. So, I am simplifying the rest of this discussion by focusing on the regression trees.
The ATM model classifies based on whether Apple’s stock closes on a particular day up (1) or down (0). I do not derive any relationship to explain the magnitude of AAPL’s change on the day. Such a model would of course be a lot more powerful, but I have yet to derive one that produces acceptable error rates. I compensate for the binary classification by using options: options can make a good amount of money on small changes and losses are automatically capped. Options are also appropriate since the trading decisions are short-term (daily).
I keep the model simple by using a small set of factors: the day of the week, the month of the year, the previous day’s change in value for the S&P 500, the previous day’s change in price for AAPL measured from that day’s open, the previous day’s change in price for AAPL measured from the previous close, and the number of days AAPL has closed up over the last 5 days (a short-term trending factor). Note that the assumption of independence across all these factors is a strong one, making the Bayesian model inconsistent (aka perplexing!) in its behavior at times.
For data, I use daily data starting from 2010. This choice is based on the assumption that the most recent data matters the most for short-term trading. The years of 2008 and 2009 were so unique to the history of trading, I prefer to exclude them from models that look for regular patterns. I use daily data for both Apple and the S&P 500. The S&P 500 provides the general market context. I do not use the NASDAQ because it is more representative of a single sector of the market (high-tech). You can download the latest historical data by clicking this link.
Model setup
Here are the independent variables (or factors) used in the Apple Trading Model. You must understand these to read the model output:
- DayOfWeek: Day of the week – 2 to 6 is Monday to Friday.
- MonthOfYear: Month of the year – 1 to 12 is January to December.
- SP500PrevDailyChg: Previous day’s performance for the S&P 500 (SPY) (daily percentage change). “Previous” means the trading day prior to the day being classified (projected).
- AAPLPrevIntraDayChg: Previous day’s performance for AAPL (daily percentage change) measured from the OPEN of the day.
- AAPLPrevDailyChg: Previous day’s performance for AAPL (daily percentage change) measured from the CLOSE of the prior day.
- AAPLPrev5Days: Number of days AAPL closed up out of the last five trading days – a measurement of short-term trending.
Execution
I run the ATM for a set of years starting with the first year of historical data (2010). As of 2014, this means four passes: history based on data from 2010 to 2014, 2011 to 2014, 2012 to 2014, 2013 to 2014, and just 2014. I run these sets twice for a total of 8 runs: four for the classification for AAPL’s expected close measured from the previous day’s close – I call these the “Closing Sub-Models”; four for the classification for AAPL’s expected close measured from the trading day’s open – I call these the “Opening Sub-Models”. The trading day is the future day targeted for a trade.
This breakdown allows me to detect changes in AAPL’s trading behavior over time. It also allows me an opportunity to check whether I should trust the conclusions based on the latest year of trading. I compare and contrast each sub-model’s classification error as well as the historical frequency for the given trading scenario. I trust most the sub-model using the current and previous year’s data. Of course, I prefer to see the sub-models agree as much as possible with each other. I dial up or dial down my trading aggressiveness based on the degree of agreement across the sub-models.
So far, so good on classification errors: I am OK with anything below 35% or so. As of Friday, September 5, 2014, here are the classification errors listed by starting year of the sub-model. The first number is the classification error for the Closing Sub-Model, and the second number is the classification error for the Opening Sub-Model.
2010
0.2486393
0.2273215
2011
0.2482028
0.2217553
2012
0.2663185
0.2375038
2013
0.2745552
0.2471611
2014
0.3192823
0.2650851
In my opinion, the classification errors are remarkably good across the board. Granted, I am surprised that the 2014 Closing Sub-Model has the highest classification error now. These results mean all the sub-models are quite useful and functional – a very good, even if surprising, outcome!
Here are links to the charts of the regression trees listed by the first year of historical data used in the model. These trees define the decision rules for making a trade for a given day. The terminal nodes provide the historical frequency of the given scenario described by the path to that node. Following a condition to the left represents “TRUE.” Following a condition to the right represents “FALSE.” Again, use the key provided above to understand the labeling. I update these charts on a periodic basis.
Trade from the previous close – Closing Sub-Models
2010
2011
2012
2013
2014
Trade from the open (intraday) – Opening Sub-Models
2010
2011
2012
2013
2014
As I stated earlier, I strongly prefer to use options for trades using the ATM. I have tinkered with trying to anticipate the outcome of the model and/or run the model based on anticipated closes with mixed results. I now only do such anticipation for Monday and Friday trades. One benefit of frequent model updates is that I am currently reviewing how Friday trades have increasingly become less certain. It is almost as if traders are finally trying to anticipate Monday’s gains by buying into Friday. This of course reduces the potential upside for Monday. Over time, new patterns develop as traders increasingly anticipate old patterns.
I have come to prefer running the model after the close and then looking for an ideal entry the next day. This allows me to opt out of trading if conditions are not right. For example, if the model predicts an up day, and AAPL gaps up or races up to a 1% gain at the open, I will abstain from trading. The risk/reward becomes very poor under such conditions. If on the other hand the model predicts a down day, I might open up a trade to fade, especially if BOTH the Opening and Closing sub-models agree on a down close. In this case, the model may still end up wrong, but I have a chance of catching a fade as AAPL fails to sustain the early gains. Given AAPL has been in a bullish phase since its bottom last year, I have a great preference for buying dips on AAPL in anticipation of upside the following day (in the case of a Friday dip) or by the close.
These are the basic contours of the ATM model. If you have questions or feedback, feel free to post them below. I will definitely get back to your post as soon as possible. Also stay on the look-out for future enhancements. I plan to do a year-end review for overall performance metrics and to analyze what is working and what needs improvement.
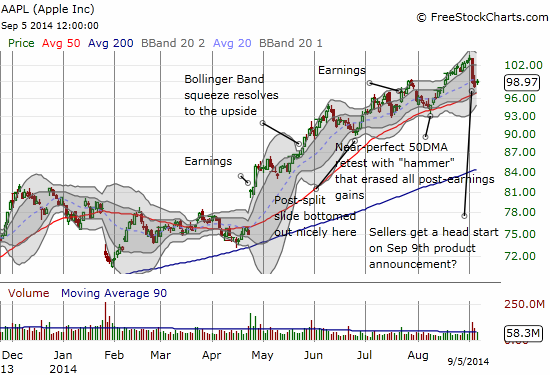
Source: FreeStockCharts.com
Be careful out there!
Full disclosure: long AAPL call options