

The Market Breadth Summary
|
Stock Market Commentary
Market rotation was a strong theme last week. Small caps did great. Consumer staples (defensives), materials, and industrials each received significant buying interest as pressure further intensified in software stocks and tech stocks in general wavered with tepid and timid buying interest. This rotation is good because market breadth expanded, but the moves are also bad because a lot of money is committed to the weakening sectors. If the money continues flowing into the smaller parts of the market, then wealth is getting spread around. However, the market breadth fade from the overbought trading threshold delivered a fresh warning of potential bearish trading conditions around the corner.
The stock market indices reveal almost none of the trouble underneath.
Still, overall, the stock market performed surprisingly well given the week started with the news that the Department of Justice is pursuing criminal charges against Federal Reserve Chair Jerome Powell over his testimony to Congress about cost overruns in the renovation work at the Federal Reserve’s building. Powell finally fired back directly at the President in a recorded response. I guess the potential of doing jail finally forced him to address the contention head-on. The historic acrimony between the President and Powell reached new heights of intensity. Talk about a fresh warning.
The Stock Market Indices
S&P 500 (SPY)
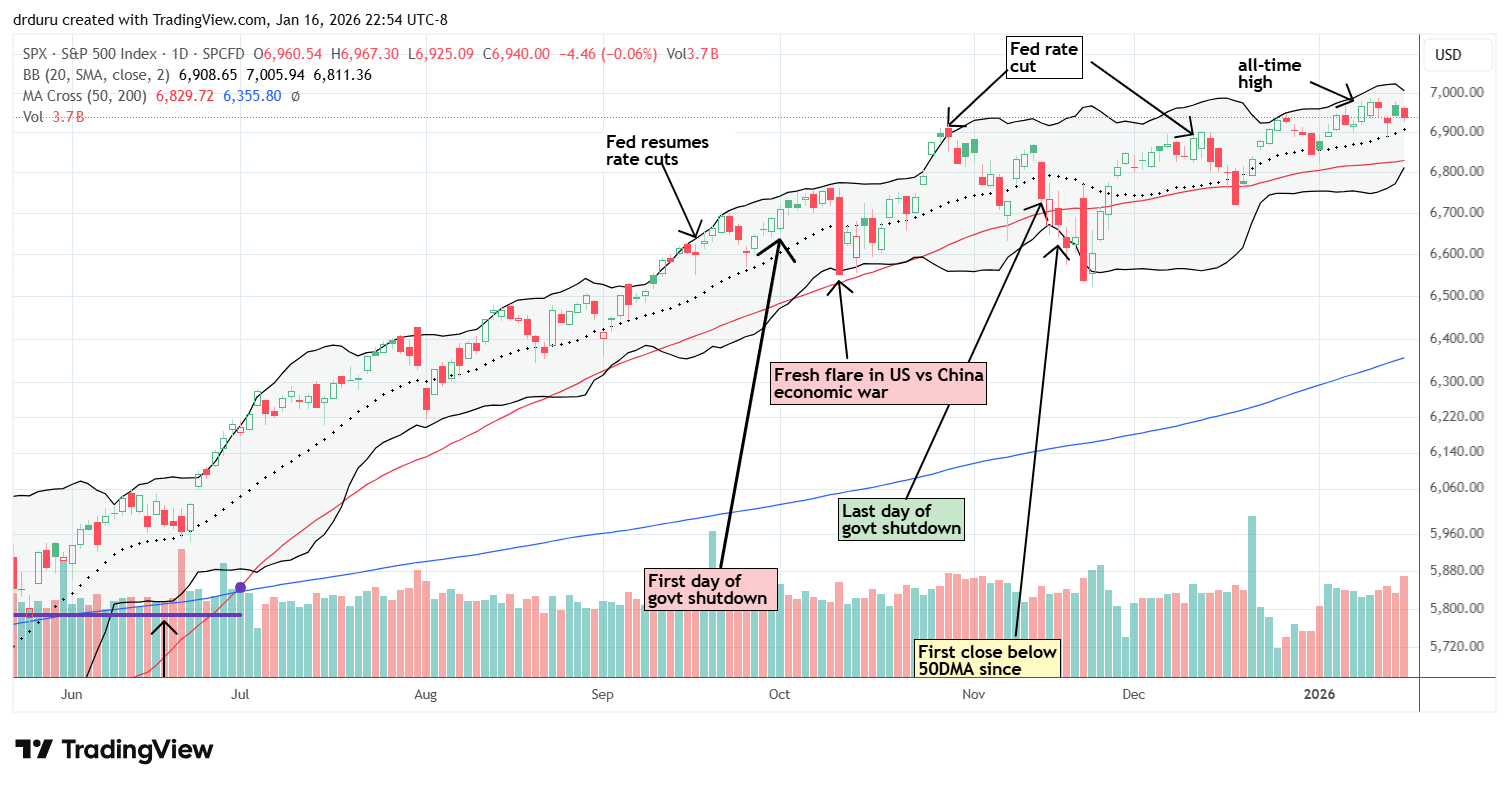
The S&P 500 set a marginal all-time high to start the week and then churned from there. My SPY call options from the previous week went to waste, and I reloaded given support at the 20-day moving average (DMA) (the dashed line) held. Overall, the index continued trending up and remained bullish. That strength in the uptrend and support helped keep from flipping bearish on the short-term trading call.
NASDAQ (COMPQ)
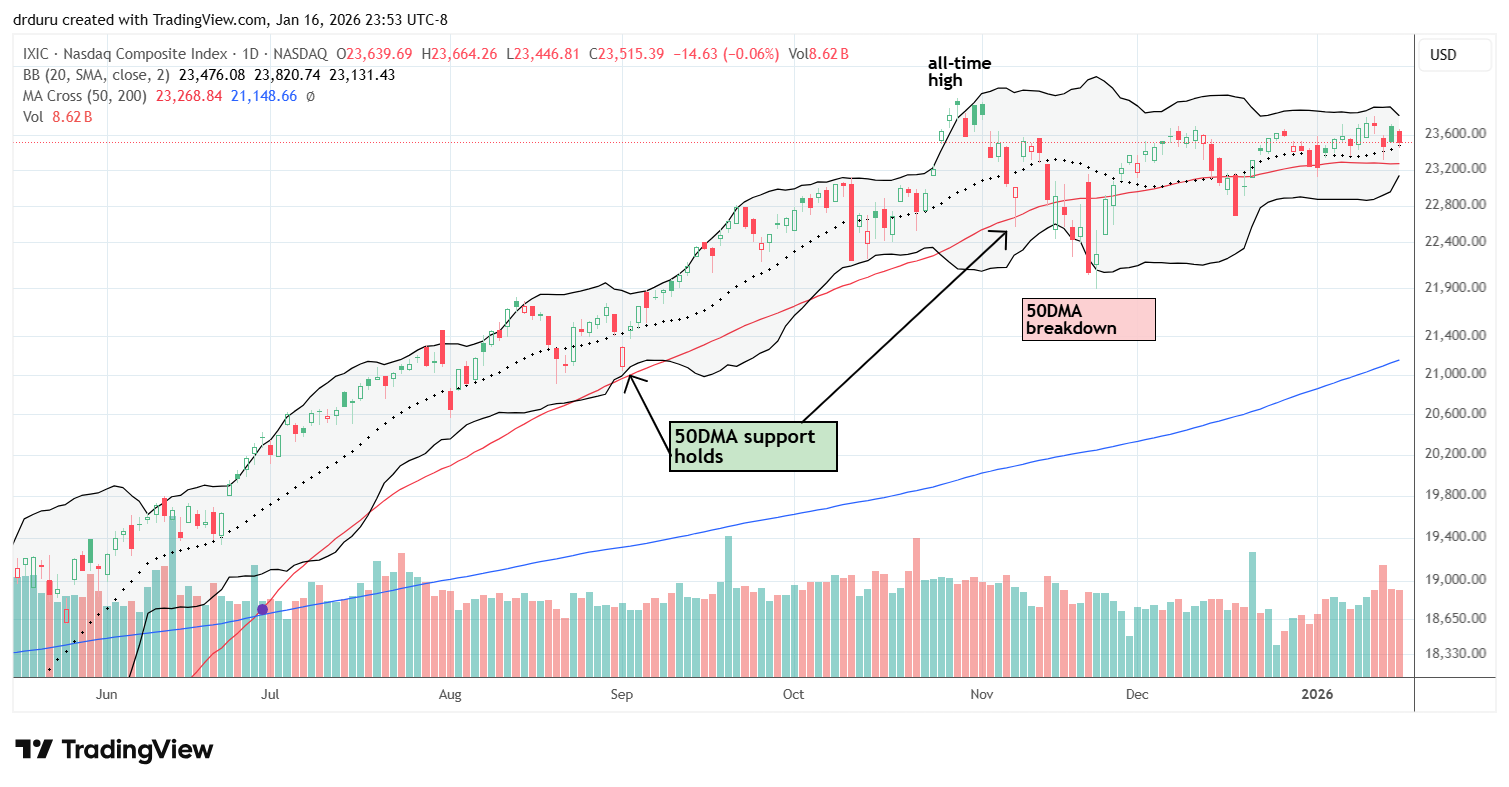
The NASDAQ looks incrementally more shaky that the S&P 500. The tech-laden index has yet to print a new all-time high since the October peak and is increasingly weighing on market breadth as a sector. Even so, the uptrend remains intact despite all the churn. Both the 20DMA and the 50DMA (the red line) rest comfortably below the price action.
iShares Russell 2000 ETF (IWM)
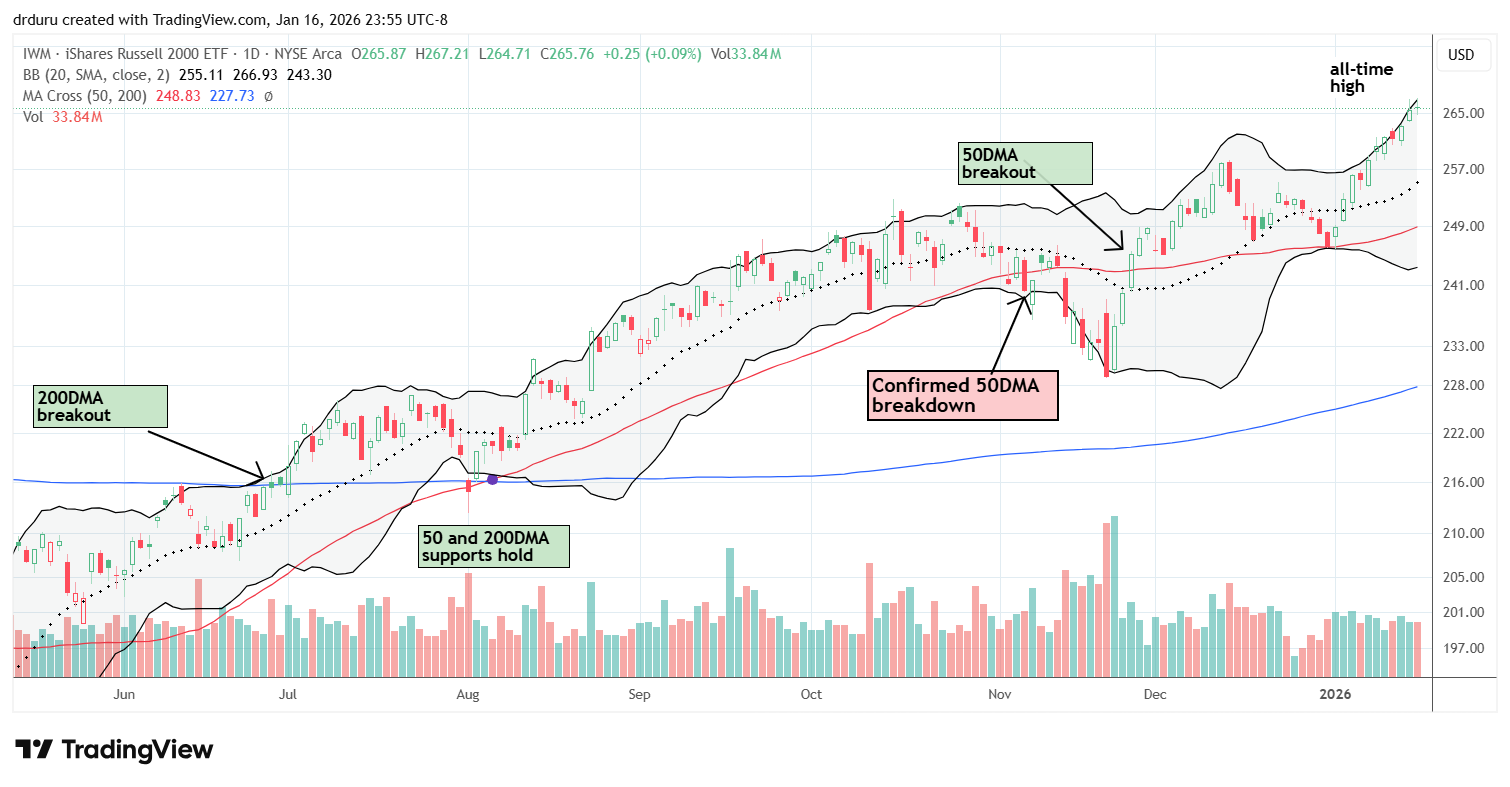
Small caps continue to look like one of the most impressive parts of the market. The iShares Russell 2000 ETF (IWM) has benefited from a nearly relentless uptrend this year that has also helped market breadth. This action represented the culmination of the investing call I made in the summer of 2024 thanks to the seductiveness of famous permabull. At the time, Lee predicted a 40% rally for small caps by year-end (imagine that), and I hopped aboard the hype train in a big way. IWM has been a major roller coaster since then, delivering “only” 21% so far. While I am excited to finally see definitive outperformance for IWM, the fresh warning from market breadth is tempering my enthusiasm.
The Short-Term Trading Call With A Fresh Warning
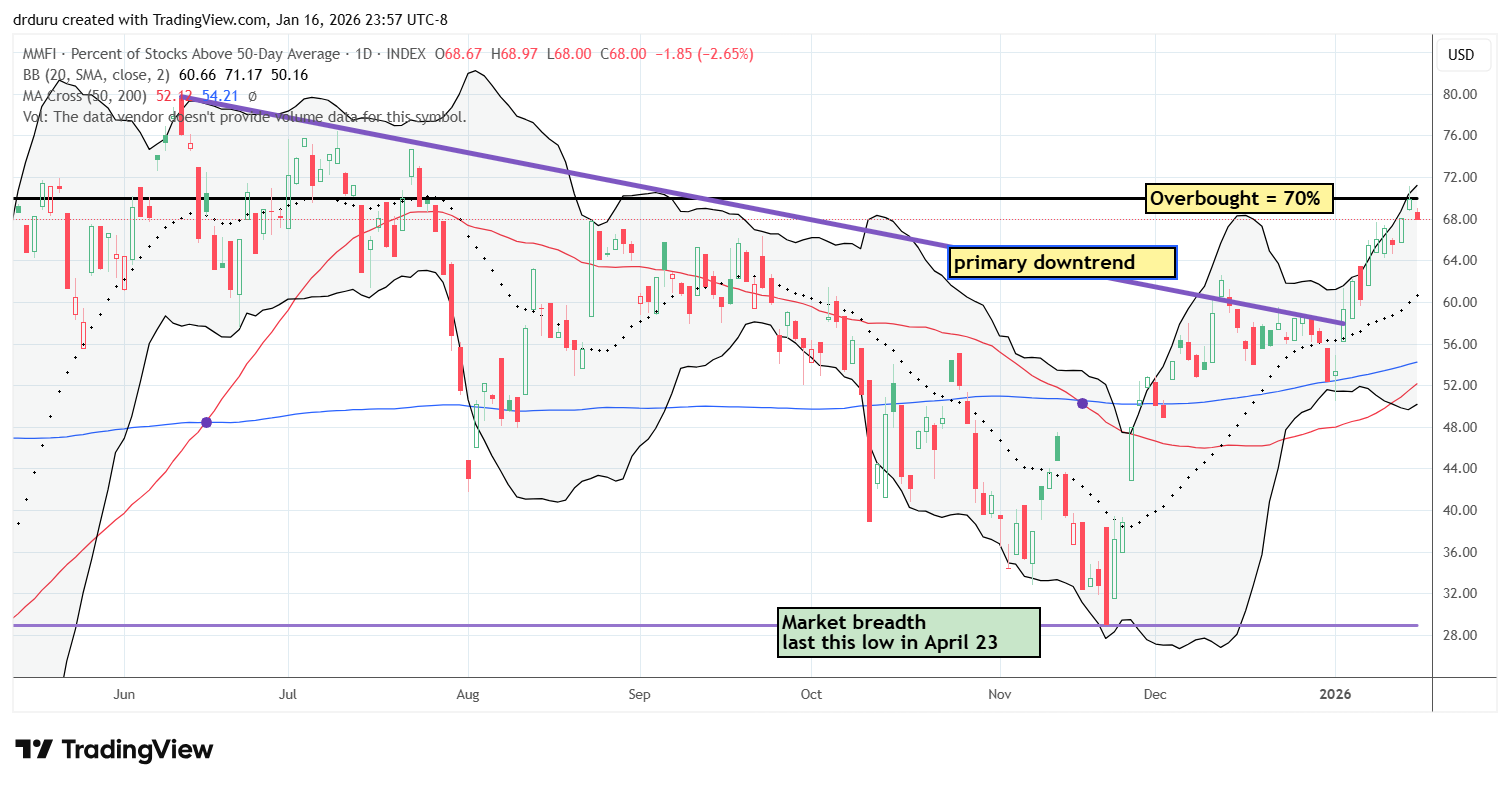
- AT50 (MMFI) = 68.0% of stocks are trading above their respective 50-day moving averages
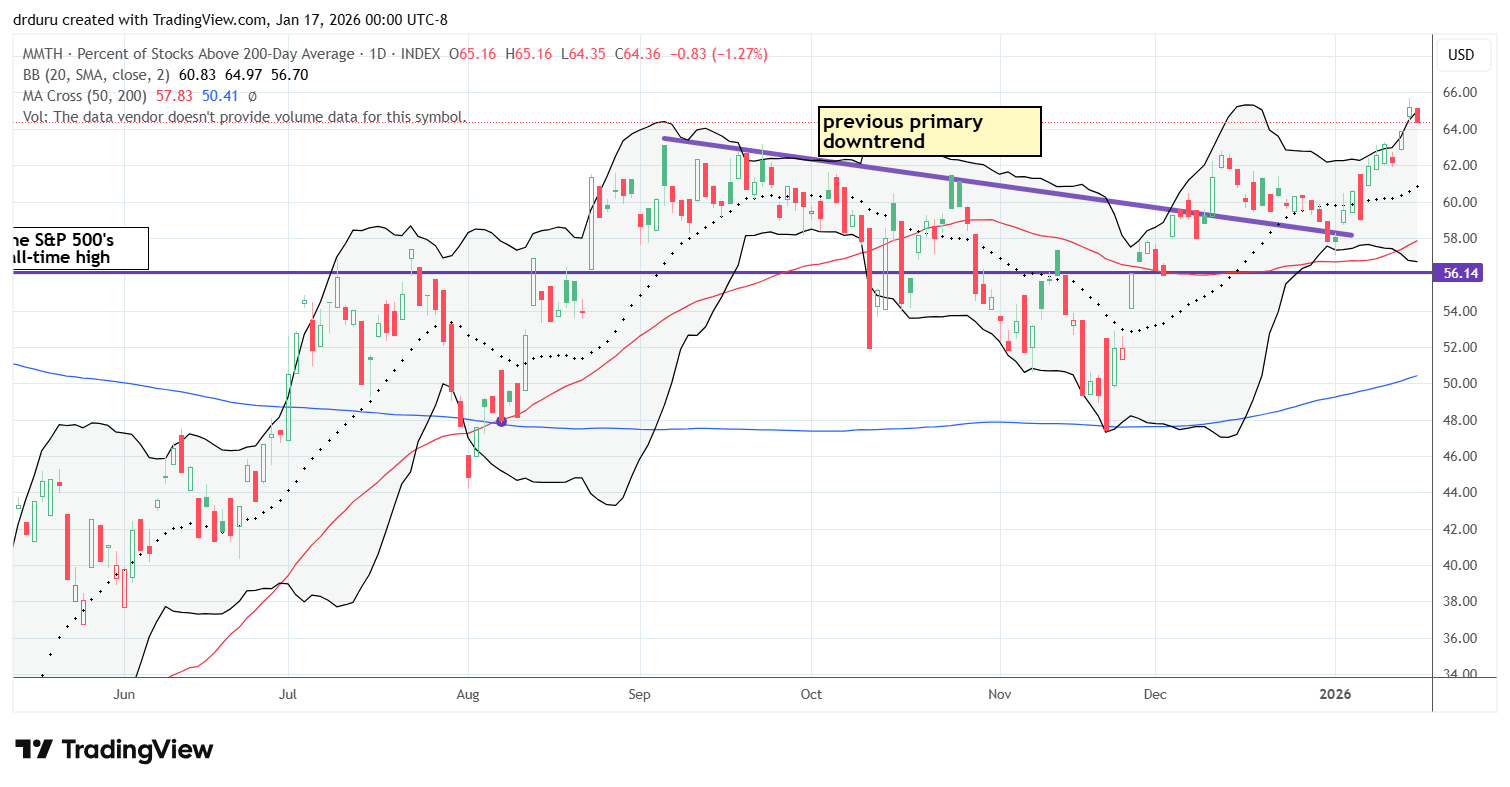
- AT200 (MMTH) = 64.4% of stocks are trading above their respective 200-day moving averages
- Short-term Trading Call: neutral
AT50 (MMFI), the percentage of stocks trading above their respective 50DMAs, closed the week at 68.1%. On Thursday, my favorite technical indicator briefly punched above the 70% overbought threshold and set up a mildly bullish move if it held. However, the fade from the overbought threshold sets up a fresh warning on market breadth. Under the AT50 rules, that reversal marked a bearish signal. As I noted in the beginning, I am not prepared to turn bearish because of the enduring uptrends across the indices. The market also has a number of potential positive catalysts coming from earnings season and the Supreme Court’s pending decision on the legality of Trump’s tariffs.
And then there is the longer-term indicator of the health of market breadth. AT200, the percentage of stocks trading above their respective 200DMAs, is still in bullish breakout territory. While I do not use AT200 as part of the market breadth trading rules, I do look to it for confirmation or contradiction of the AT50 signal. AT200 broke out above its downtrend and reached a year-and-a-half high.
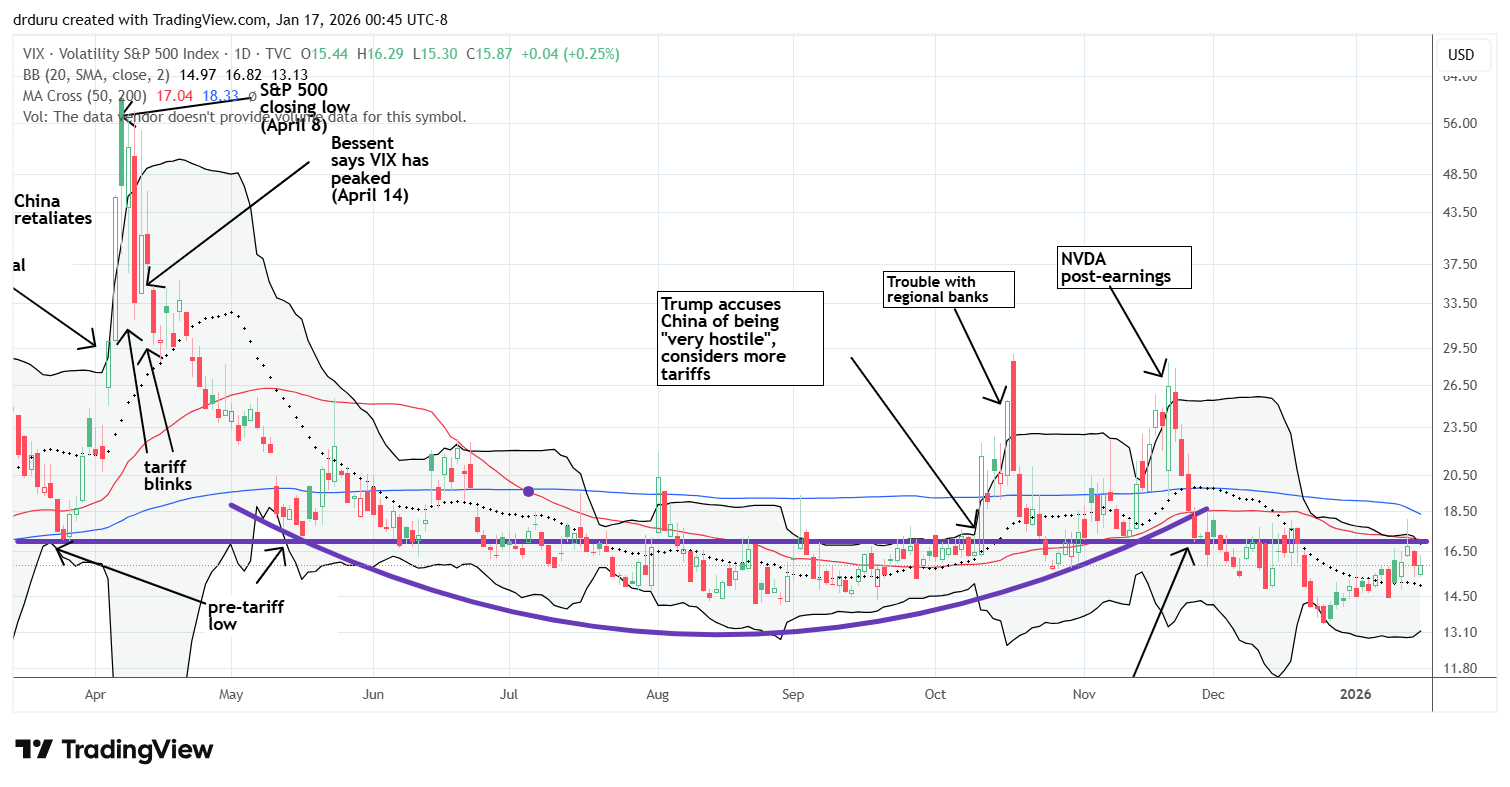
Finally, the volatility index (VIX) remains in bullish territory. The chart below shows how the VIX has repeatedly failed to breakout above its level right before the start of last year’s tariff trauma, drama, and noise. So, for now, the VIX is insisting on staying in a zone of complacency.
The Equities: Market Rotation and A Fresh Warning
In case you missed it…
Last week I explained why I sold my position in Abercrombine and Fitch (AND) and the bearish technicals in Microsoft (MSFT).
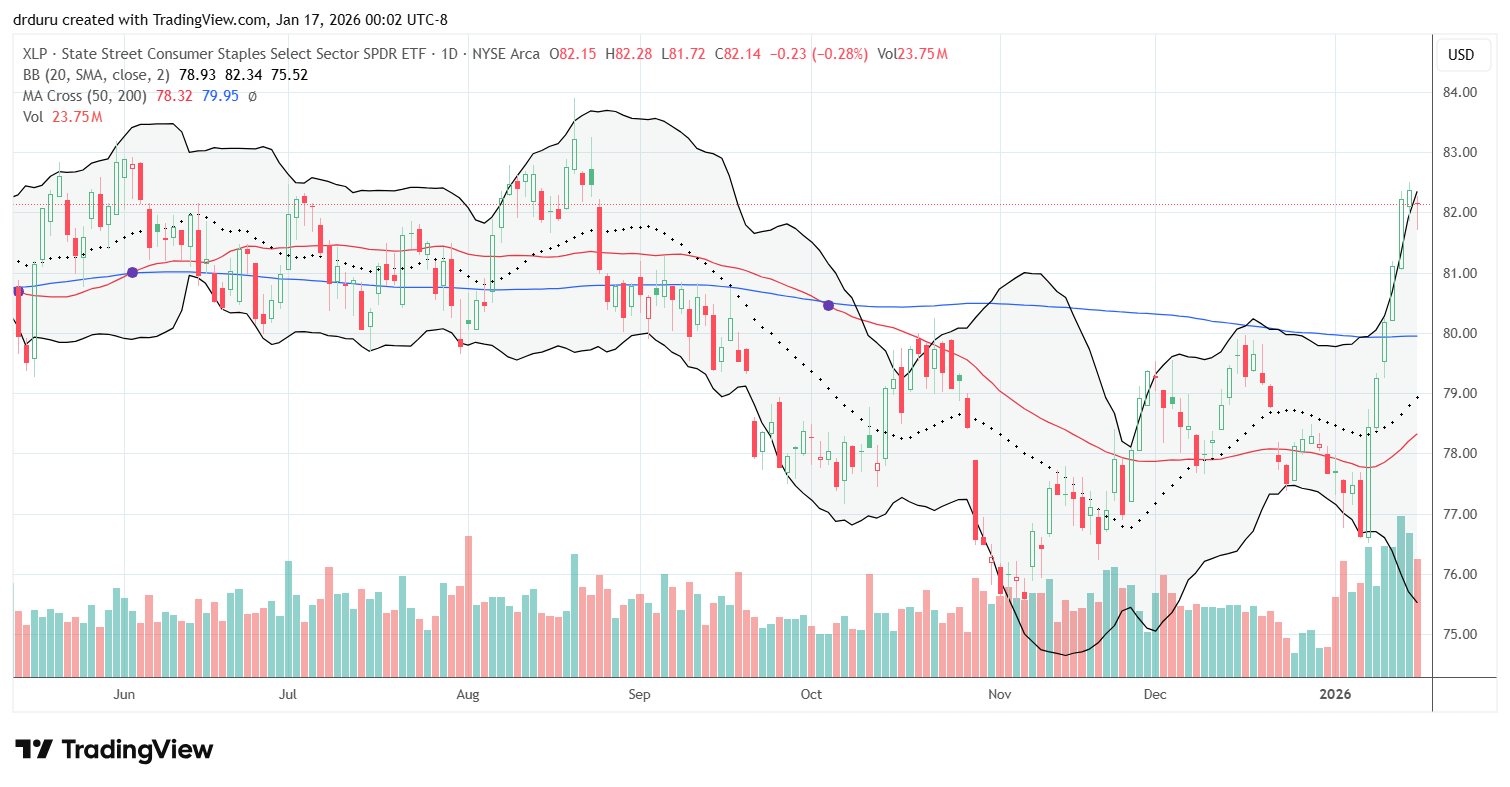
Consumer Staples Select Sector SPDR Fund (XLP)
Description: Consumer Staples Select Sector SPDR Fund (XLP) tracks U.S. consumer staples companies that produce essential goods.
Technical status: Market rotation has sent Consumer Staples Select Sector SPDR Fund (XLP) surging all year, including a 200DMA breakout, but remains below the top of a multi-year trading range.
Trade commentary: XLP started a massive uptrend after surging 2.4% on Thursday, January 8th. Buyers did not look back, and XLP broke above its 200DMA with only a small 0.3% pullback on Friday. Despite the strength of this move, XLP remains stuck firmly in an extended trading range. I have no interest in buying XLP, but it is important to note XLP’s contribution to market breadth since this kind of performance in a defensive sector suggests growing market concerns about growth. In other words, this abrupt interest in XLP could be its own fresh warning.
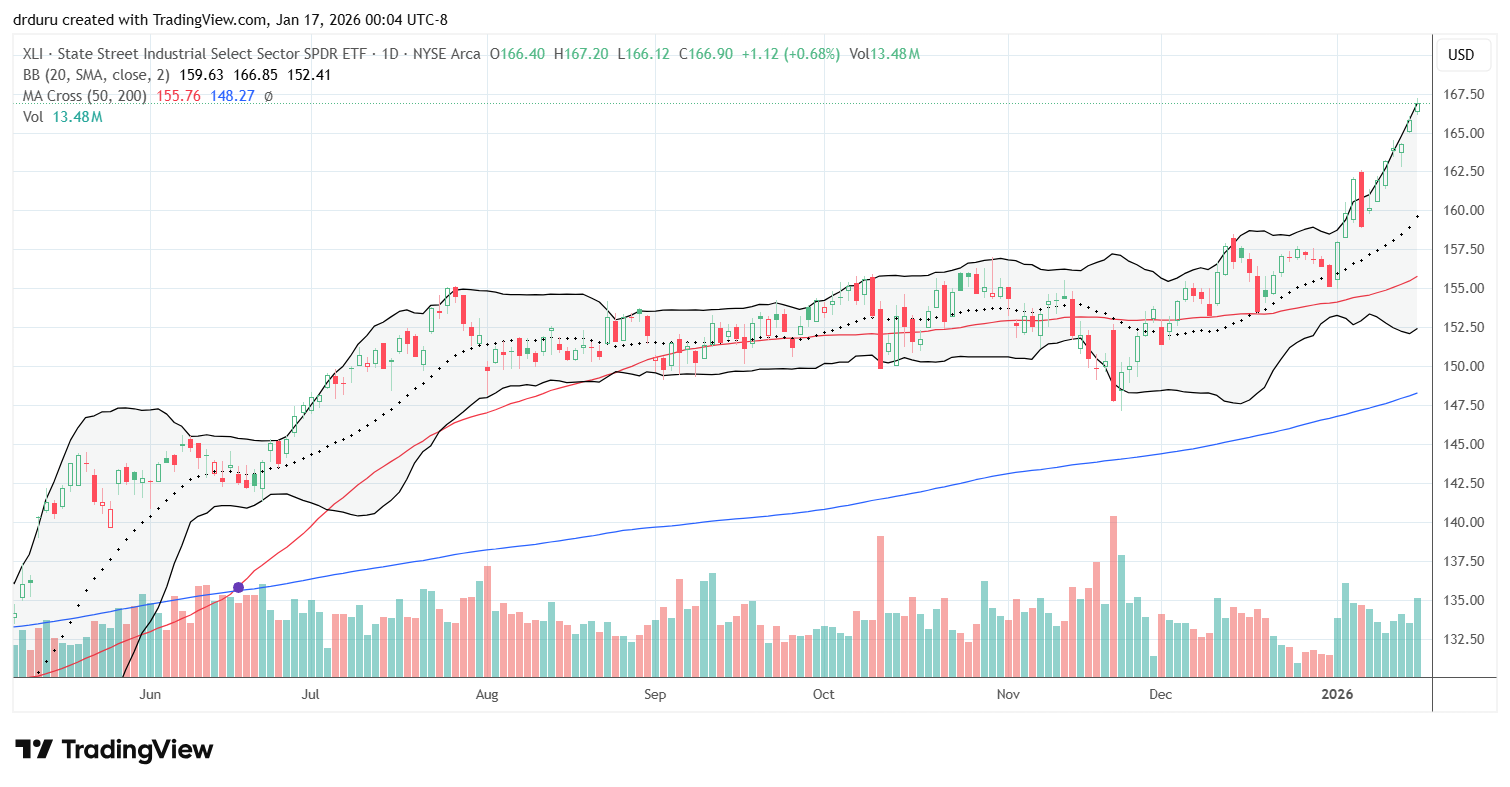
Industrial Select Sector SPDR Fund (XLI)
Description: Industrial Select Sector SPDR Fund (XLI) tracks U.S. industrial companies across manufacturing and services.
Technical status: Market rotation has helped the Industrial Select Sector SPDR Fund (XLI) broke out to all-time highs while riding the upper Bollinger Band without sustained parabolic behavior.
Trade commentary: Industrials helped power market breadth higher. Unlike staples, XLI broke out and reached all-time highs throughout the week. XLI followed its upper Bollinger Band (BB) but did not repeatedly peel above it, keeping me comfortable that the move has not turned parabolic. This interest in industrials is likely a direct beneficiary of waning interest in tech stocks.
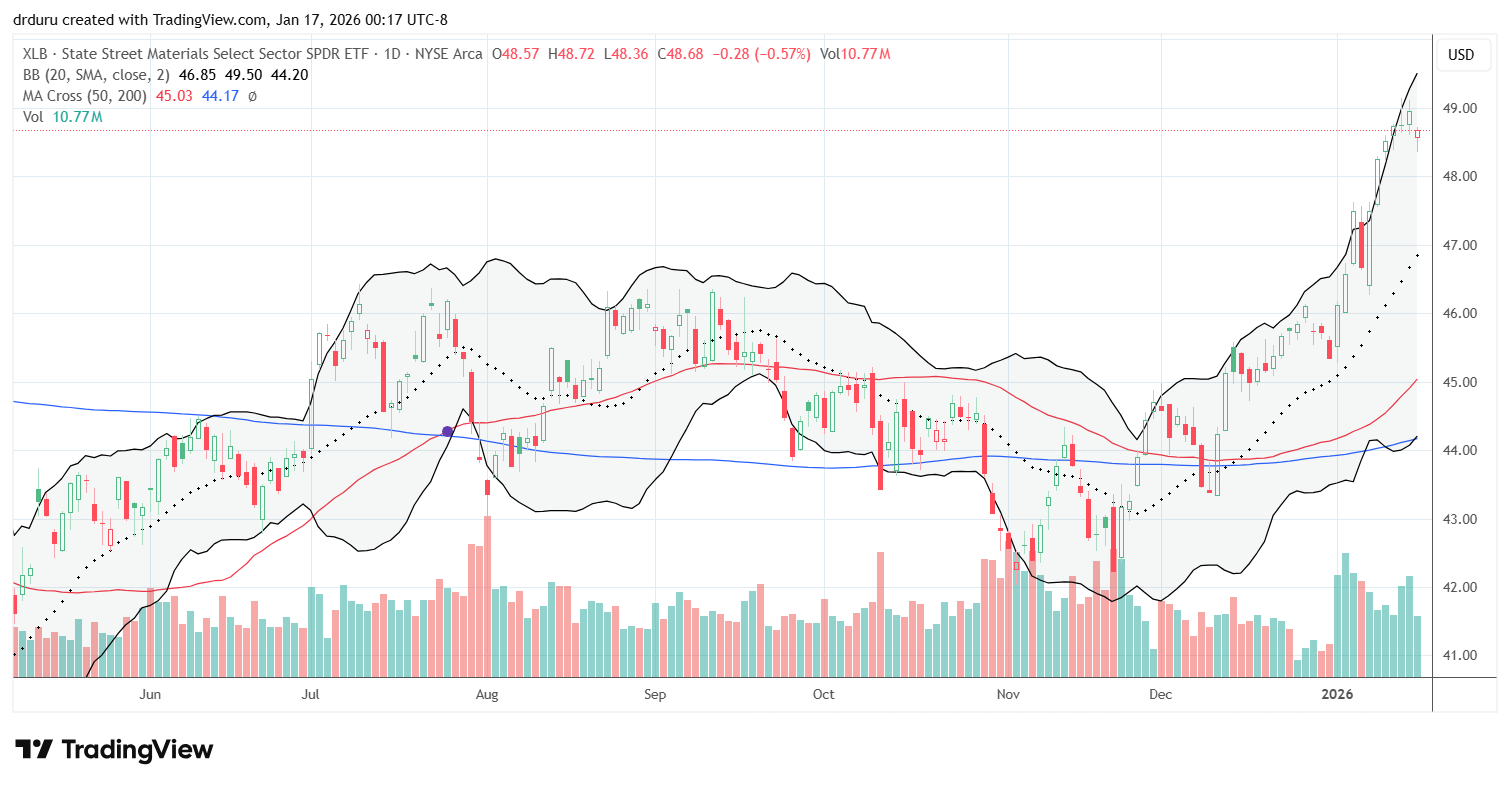
Materials Select Sector SPDR Fund (XLB)
Description: Materials Select Sector SPDR Fund (XLB) tracks U.S. materials companies involved in chemicals, metals, and construction materials.
Technical status: Market rotation started in November for the Materials Select Sector SPDR Fund (XLB). This year, XLB has powered higher and broke out modestly above late-2024 levels as part of an extended move.
Trade commentary: Materials moved alongside industrials, reflecting their close relationship. XLB powered higher for most of the year and broke out, although the breakout was more modest than in industrials. Even so, this action could mark the beginning of an extended move. The strength in materials aligns well with my bullishness in commodities in general as the administration tries to run the economy hot.
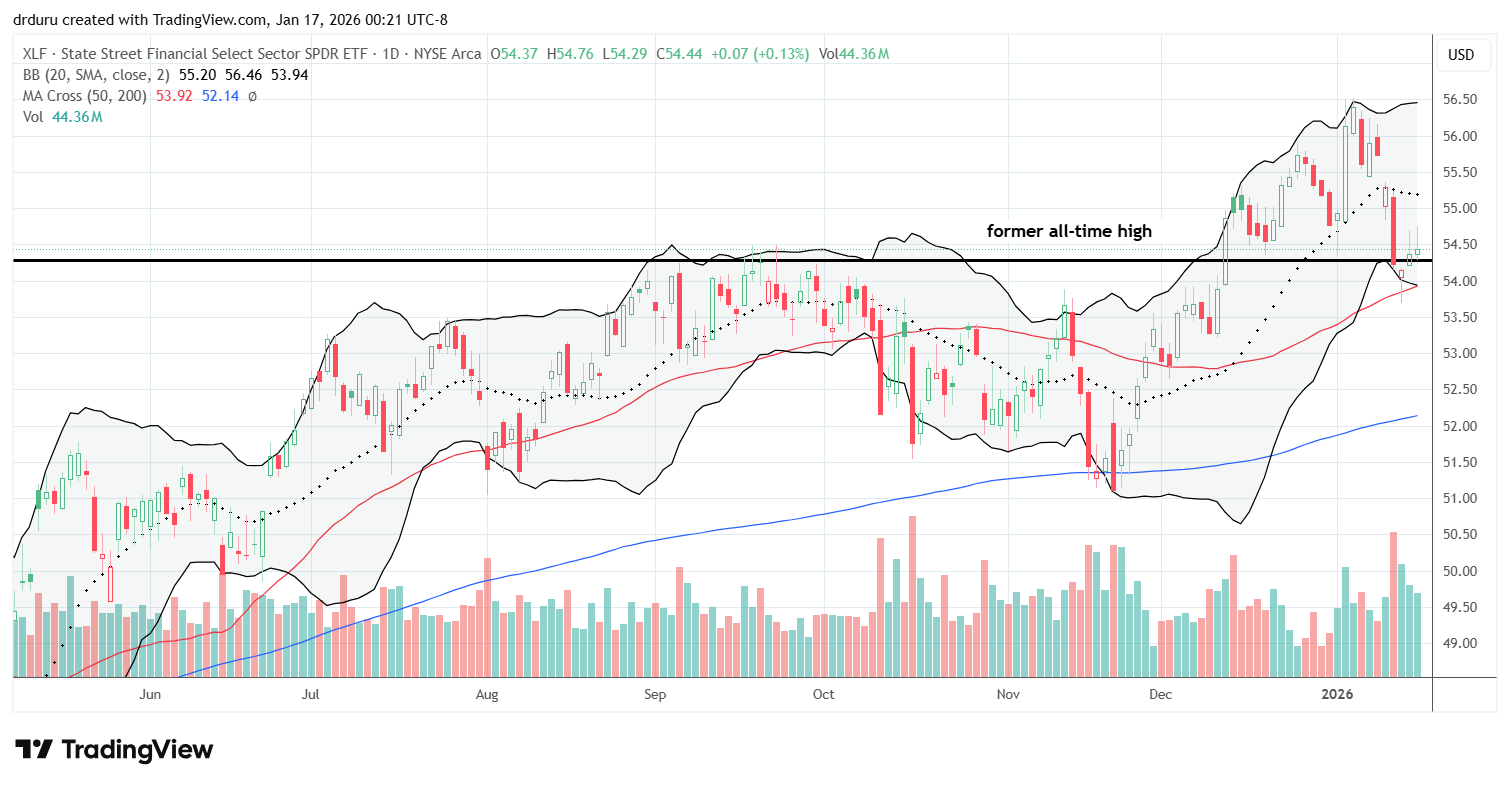
Financial Select Sector SPDR Fund (XLF)
Description: Financial Select Sector SPDR Fund (XLF) tracks U.S. financial companies including banks, insurers, and asset managers.
Technical status: The Financial Select Sector SPDR Fund (XLF) supported a fresh warning after falling sharply and slipping below a former all-time high. A bounce of 50DMA support helped XLF cling to the former all-time.
Trade commentary: Just last week I noted that it is hard to get bearish on the stock market when financials are bullish. Well, XLF technically added to the fresh warning by falling sharply from its bullish perch. XLF gapped down to start the week and sellers followed through the next day with a 1.9% downdraft as earnings weighed along with Trump making his desire to cap credit card interest rates very real. XLF dropped back to its former all-time high, and closed below that level. The ETF managed to hold 50DMA support, so I bought February call options. If the market is still bullish, XLF should rebound at some point in a month. If the market turns bearish, I expect XLF to suffer a 50DMA breakdown.
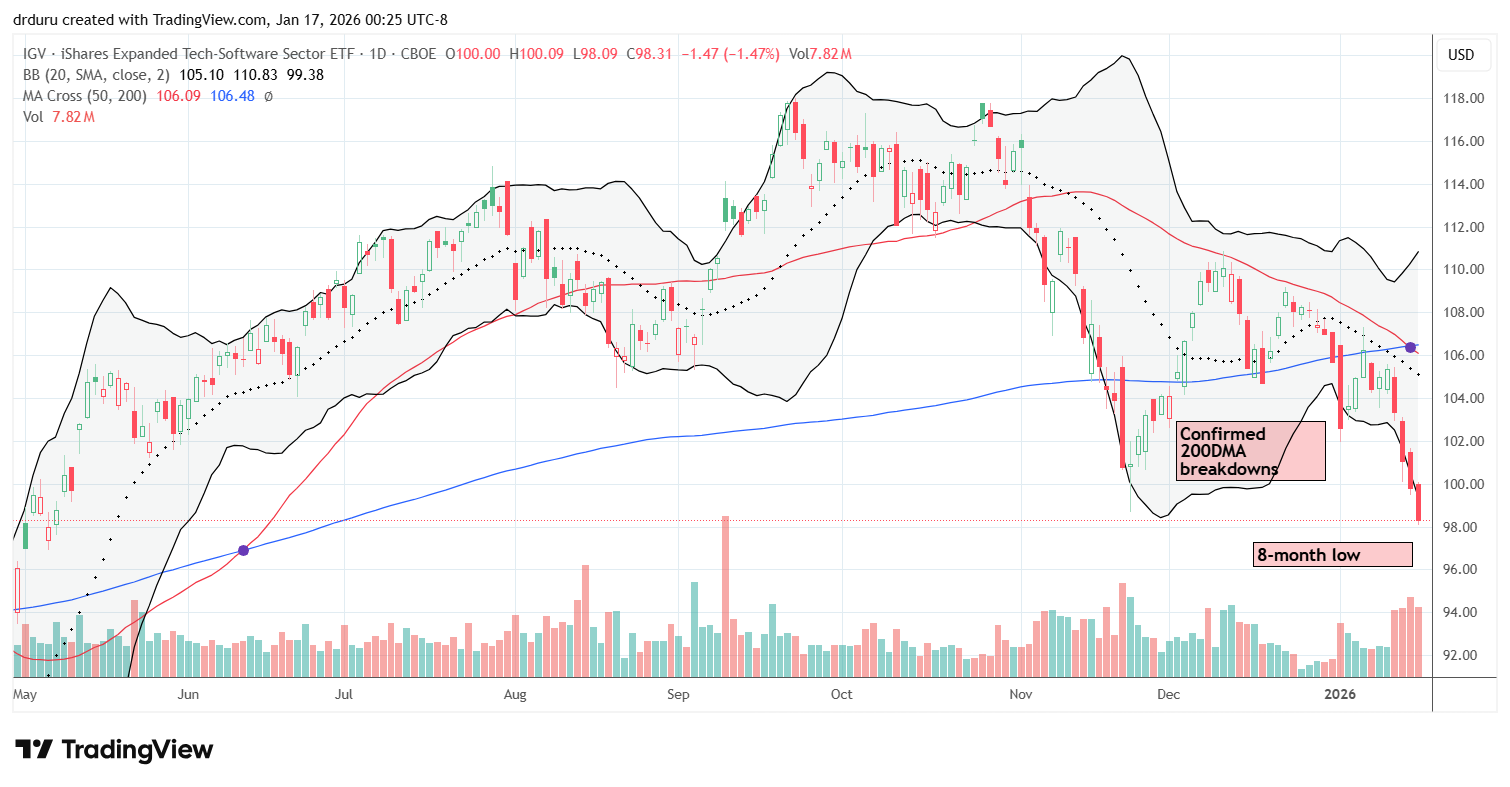
iShares Expanded Tech-Software Sector ETF (IGV)
Description: iShares Expanded Tech-Software Sector ETF (IGV) tracks U.S. software and technology-related companies.
Technical status: The iShares Expanded Tech-Software Sector ETF (IGV) plunged all week with a bearish rejection from converged 20 and 200DMA resistance on rising selling volume.
Trade commentary: IGV plunged 2.9% on the first trading day of the year, a move that intensified pressure on software stocks. The 200DMA breakdown flipped IGV bearish, and a failure at 200DMA resistance confirmed bearish conditions. Selling accelerated from there. Even though software stocks are on my shopping list for 2026, I am staying patient given this falling knife trading action.
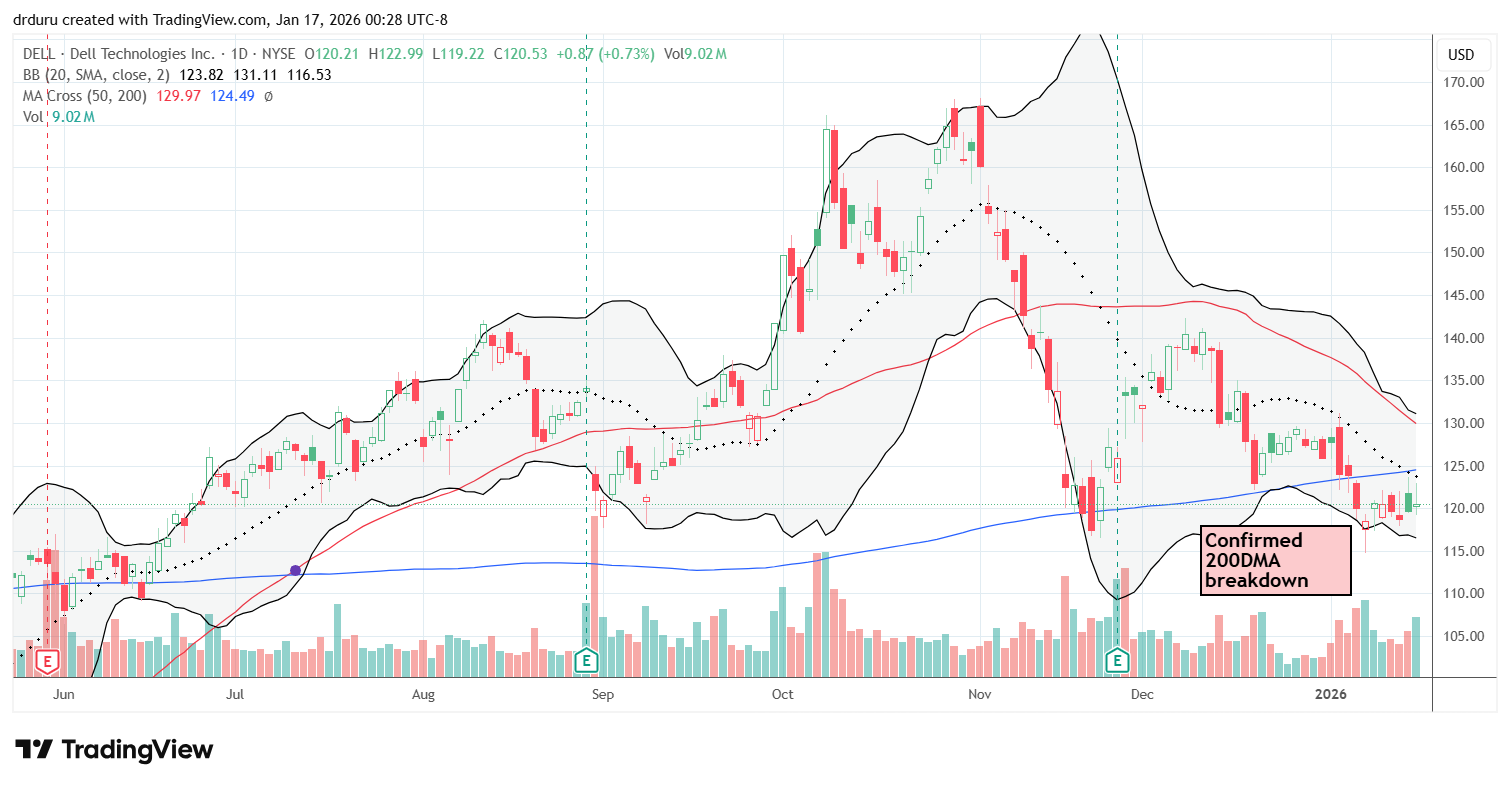
Dell Technologies (DELL)
Description: Dell Technologies (DELL) designs and sells computers, servers, storage systems, and related technology services.
Technical status: Dell Technologies (DELL) confirmed a 200DMA breakdown and compelled me to lock in remaining profits on a small bounce.
Trade commentary: One of my goals for 2026 was to hold onto my AI-related investments. Unfortunately, that resolve did not last long. DELL broke down below its 200DMA and churned from there. After waiting in vain for a revival in buying interest, I sold my shares to preserve my (small) remaining profits. I am unlikely to buy back into DELL and will instead reallocate cash to other AI-related investments.
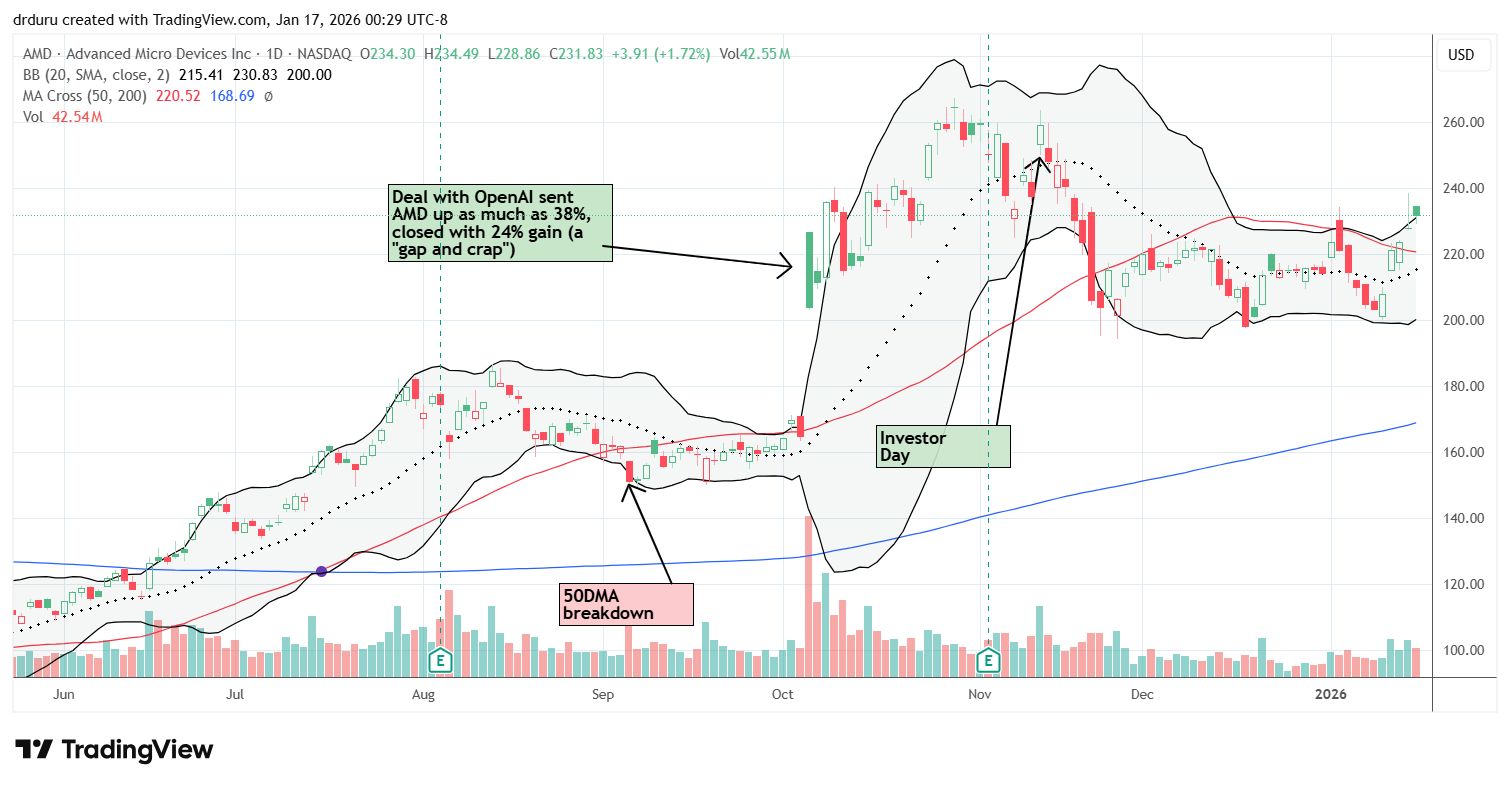
Advanced Micro Devices (AMD)
Description: Advanced Micro Devices (AMD) designs and sells microprocessors and graphics processing units.
Technical status: Advanced Micro Devices (AMD) enjoyed a 50DMA breakout after two months of churning. Per my plans, I bought back into the stock.
Trade commentary: Some of my DELL cash found its way to AMD. I re-entered AMD with a small position after a confirmed 50DMA breakout, using my no-regrets approach. AMD churned for two months since I stopped out AMD to preserve my substantial gains. With just a small number of shares on-hand, I plan to keep these shares as a core position under my previous thesis.
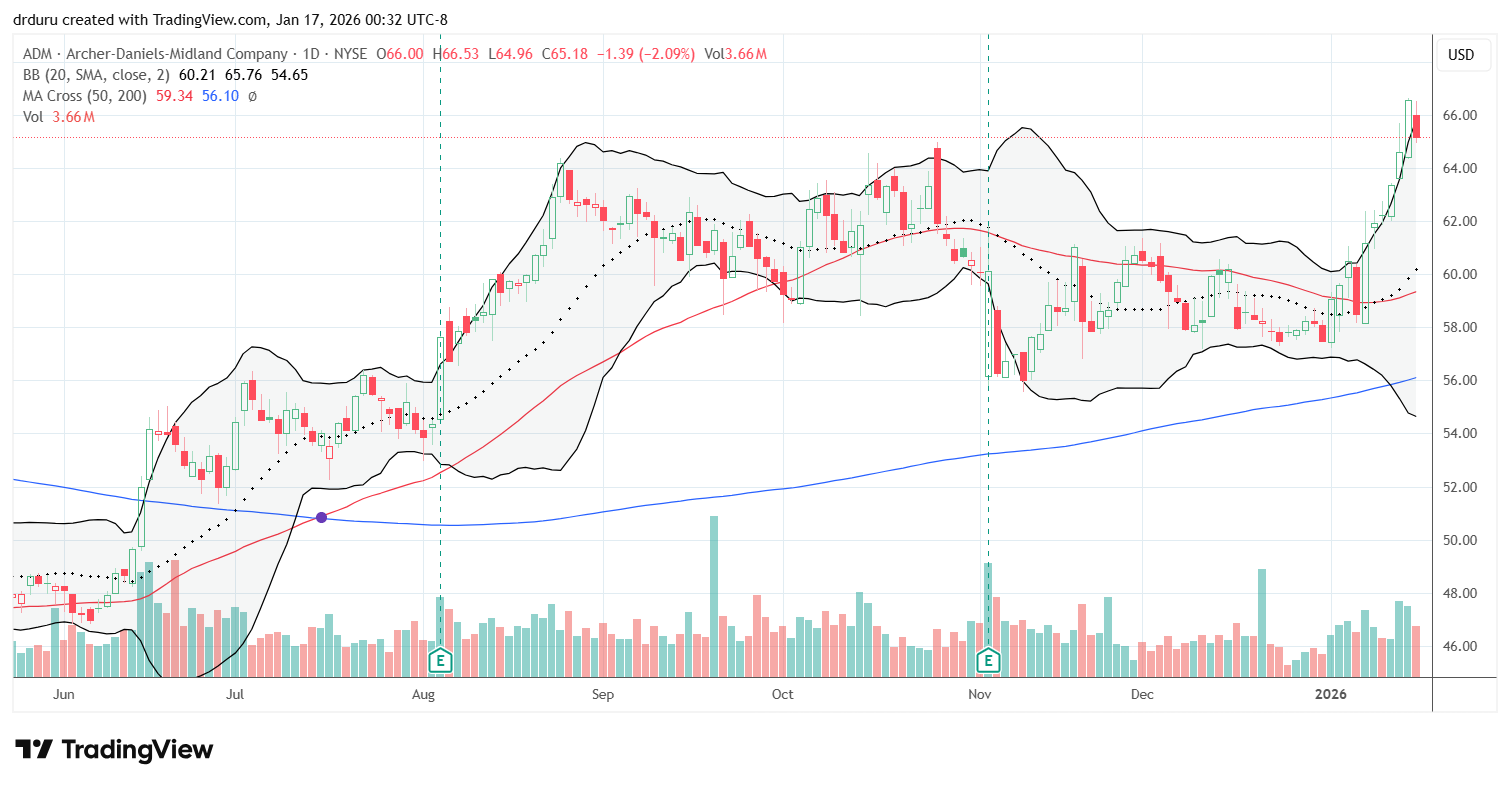
Archer Daniels Midland (ADM)
Description: Archer Daniels Midland (ADM) processes agricultural commodities and produces food and industrial products.
Technical status: Archer Daniels Midland (ADM) started the year with a 50DMA breakout on the heels of the market’s rotation. Five consecutive closes above the upper Bollinger Band ended with a 2.1% pullback.
Trade commentary: Last summer I made the case to sell my shares in SJM to buy ADM. That move worked out fantastically as SJM is much lower and ADM much higher since then. ADM has rebounded nicely after being out of favor for a long time. My upside expectations are tempered from here. If I did not already own shares, I would wait for a dip to buy instead of chasing a stock with consecutive closes above its upper Bollinger Band (a near parabolic move right now).
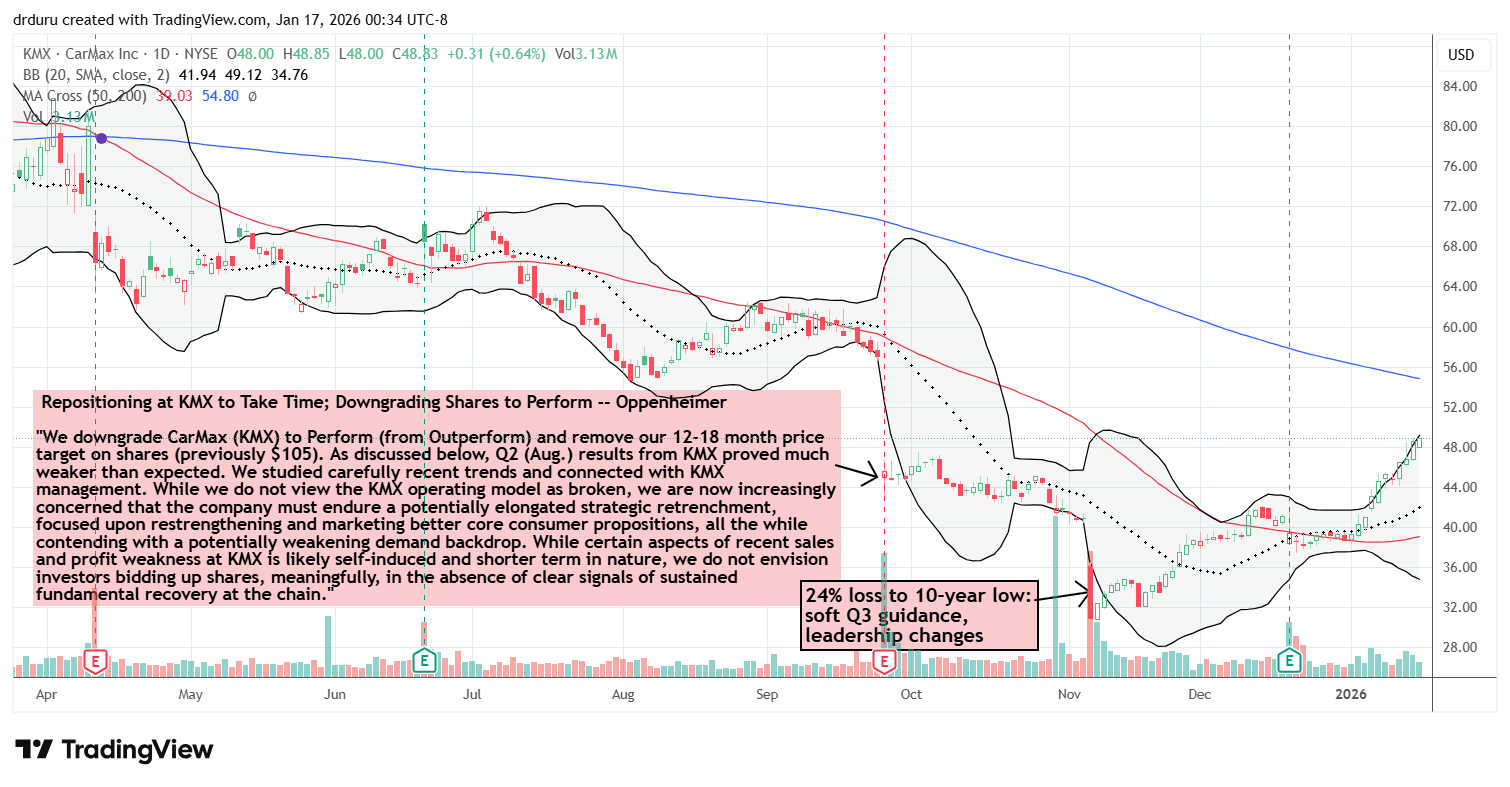
CarMax (KMX)
Description: CarMax (KMX) operates used vehicle retail stores and provides related services.
Technical status: CarMax (KMX) closed a post-earnings gap, broke above its 50DMA, and surged sharply through the new year partially thanks to market rotation.
Trade commentary: In September, I used KMX as a classic example of the importance of technicals after the stock plunged post-earnings after an extended downtrend. A 24% post-earnings plunge in November further cemented the lesson. However, buyers have stepped in nearly relentlessly from then in a new example of how money is seeping from winners and going to losers. KMX is one of many stocks that have gone straight up this year. If/once this expansion in market breadth comes to an end, I am looking to fade KMX around 200DMA resistance.
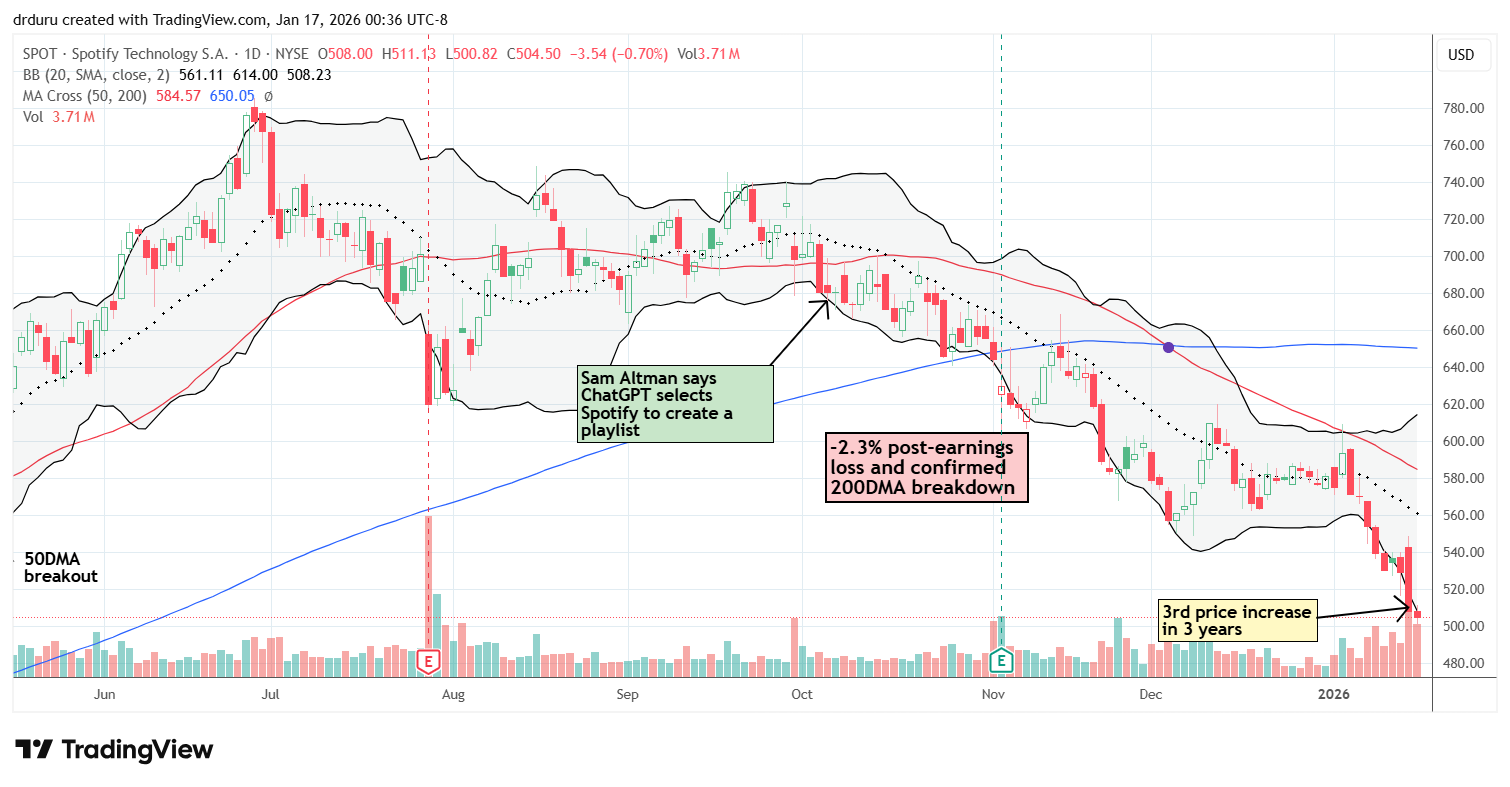
Spotify Technology (SPOT)
Description: Spotify Technology (SPOT) operates a global music and podcast streaming platform.
Technical status: Spotify Technology (SPOT) confirmed its downtrend with a failed test of 50DMA resistance and accelerated lower on concerns over a third price increase in 3 years.
Trade commentary: In December, I expressed relief in my earlier decision to stop out of SPOT. SPOT turned bearish after confirming a 200DMA breakdown with November earnings. Selling accelerated last week following news of a third price increase in three years. SPOT fell back to its April lows, and failure to hold 2025 support could open much more downside. A rebound will stall at downtrending 20DMA or 50DMA resistance.
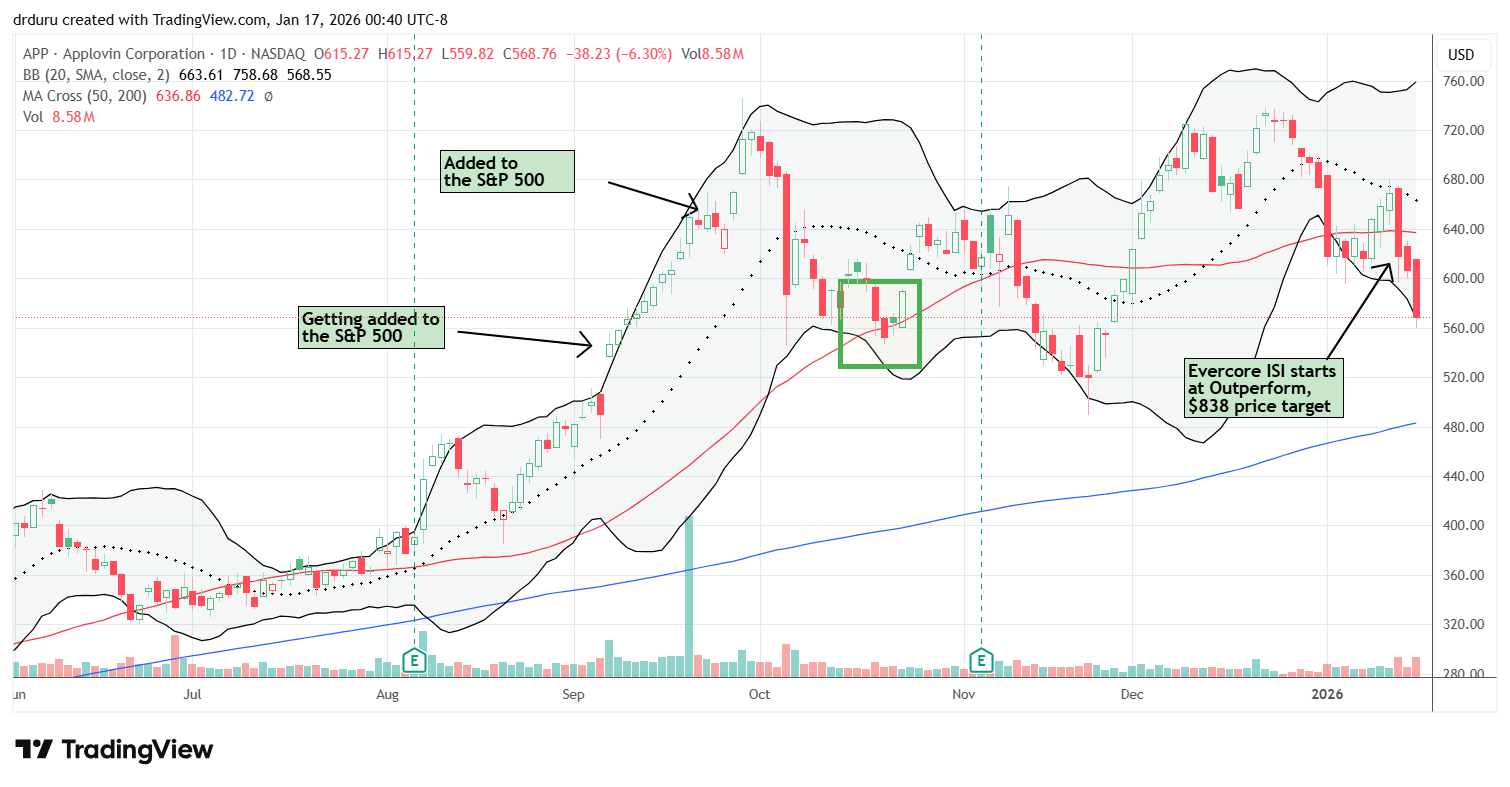
Applovin Corporation (APP)
Description: Applovin Corporation (APP) provides software solutions for mobile app marketing and monetization.
Technical status: Applovin Corporation (APP) sold off despite an upgrade, dropped below its 50DMA, and showed short-term bearish follow-through.
Trade commentary: Despite an upgrade with an $838 price target, APP sold off 7.6% and broke below its 50DMA. This unexpected reaction put APP on my radar, as stocks that fail to respond positively to good news often signal deeper issues. I am starting to wonder whether APP is somehow getting caught into the bearish sentiment on software stocks.
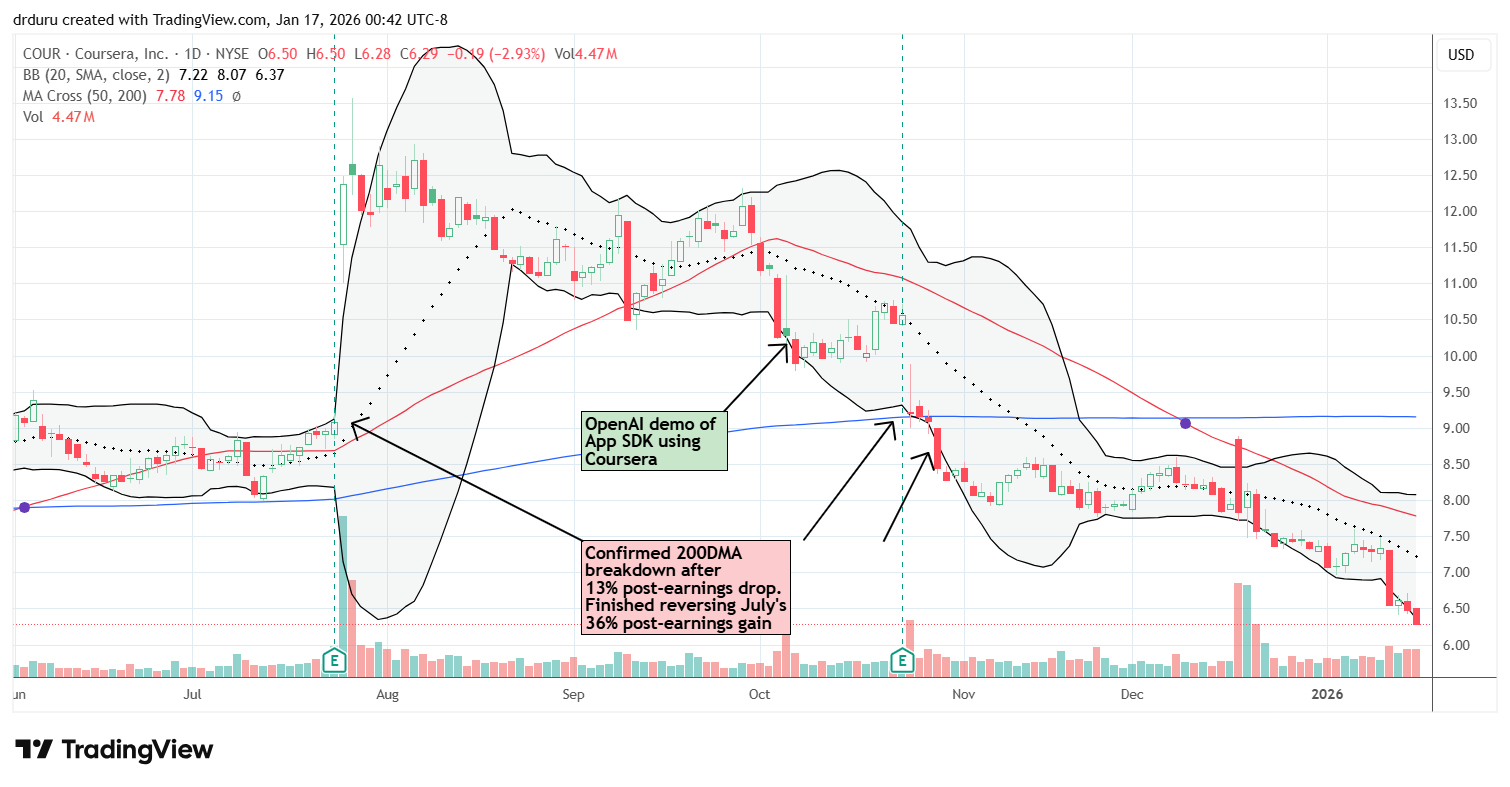
Coursera (COUR)
Description: Coursera (COUR) operates an online education platform offering courses and degree programs.
Technical status: Coursera (COUR) has trended downward ever since its summer post-earnings surge. I stopped out on the 200DMA breakdown and avoided what is COUR’s 2nd lowest close ever.
Trade commentary: COUR has continued to sell-off since I stopped out of my position. COUR failed to follow through on bullish earnings news in July. Exiting COUR reinforced my discipline of stepping aside when a stock is not working. Now the stock is on the edge of an all-time low. I assume AI-related fears are pressuring the stock.
Be careful out there!
Footnotes
Subscribe for free to get email notifications of future posts!
“Above the 50” (AT50) uses the percentage of stocks trading above their respective 50-day moving averages (DMAs) to measure breadth in the stock market. Breadth defines the distribution of participation in a rally or sell-off. As a result, AT50 identifies extremes in market sentiment that are likely to reverse. Above the 50 is my alternative name for “MMFI” which is a symbol TradingView.com and other chart vendors use for this breadth indicator. Learn more about AT50 on my Market Breadth Resource Page. AT200, or MMTH, measures the percentage of stocks trading above their respective 200DMAs.
Active AT50 (MMFI) periods: Day #151 over 20%, Day #40 over 30%, Day #38 over 40%, Day #33 over 50%, Day #9 under 60% (overperiod), Day #124 under 70%
Source for charts unless otherwise noted: TradingView.com
Full disclosure: long IWM shares, long SPY calls, long AMD, long ADM
FOLLOW Dr. Duru’s commentary on financial markets via StockTwits, BlueSky, and even Instagram!
*Charting notes: Stock prices are not adjusted for dividends. Candlestick charts use hollow bodies: open candles indicate a close higher than the open, filled candles indicate an open higher than the close.
* Blog notes: this blog was written based on the heavily edited transcript of the following video that includes a live review of the stock charts featured in this post. I used ChatGPT to process the transcript.