
Stock Market Commentary
There is no support in a bear market. The market is extremely volatile, and conditions are changing daily. The market is showing clear signs of weakness, with all major trends pointing downward. The mixed messages from yesterday (Thursday) are converging more clearly on the messages of a bear market. The long-term, mid-term, and short-term trends are down, and momentum indicators confirm strong downtrends. Technical signals like the lower Bollinger Band (BB) Walk indicate that indices and stocks are moving straight down without pausing at key levels.
Market breadth is deteriorating. This downward pressure means stocks continue to break through key technical levels without buyers stepping in. When no support exists, traders and investors must be prepared for treacherous market conditions where traditional support levels fail to hold.
Special note: This post is a heavily edited version of the transcript of my latest video describing the market action. I used ChatGPT (4.0) to help me transform the script into a blog post formatted according to my template. I edited the results for voice, grammar, accuracy, and conciseness. Interested readers should switch to the video to see a live demonstration of how to read the technicals on stock charts and get more detailed chart commentary.
The Stock Market Indices
The S&P 500 (SPY) continues its downward trend, slipping through critical support levels. The index barely paused at its 200-day moving average (DMA) (the blue line), a historically significant level for long-term market health. Instead of holding, the market simply moved lower, reinforcing the concept that no support exists in a bear market. The lower Bollinger Band Walk remains intact, signaling continued weakness.
")
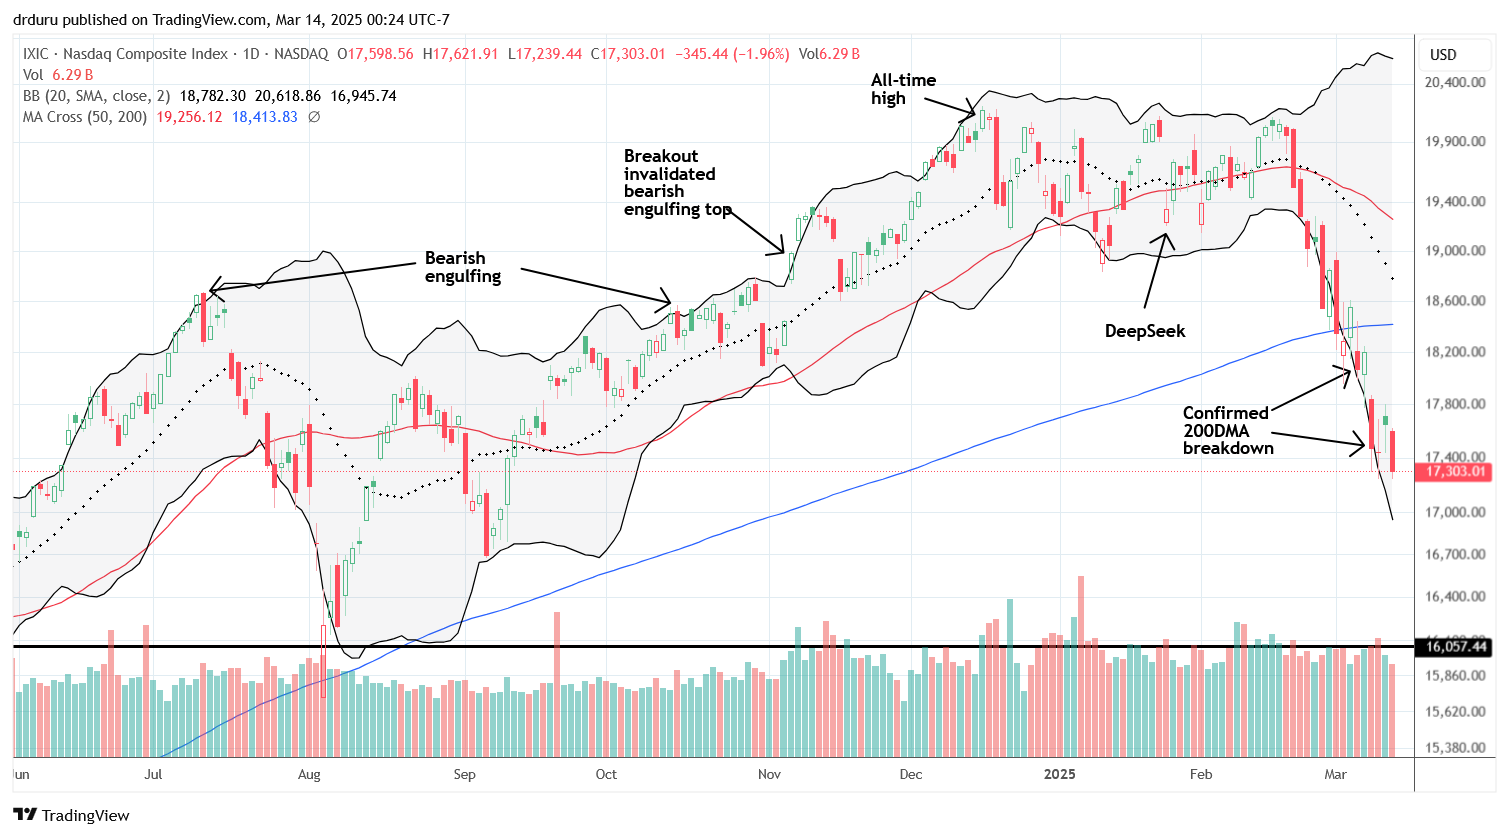
The NASDAQ (COMPQX) is following a similar pattern, with little relief from selling pressure. The index briefly attempted to pull away from its downward trajectory yesterday, but the bounce did not last. Now, both the S&P 500 and NASDAQ are back to six-month lows.
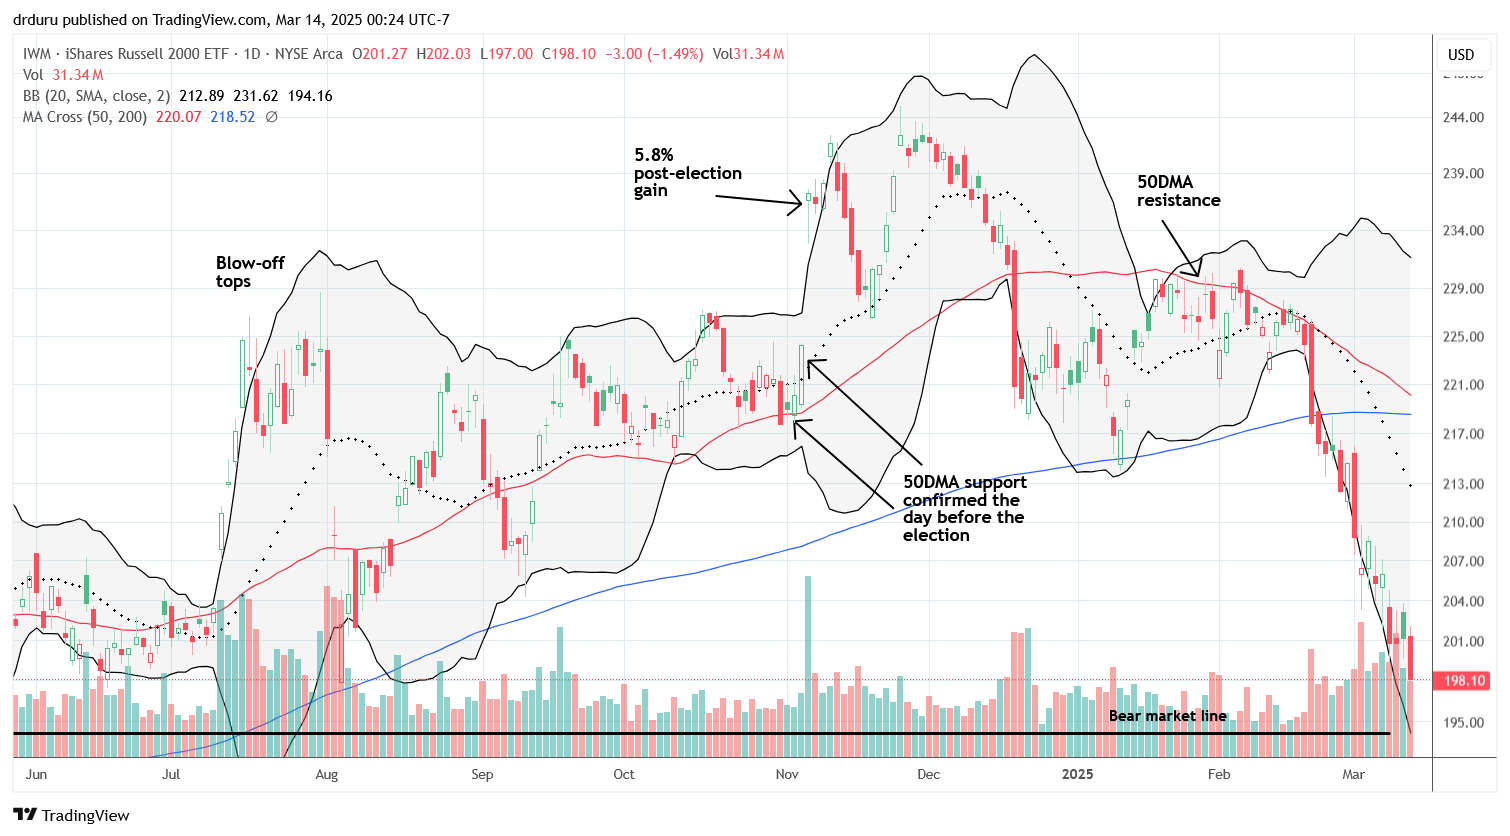
The iShares Russell 2000 ETF (IWM) is creeping closer to the conventional definition of a bear market—20% off its all-time high. IWM is essentially at a conventional bear market. The market is showing persistent signs of selling pressure, with small caps underperforming relative to large-cap stocks.
The Short-Term Trading Call With No Support
- AT50 (MMFI) = 21.8% of stocks are trading above their respective 50-day moving averages
- AT200 (MMTH) = 32.6% of stocks are trading above their respective 200-day moving averages
- Short-term Trading Call: cautiously bullish
AT50 (MMFI), the percentage of stocks trading above their respective 50DMAs, closed at 21.8%, ever closer to the official oversold threshold of 20%. The current bear market action means that my cautiously bullish stance is a bid for a bounce to resistance levels that I expect to hold firm. I am still itching to trigger the AT50 trading rules.
Long-term market health is also deteriorating. The percentage of stocks trading above their 200DMAs (AT200) plunged again, now sitting at 32.6%. The trend remains downward, reinforcing the broad-based nature of the current market decline
The Equities: No Support
Apple (AAPL) – Deeper into its bear market.
AAPL is demonstrating that in a bear market, no support exists. The stock has moved well below its lower Bollinger Band and continues to slide downward. It technically triggered a short signal at higher levels, but it remains dangerous to short at these extreme levels due to its oversold condition. However, buying is equally risky, as AAPL continues to decline without forming any meaningful support.
")
Amazon (AMZN) – Losing key support levels.
AMZN attempted to hold at its 200DMA, but ultimately failed. The stock has been struggling to maintain any level of support and is now on the verge of breaking down further. If AMZN moves lower, it will be yet another confirmation of bear market action.
")
iShares U.S. Home Construction ETF (ITB) – No bottom in sight.
ITB has already hit a 20% correction from its all-time high, confirming a bear market within the sector. The market’s failure to sustain even temporary rebounds reinforces the idea that no support is holding. The initial breach occurred at the end of last year, and the weakness has deepened since.
")
Retail Stocks (XRT) – Broad retail sector weakness.
XRT is also demonstrating classic bear market trading action. The ETF is following a Lower Bollinger Band Walk, confirming a sharp decline with no immediate relief. Even major retailers like Walmart (WMT) and Costco (COST) are failing to hold their 200-day moving averages, showing that even the strongest stocks are struggling to find support.
")
Goldman Sachs (GS) and JP Morgan (JPM) – Financial stocks breaking down.
GS has now confirmed a breakdown below its 200-day moving average, a significant bearish signal. JPM has also followed this pattern, slicing through support and heading lower. These breakdowns add to the evidence that no support is holding, even in formerly strong financial stocks.
")
Robinhood (HOOD) – Post-earnings gains erased.
HOOD initially surged 14% after earnings, only to give back those gains in a steep decline. The stock continues to move downward, showing no support as it retraces toward lower levels. Like many stocks in this environment, even strong earnings reactions are being faded by sellers. I am watching 200DMA support for an opportunity to accumulate more stock.
")
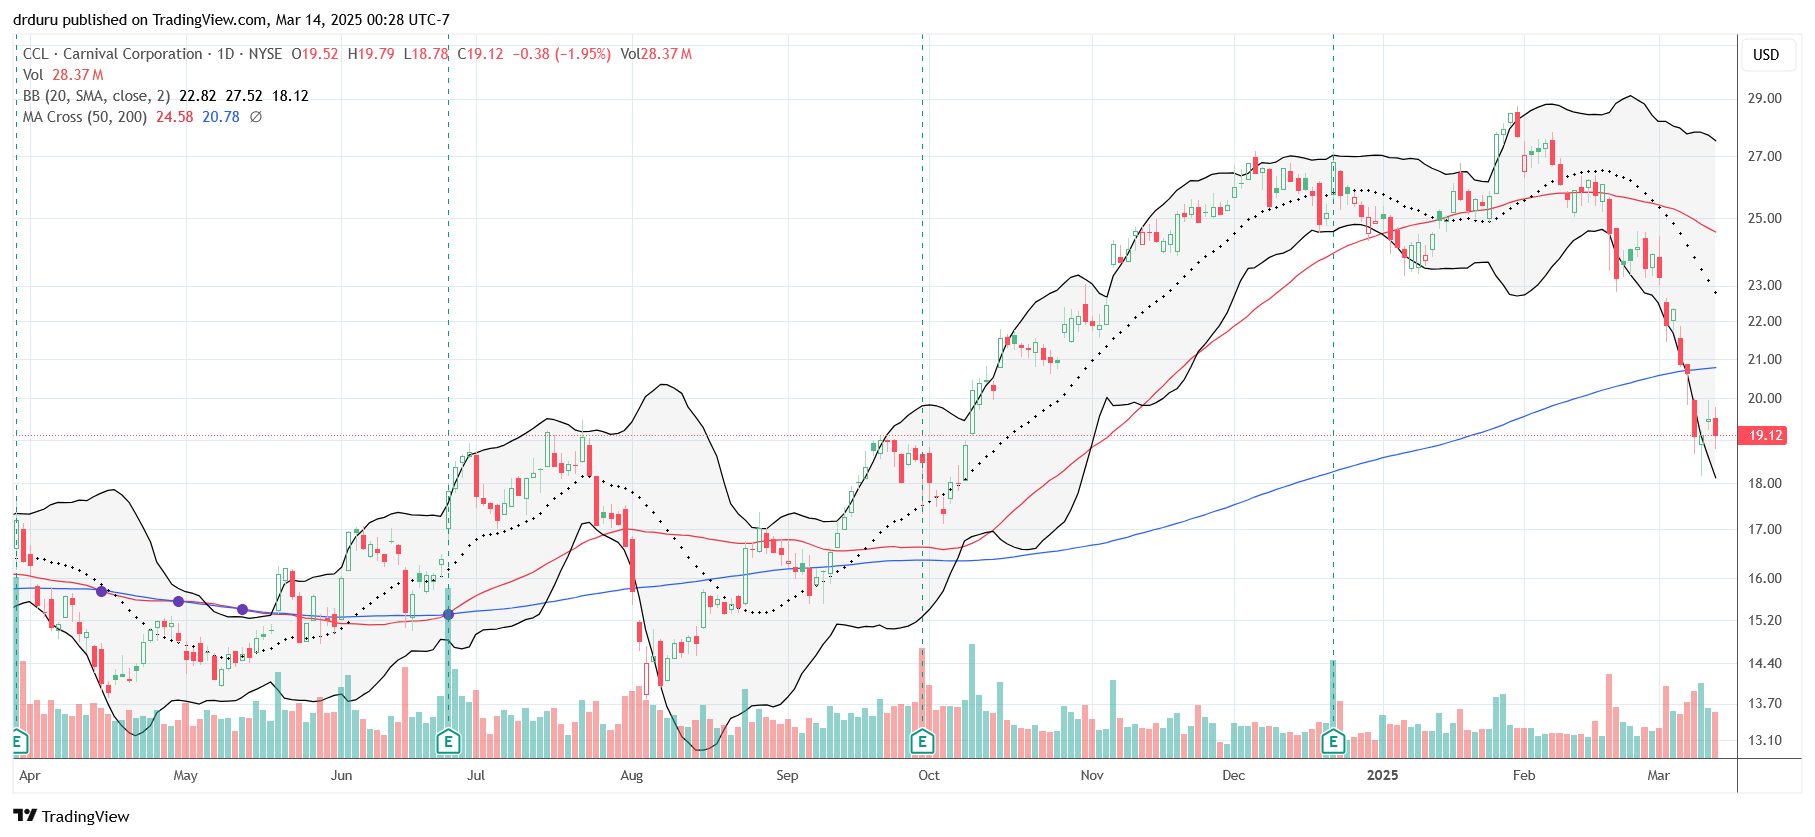
Carnival Cruise (CCL) – A stock still struggling to recover.
CCL remains in a long-term struggle, still trying to recover from its post-pandemic losses. Unlike Royal Caribbean, which has regained strength, CCL has not been able to sustain a significant uptrend. The stock has broken down further in this latest market decline, reinforcing its position as a weaker name in the sector.
Whirlpool (WHR) – An early warning sign of consumer weakness.
WHR suffered a massive 16.5% post-earnings loss in January, signaling weakening consumer demand. The stock remains in a downtrend and has reversed all its pandemic-era gains.
Intuitive Surgical (ISRG) – Failed support at the 200DMA.
ISRG initially appeared to be holding up well, as the stock broke above its 200DMA, suggesting potential strength. However, the breakout quickly failed, and ISRG closed below the 200-day moving average, a bearish signal. A better strategy for a stock like this, particularly for conservative traders, would have been to wait for confirmation of support, requiring two consecutive closes above the 200DMA. Now, ISRG is facing downward pressure, and the stock could continue lower if market conditions remain weak.
S&P Global (SPGI) – Struggling to hold critical levels.
SPGI has broken down below its 200DMA and is now testing its low for the year. The stock had previously held onto support at that level but has since lost ground. This breakdown places SPGI at risk of further declines, as there is no immediate technical support to hold prices.
Intel Corporation (INTC) – Momentum remains unpredictable.
INTC has been a long-suffering stock, but recent developments provided a temporary boost. The announcement of a new CEO led to a 14.6% rally, briefly lifting INTC above key technical levels. However, the stock remains below its 200DMA, a sign that it is still struggling to regain long-term strength. INTC remains unpredictable, and its broken chart pattern suggests that it could continue to move in either direction depending on market sentiment.
F5 (FFIV) – Post-earnings breakout reversed.
FFIV had a very strong post-earnings response, surging 11.4%. The stock made a new high two weeks after earnings, but then fell straight down, completely reversing those gains. FFIV has now broken below the 50DMA (the red line), which puts it in a dangerous technical position. Momentum suggests that the stock will continue falling toward the 200-day moving average. When a stock is stuck between these two moving averages, the risk increases—either it reverses quickly to reclaim the 50DMA, or it continues its downward slide. Given the current market weakness, the lower trendline remains the likely target.
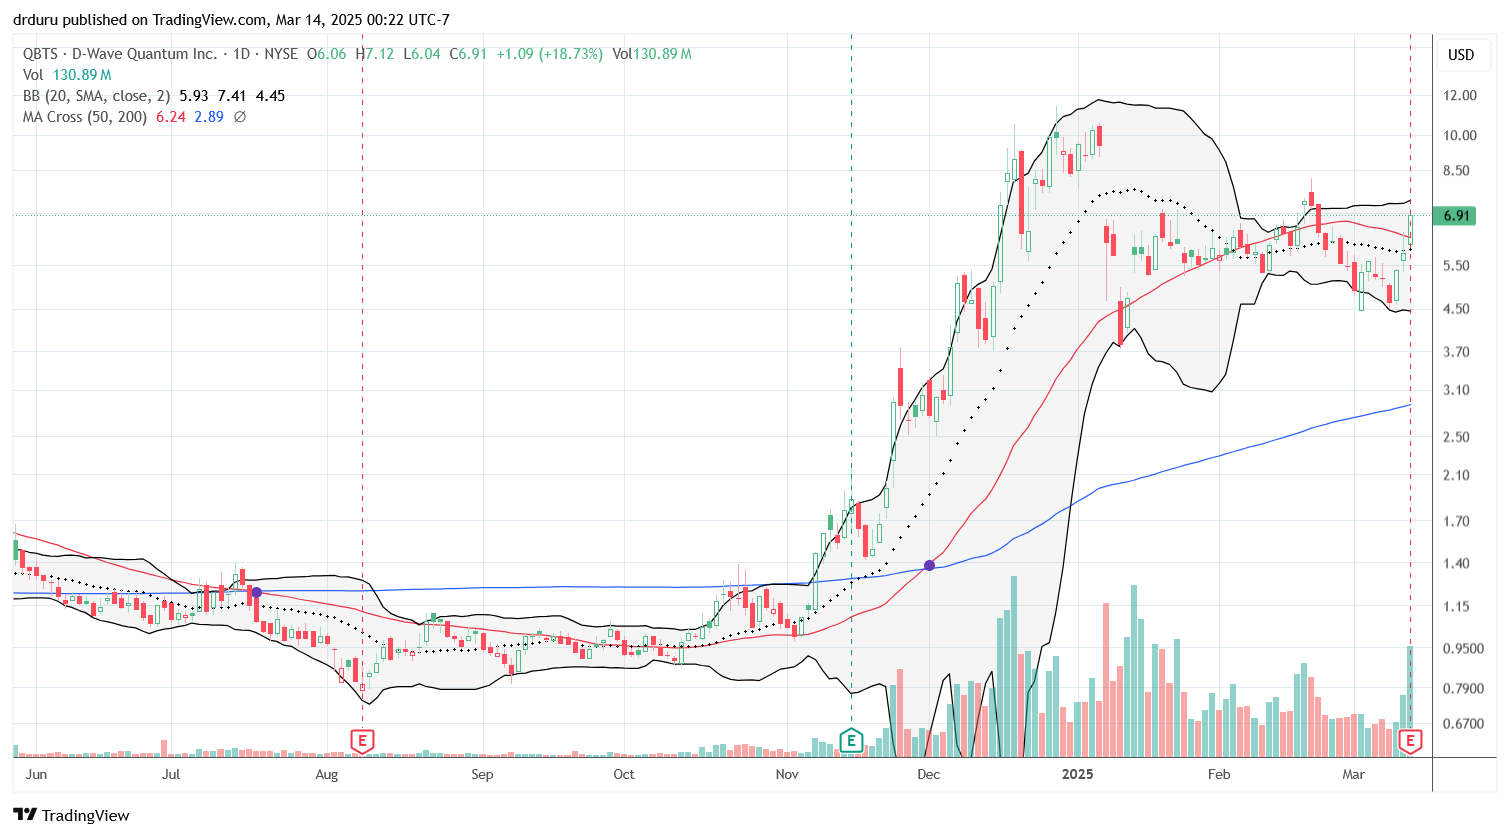
D-Wave Quantum (QBTS) – Defying the bear market.
QBTS held up surprisingly well after earnings, soaring 18.7%. While the stock remains highly speculative, it is showing resilience that few others have managed in this market.
Gold (GLD) – A rare bright spot in the market.
While the equity market struggles, GLD has broken out to new all-time highs. This confirms rising uncertainty and risk-off sentiment, as traders and investors look for safer assets.
Other Stocks of Interest:
- Royal Caribbean (RCL) – Still above its 200-day moving average. RCL is one of the few stocks still maintaining a bullish technical position, but facing increasing pressure.
- Mercury Systems (MRCY) – Holding up after an upgrade. MRCY bounced 7.1% on an upgrade, making it one of the few names showing relative strength.
")
")
Be careful out there!
Footnotes
Subscribe for free to get email notifications of future posts!
“Above the 50” (AT50) uses the percentage of stocks trading above their respective 50-day moving averages (DMAs) to measure breadth in the stock market. Breadth defines the distribution of participation in a rally or sell-off. As a result, AT50 identifies extremes in market sentiment that are likely to reverse. Above the 50 is my alternative name for “MMFI” which is a symbol TradingView.com and other chart vendors use for this breadth indicator. Learn more about AT50 on my Market Breadth Resource Page. AT200, or MMTH, measures the percentage of stocks trading above their respective 200DMAs.
Active AT50 (MMFI) periods: Day #312 over 20% (overperiod), Day #4 under 30% (underperiod), Day #9 under 40%, Day #21 under 50%, Day #48 under 60%, Day #149 under 70%
Source for charts unless otherwise noted: TradingView.com
Full disclosure: long SPY, long QQQ calls, long MRCY, long ITB, long INTC, lomg AMZN, long GLD shares and call spread
FOLLOW Dr. Duru’s commentary on financial markets via StockTwits, BlueSky, and even Instagram!
*Charting notes: Stock prices are not adjusted for dividends. Candlestick charts use hollow bodies: open candles indicate a close higher than the open, filled candles indicate an open higher than the close.
1 thought on “In A Bear Market There Is NO SUPPORT! – The Market Breadth”