Stock Market Commentary
Bears still look ready to bow out, but they still have their paws firmly planted on high-tech stocks, especially semiconductors. The market rotations out of tech are nudging enough stocks higher, especially small caps, to rechallenge the threshold defining overbought conditions for market breadth. The stark divergence in stocks greatly reduces the usefulness of broad characterizations of the stock market; the current stock market is both bearish and bullish at the same time. For example, last week’s strong reading on the economy sent the S&P 500 and the NASDAQ deeper into breakdowns while small caps found fresh motivation. In other words, market rotations form the start of understanding the market’s current dynamics…and presents the latest challenge to the AT50 trading rules on market breadth.
The Stock Market Indices
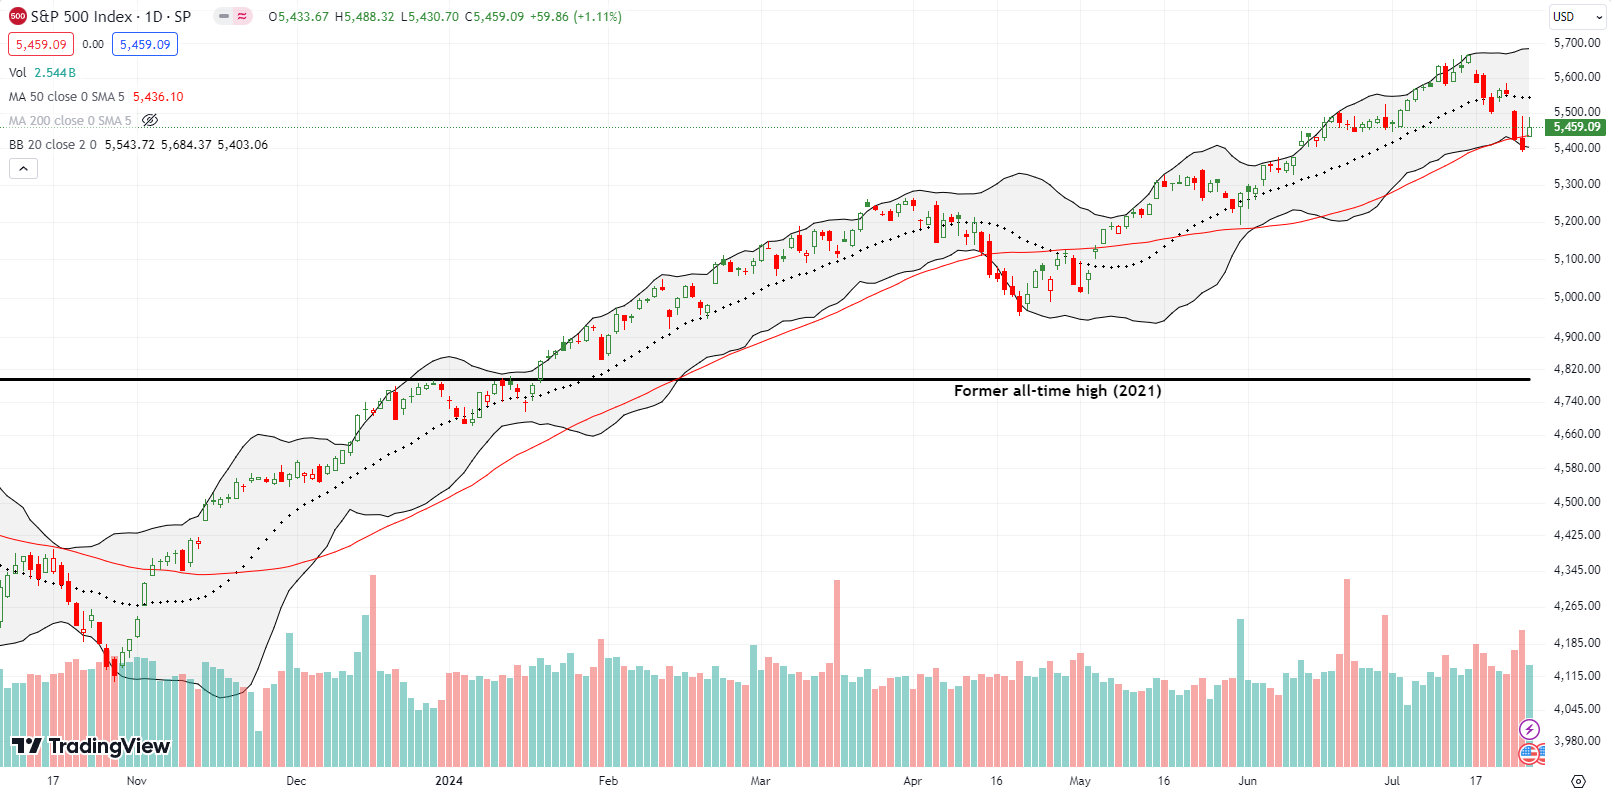
The S&P 500 (SPY) failed to hold support at its 20-day moving average (DMA) (the dotted line below) after falling 2.3% on Wednesday. The index closed right on top of 50DMA support (the red line below) and ended what CNBC reported as the longest streak of trading days without a 2% or worse loss since before the Great Financial Crisis (GFC). Ironically, that very record motivated me to take profits on my SPY put options once the decline reached 1.5%; I figured that was about as far as sellers could go. The S&P 500 returned to bear-fighting form by rebounding on Friday from a 50DMA breakdown. The index has now closed below its 20DMA for 4 out of the last 6 days. This count is notable. Prior to this episode, the index only closed below its 20DMA THREE times after the November breakout, excluding the April sell-off.
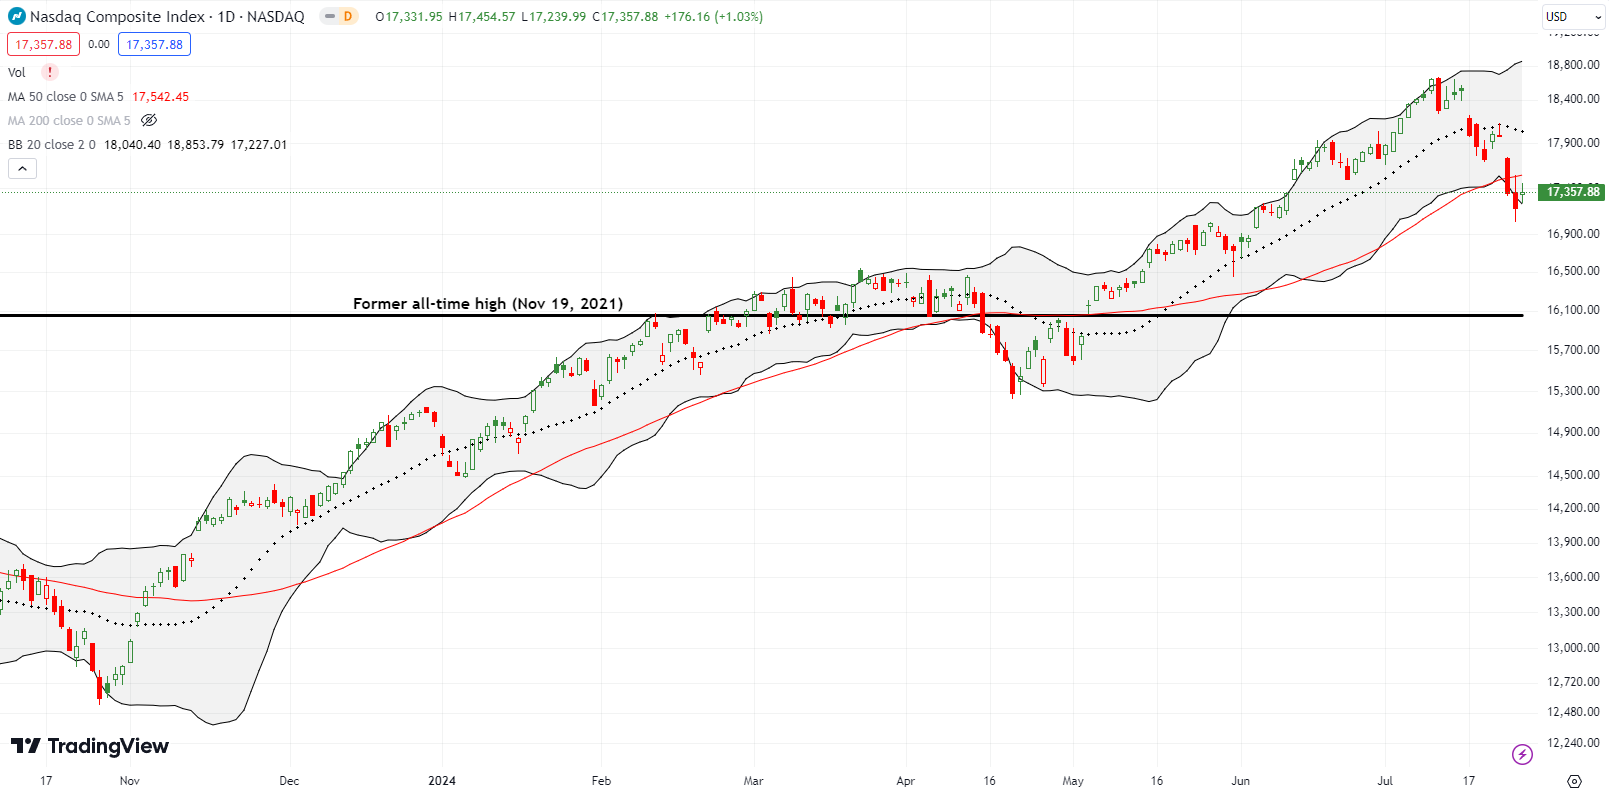
The bears are keeping their paws planted on the NASDAQ (COMPQ). Thursday’s loss confirmed a 50DMA breakdown that started with what CNBC described as the tech laden index’s worst one-day loss since October, 2022. Yet, I did not chase the bears downward. At the same time, the volatility index spiked above its highest close of the year which in turn made me inclined to look for buying opportunities. Friday’s 11% plunge in the VIX validated my doubts about the staying power of market fears. Still, the NASDAQ looks topped out and broken down, so going long QQQ feels like a stretch!
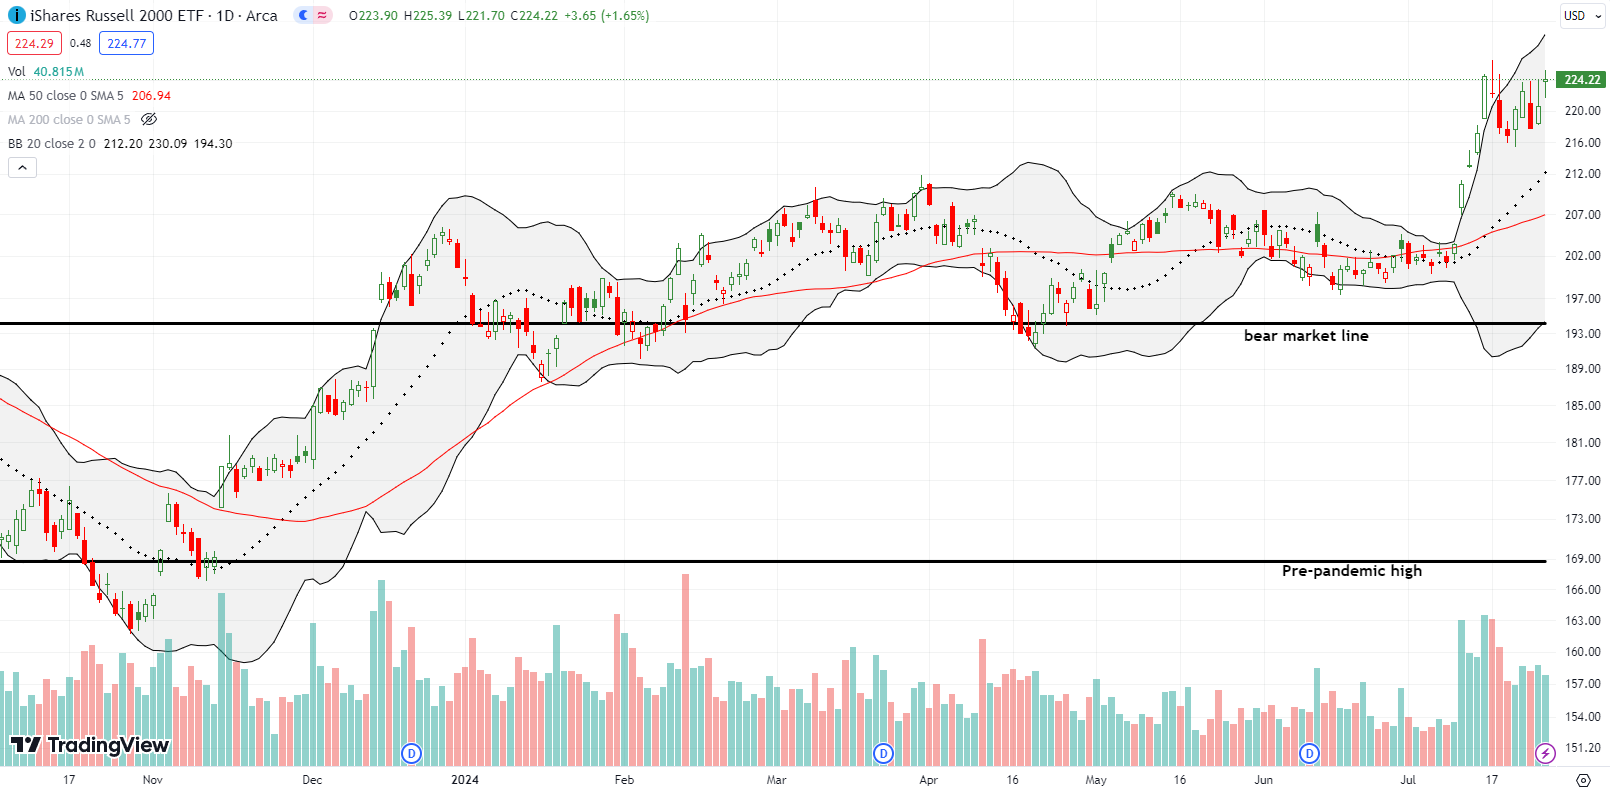
The iShares Russell 2000 ETF (IWM) fell with the other indices on Wednesday. Unlike the other indices, the ETF of small caps did not break down. Instead, IWM held its current trading range of churn. IWM proceeded to outperform on Thursday by gaining 1.3% despite a fade from the top of the trading range. Friday’s 1.7% gain took IWM right to the edge of its high of the year. IWM looks ready to break out to resume a bullish journey fueled by market rotations. I complemented my IWM call options with shares.
The Short-Term Trading Call With Market Rotations
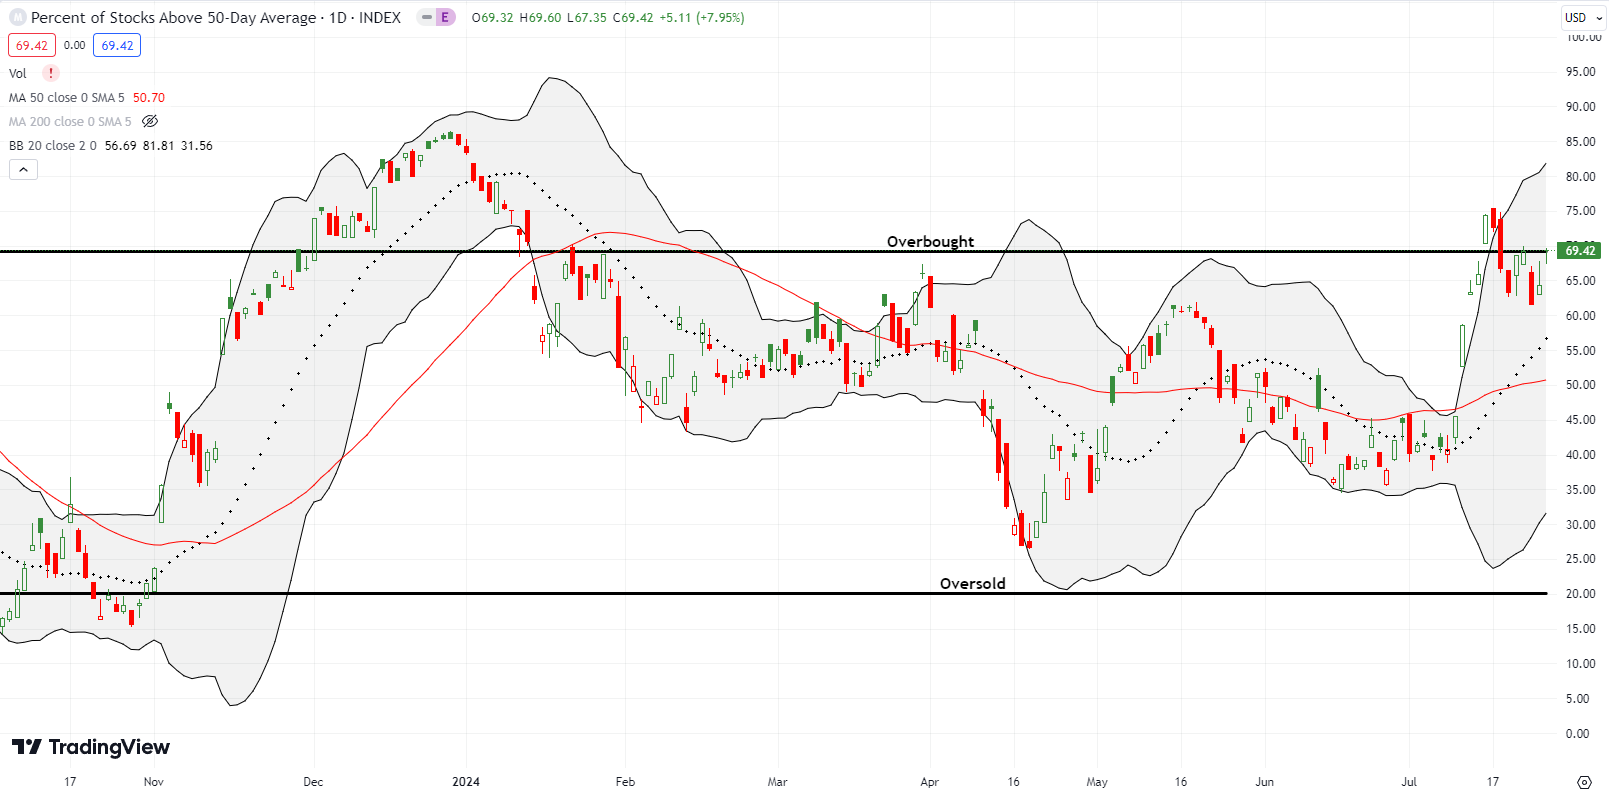
- AT50 (MMFI) = 69.4% of stocks are trading above their respective 50-day moving averages
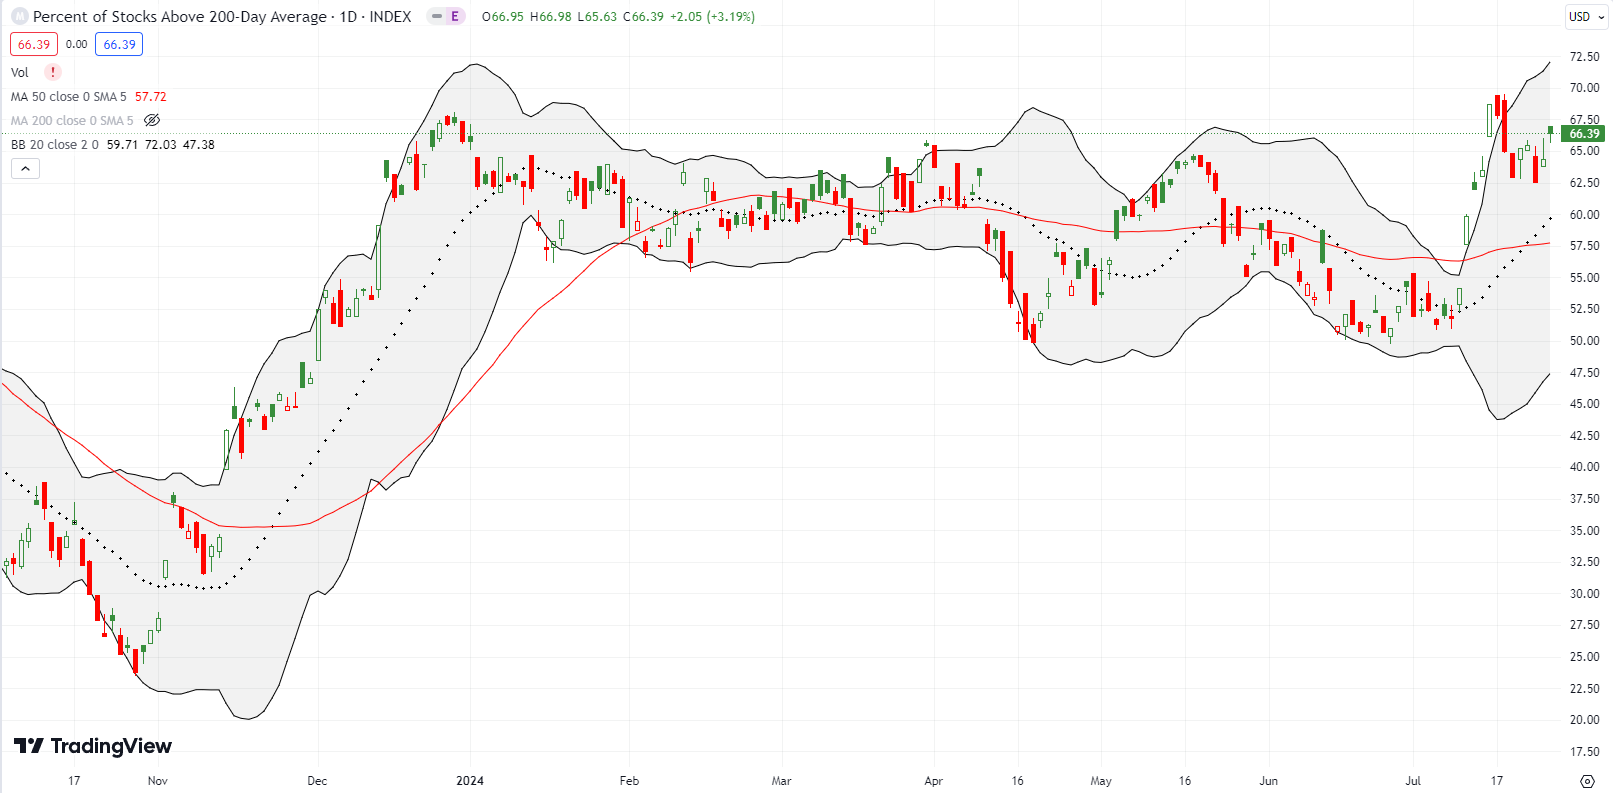
- AT200 (MMTH) = 66.4% of stocks are trading above their respective 200-day moving averages
- Short-term Trading Call: neutral
AT50 (MMFI), the percentage of stocks trading above their respective 50DMAs, ended the week right below the 70% threshold for overbought conditions. Market breadth is benefiting from the market rotations given the sheer number of smaller stocks left behind by the herd piling money into big cap tech for so long: it only takes a fractional diversion of these flows to push the laggards a lot higher.
This fascinating divergence in turn forces me to diverge from my AT50 trading rules by changing the trading call from cautiously bearish to neutral. The rules tell me to stay bearish and hope for another rejection from the overbought threshold to further confirm bearish trading conditions. However, the VIX’s violent shift from over-extended at the year’s closing high and shift into a sharp pullback is bullish trading action. In other words, the market rotations are making trading rules clash! (I will have to study the rare times the VIX surged going into overbought conditions – VIX surges should happen closer to oversold levels).
To accommodate the 2-speed market, I need the flexibility of being bullish small caps while remaining skeptical of big cap tech. The neutral short-term trading call is best suited for the duality that comes from these market rotations. If market breadth flips overbought with this week’s Federal Reserve meeting, I fully anticipate an extended overbought rally…at least for small caps.
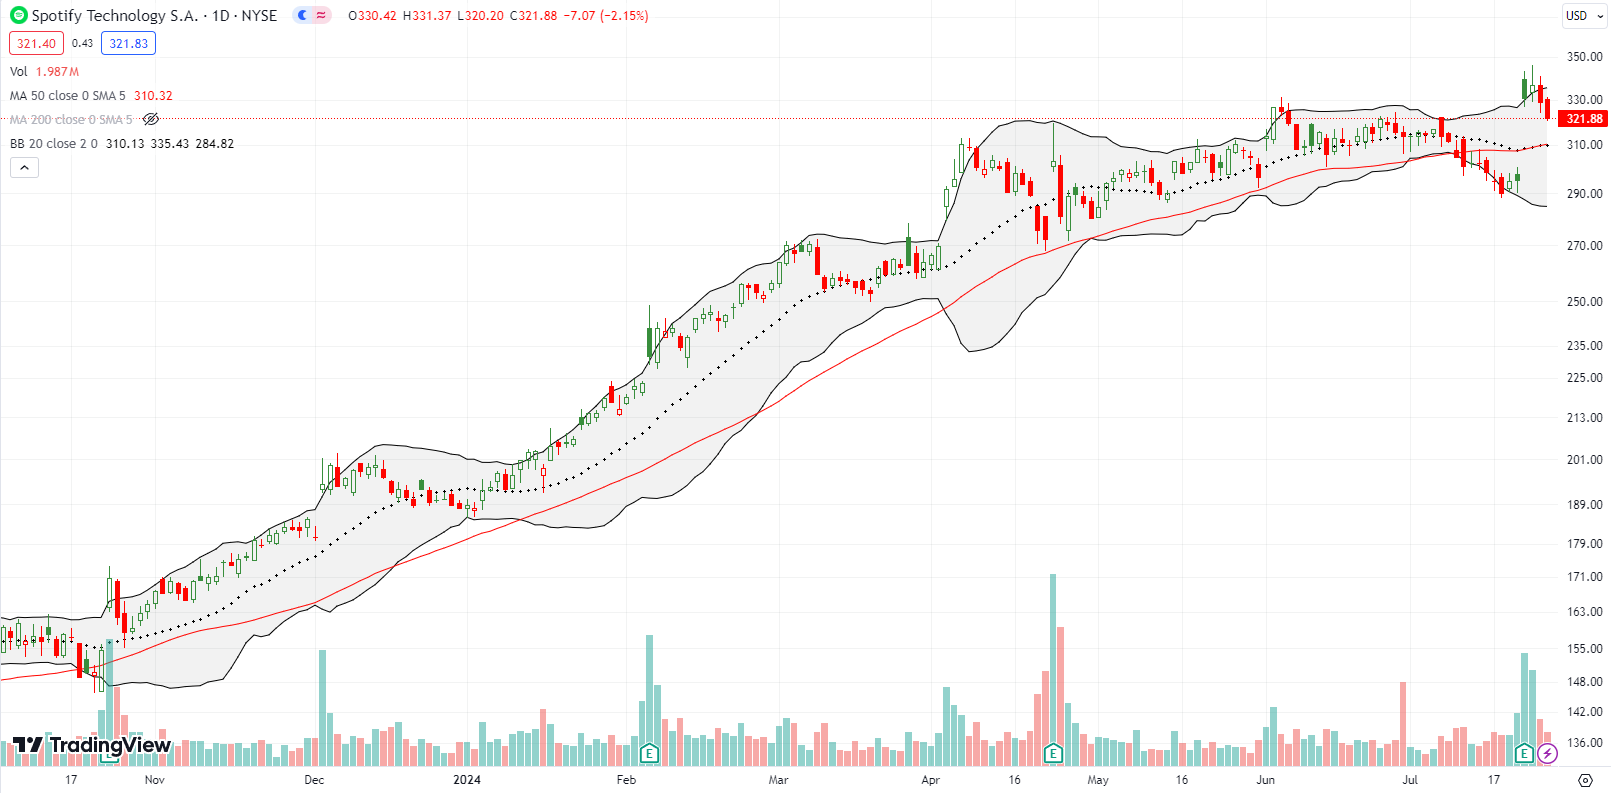
Audio streaming platform Spotify Technology S.A. (SPOT) provides a small example of how earnings can instantly flip a technical outlook. Going into earnings, SPOT looked topped out. A slow and grinding recovery from a post-earnings loss in April ran out of gas in the two weeks going into earnings. A 50DMA breakdown seemed to confirm bearish technicals. Buyers came back with a vengeance with a 12.0% post-earnings surge.
SPOT closed the week below its previous all-time high set in June. Now a fresh test of 50DMA support looks imminent. On the second post-earnings day, Goldman Sachs (GS) upgraded the stock from neutral to buy with a $425 price target. I am surprised traders and investors responded by selling the stock.
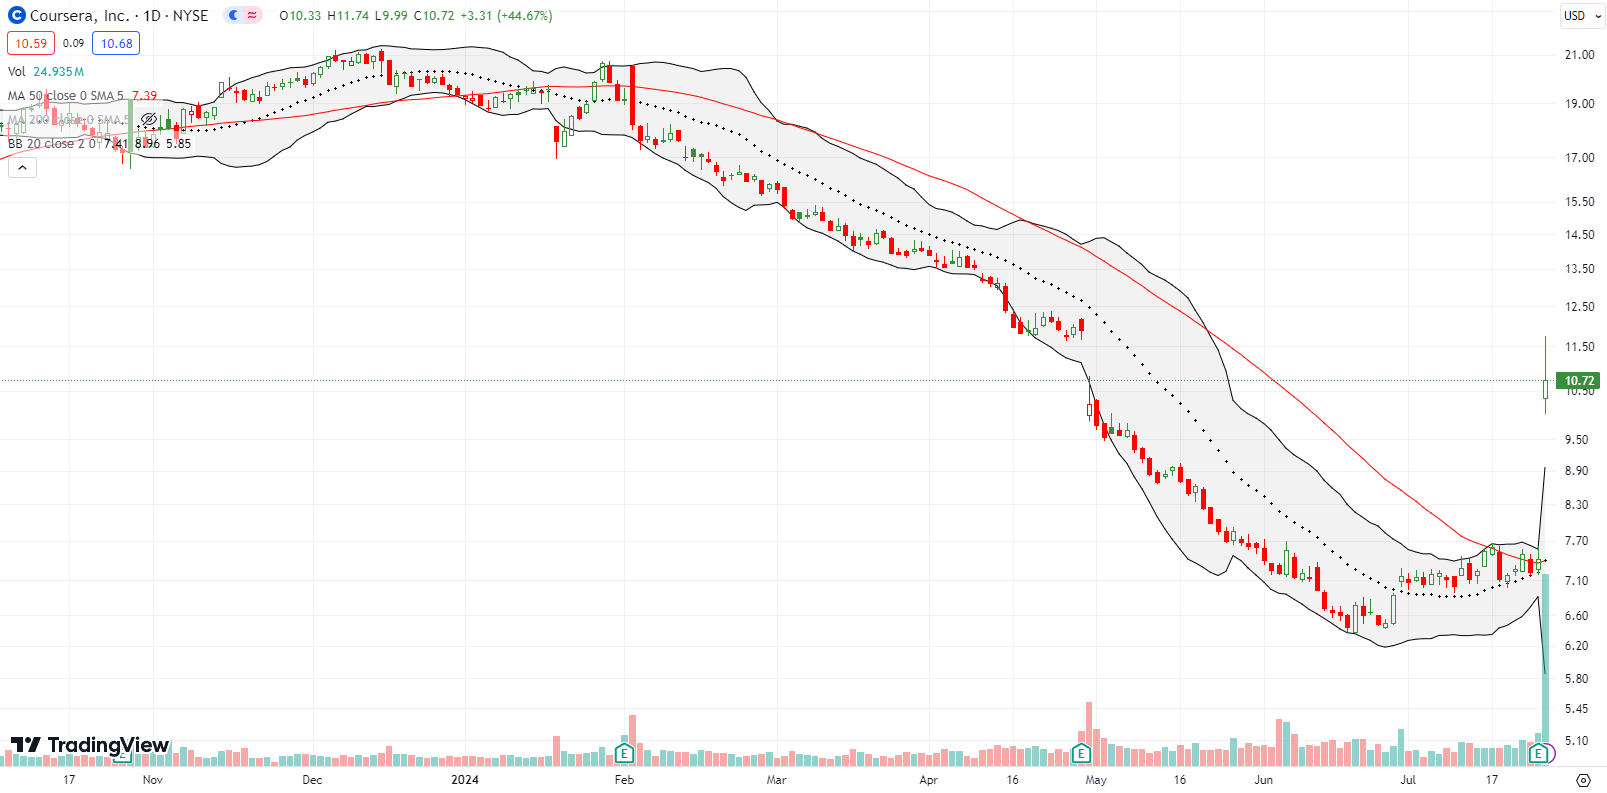
Talk about bullish surprises…on-line learning platform Coursera, Inc (COUR) ran up as much as 58.4% before settling into a 44.7% post-earnings gain. Earlier this year I finally gave up on the on-line learning space and sold almost all of my holdings, including COUR. While I am maintaining a skeptical eye, this price action in COUR motivated me to run back into Chegg, Inc (CHGG) which is in the middle of a 50DMA breakout.
The big news for COUR almost qualifies it for the generative AI basket. From the Seeking Alpha transcript of the earnings conference call:
“Consumer revenue was $97.3 million, up 12% from the prior year on growth in Coursera Plus, driven by ongoing demand for entry-level Professional Certificates and generative AI courses and credentials…
Generative AI can act as both a disruptor and an enabler. Whether it widens or narrows the opportunity gap depends on our ability to make education and skilling equally accessible on a global scale. Leading partners like Microsoft who are creating the next generation of technology, tools, and services that will fundamentally reshape work and the labor market more broadly are embracing their collective responsibility to harness the potential of generative AI, turning it into an engine of opportunity for everyone. We are proud of Coursera’s role and especially our partners who we work with in recognizing the importance of turning this threat into an opportunity through education.”
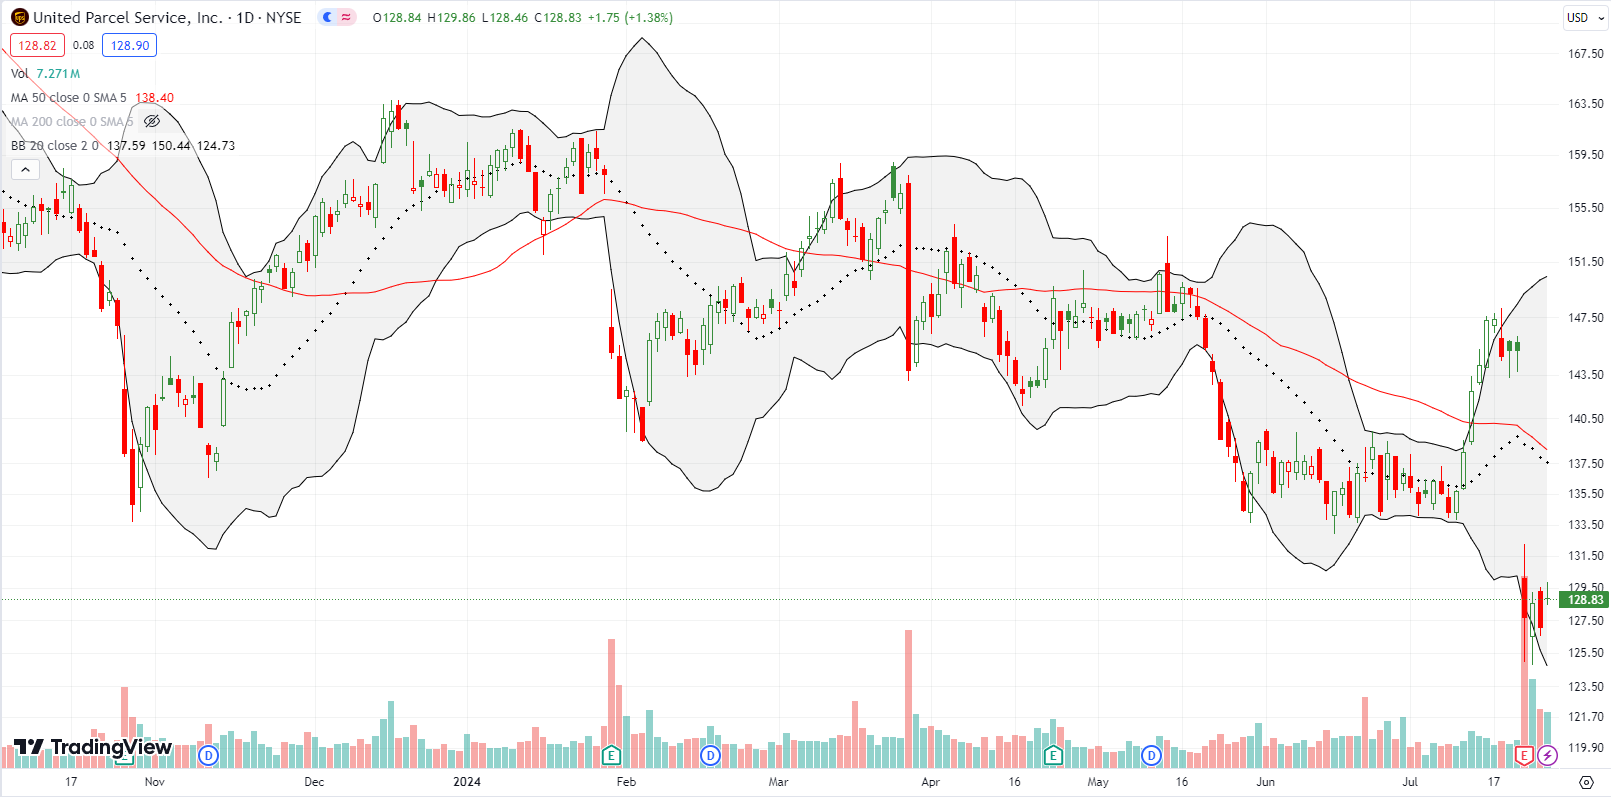
The bears have a firm grip on United Parcel Service, Inc (UPS). UPS fell 12.1% post-earnings and dropped to a new 4-year low. Given the retail push into e-commerce, UPS’s woes should be a tell for trouble with consumers. Yet, UPS has been in a choppy downtrend since its all-time high in February, 2022. In fact, a multi-year look at UPS reveals an underperforming stock that had a brief revival in the wake of the pandemic. Prior to the pandemic, UPS went absolutely nowhere for 6+ years. In other words, UPS is returning to its norm with last week’s overdue close below its pre-pandemic all-time high. I am wondering how I failed to see this reversion until now.
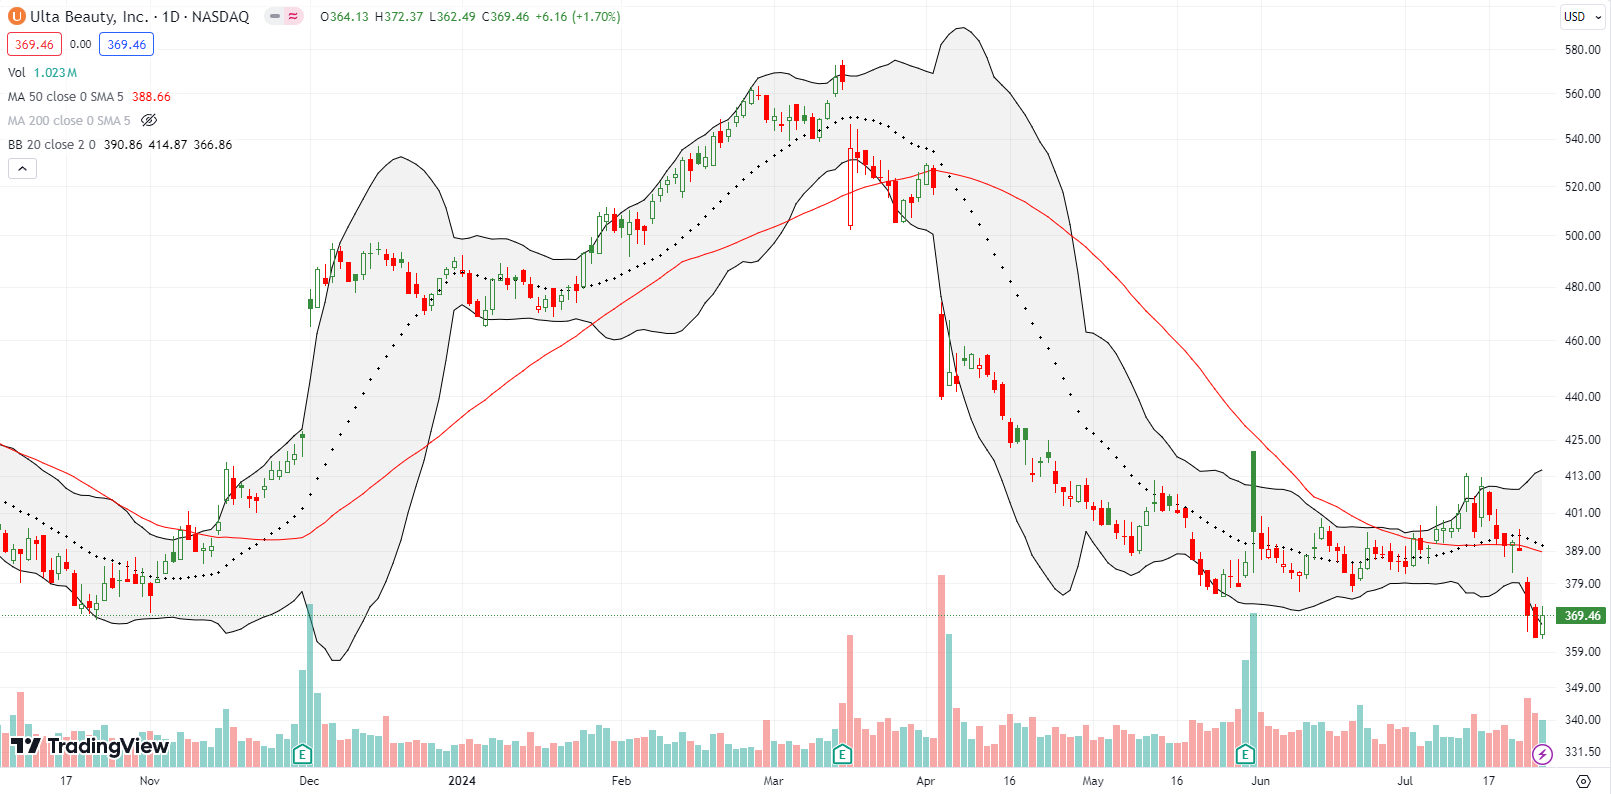
The shine is wearing off Ulta Beauty, Inc (ULTA). ULTA dropped 5.1% on the heels of an analyst downgrade to neutral. The 2-year low further confirms a double-top with peaks in 2023 and 2024. The loss also brought a promising 50DMA breakout to an abrupt end.
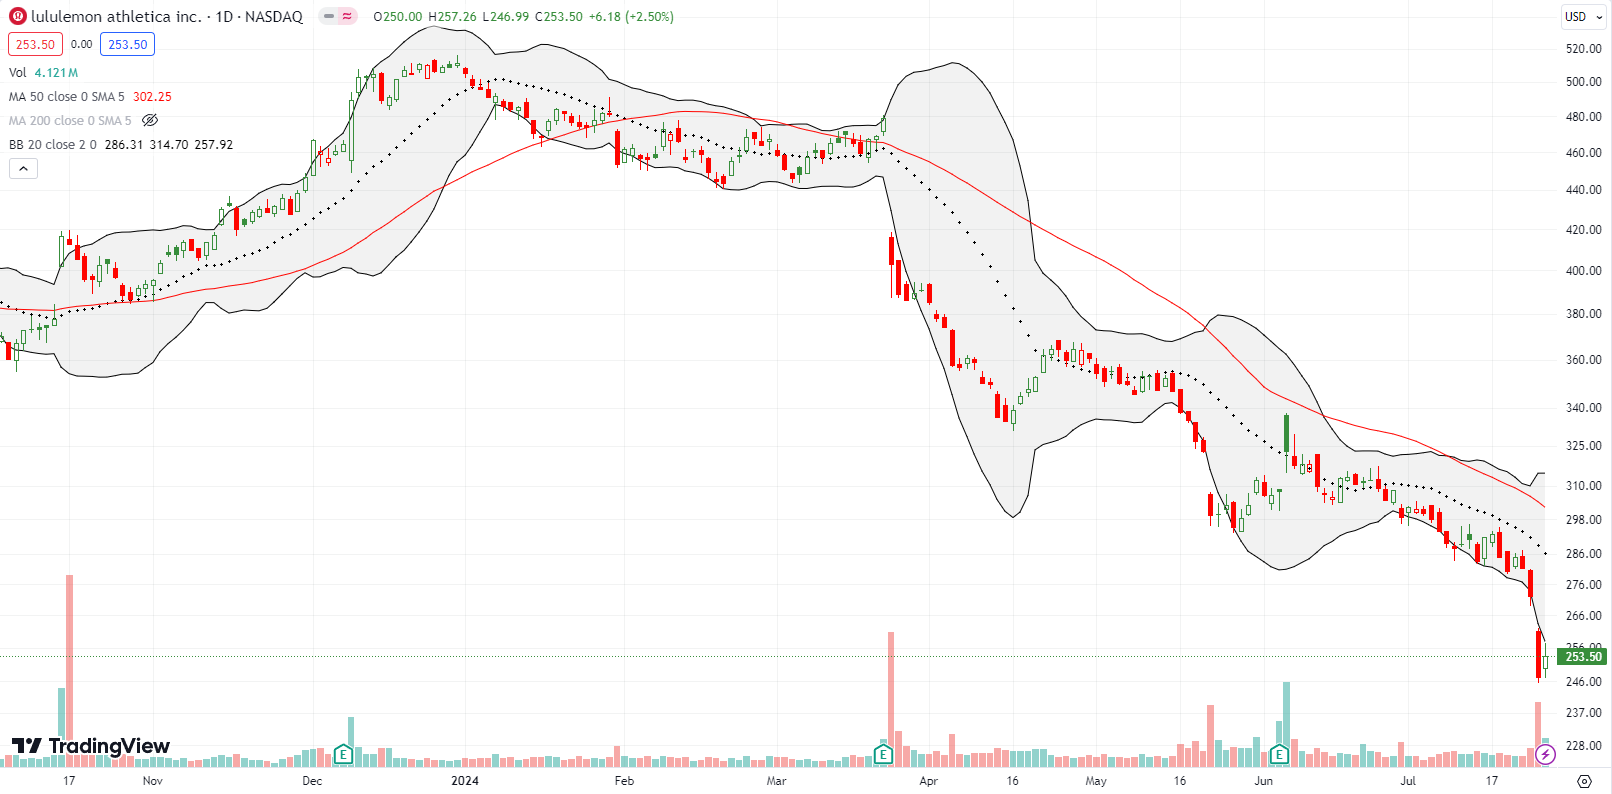
Athleisure retail company lululemon athletica Inc (LULU) is also losing its shine. The expensive retail stock made a marginal all-time high in late 2023 to early 2024 and has slipped downhill ever since. Another big post-earnings loss took LULU to a 4-year low. The stock now looks like it is in danger of breaking below what is now effectively a wide 4-year trading range.
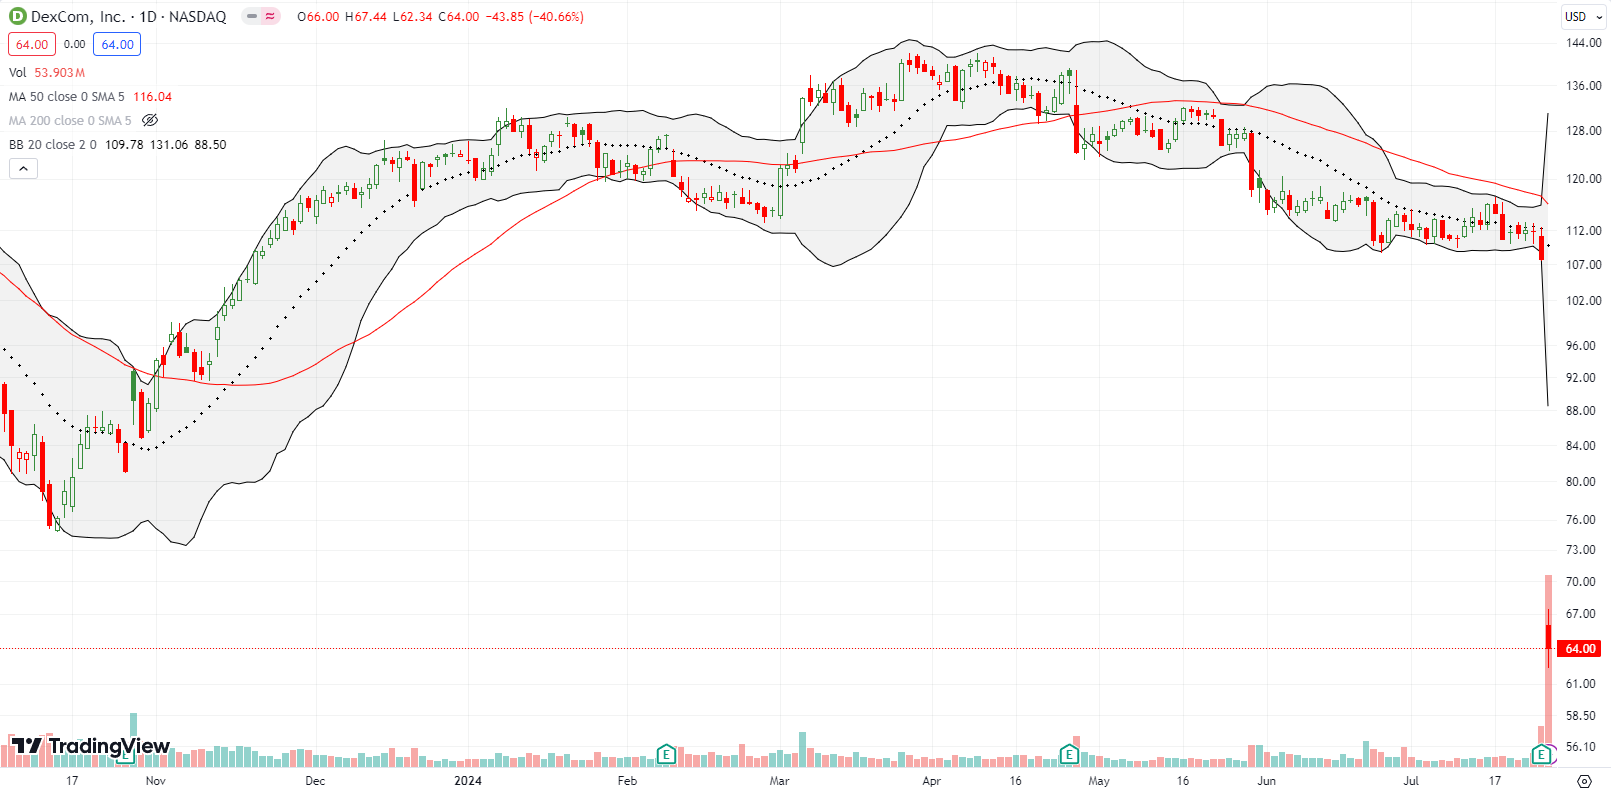
DexCom, Inc (DXCM) was the shocker of the week. The maker of continuous glucose monitoring (CGM) systems seemed doomed with the rising popularity of GLP-1 drugs that are miraculously curing people of obesity. Yet, the stock obliviously motored along. While it seems the prospects of fewer customers was not the cause of this abrupt collapse, I do not see a buying opportunity here except as the most speculative of trades.
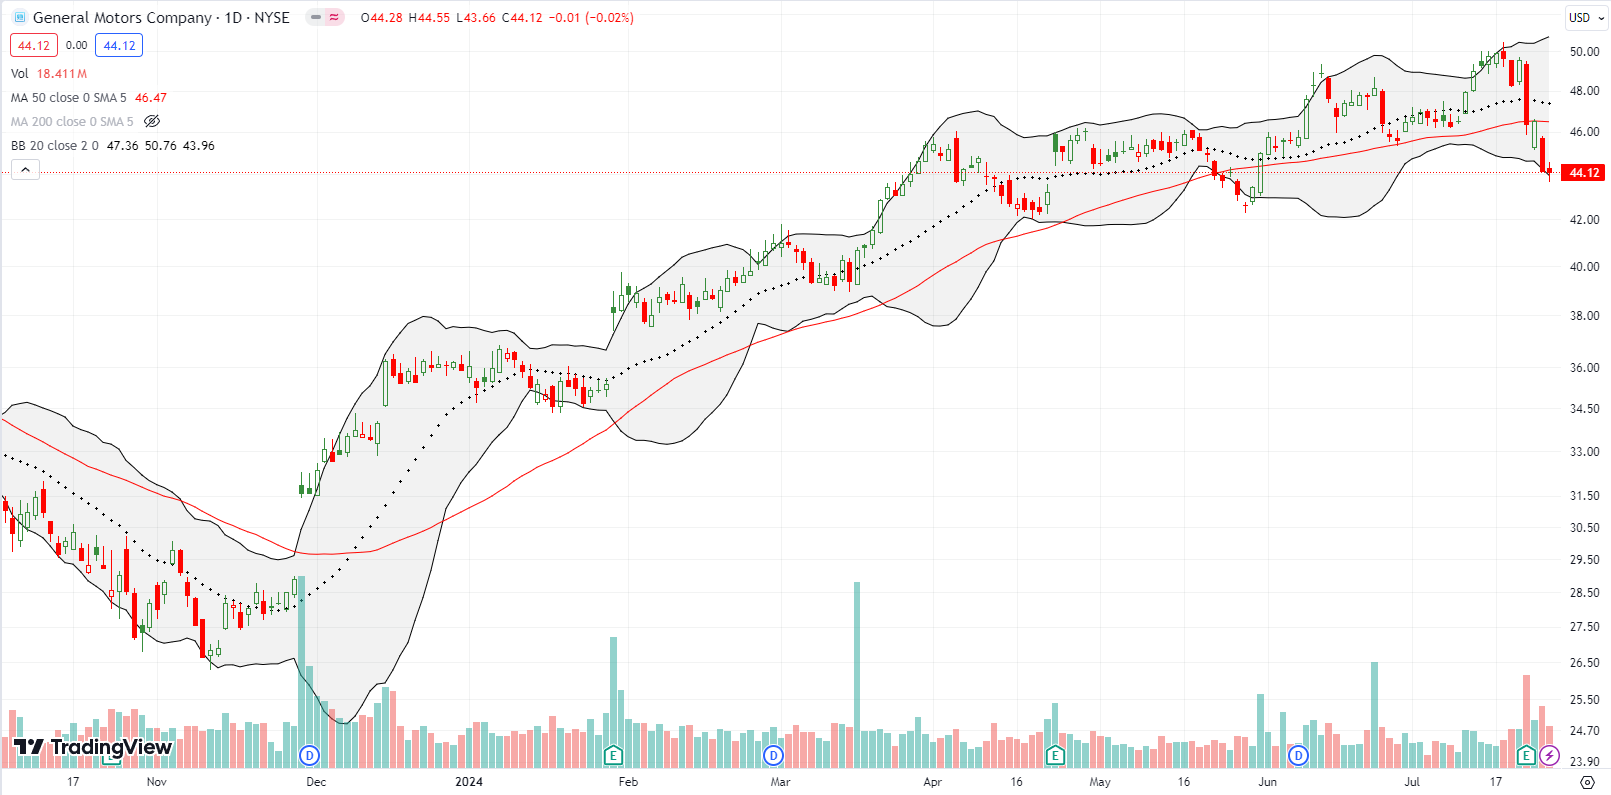
I recently took profits in General Motors Company (GM). I bought the stock as a contrarian play against the market’s focus on big cap tech and doubts that GM could succeed in EVs. Last week, the momentum turned downward with a 6.4% post-earnings loss followed by a confirmed 50DMA breakdown. A close below the May lows would confirm a bearish turn for the worse.
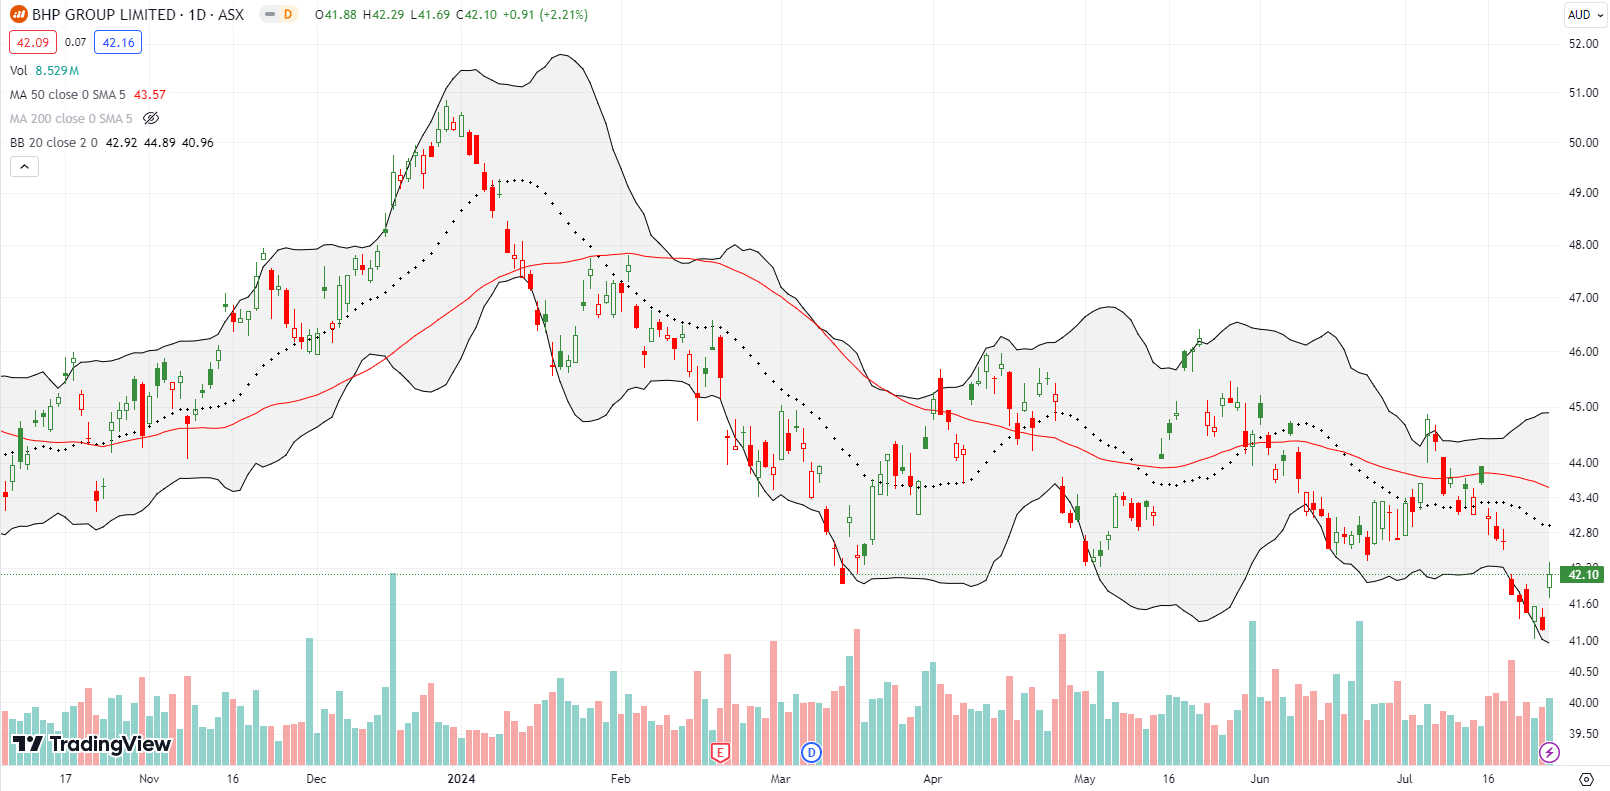
With rate cuts imminent from the Federal Reserve, I expected commodities to rally. Instead, China’s economic troubles seem to loom larger over the sector. Diversified commodities giant and iron ore producer BHP Group Limited (BHP) last week dropped to an 8-month low before Friday’s small rebound. I went ahead and bought August call options assuming there is a sufficient chance that BHP will continue to bounce toward the top of its recent trading range if not higher.
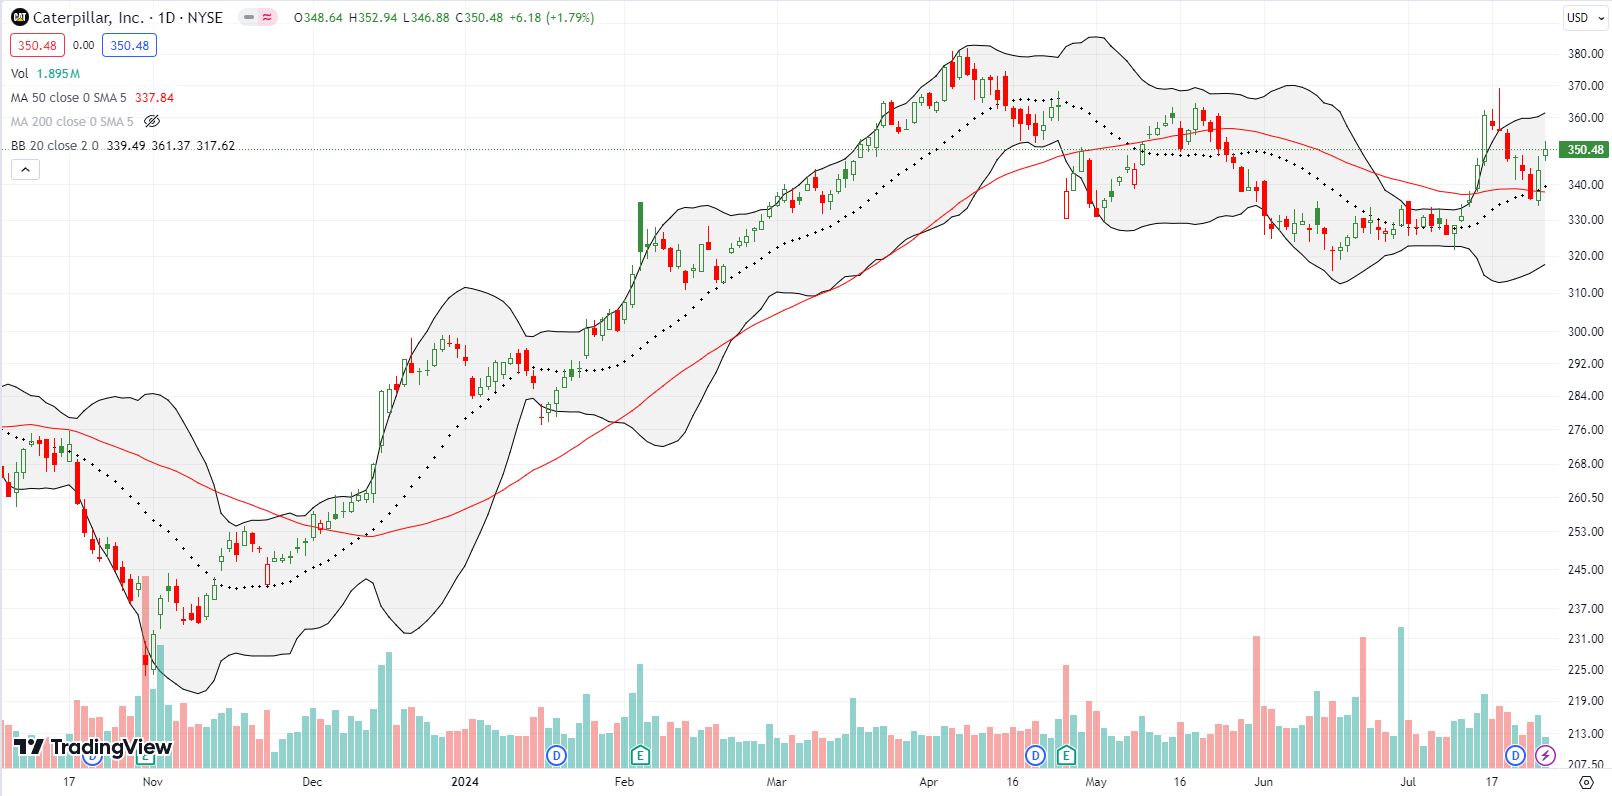
Caterpillar, Inc (CAT) looked ready for a 50DMA breakdown on Wednesday. I promptly bought a put spread only to get caught by a sharp rebound.
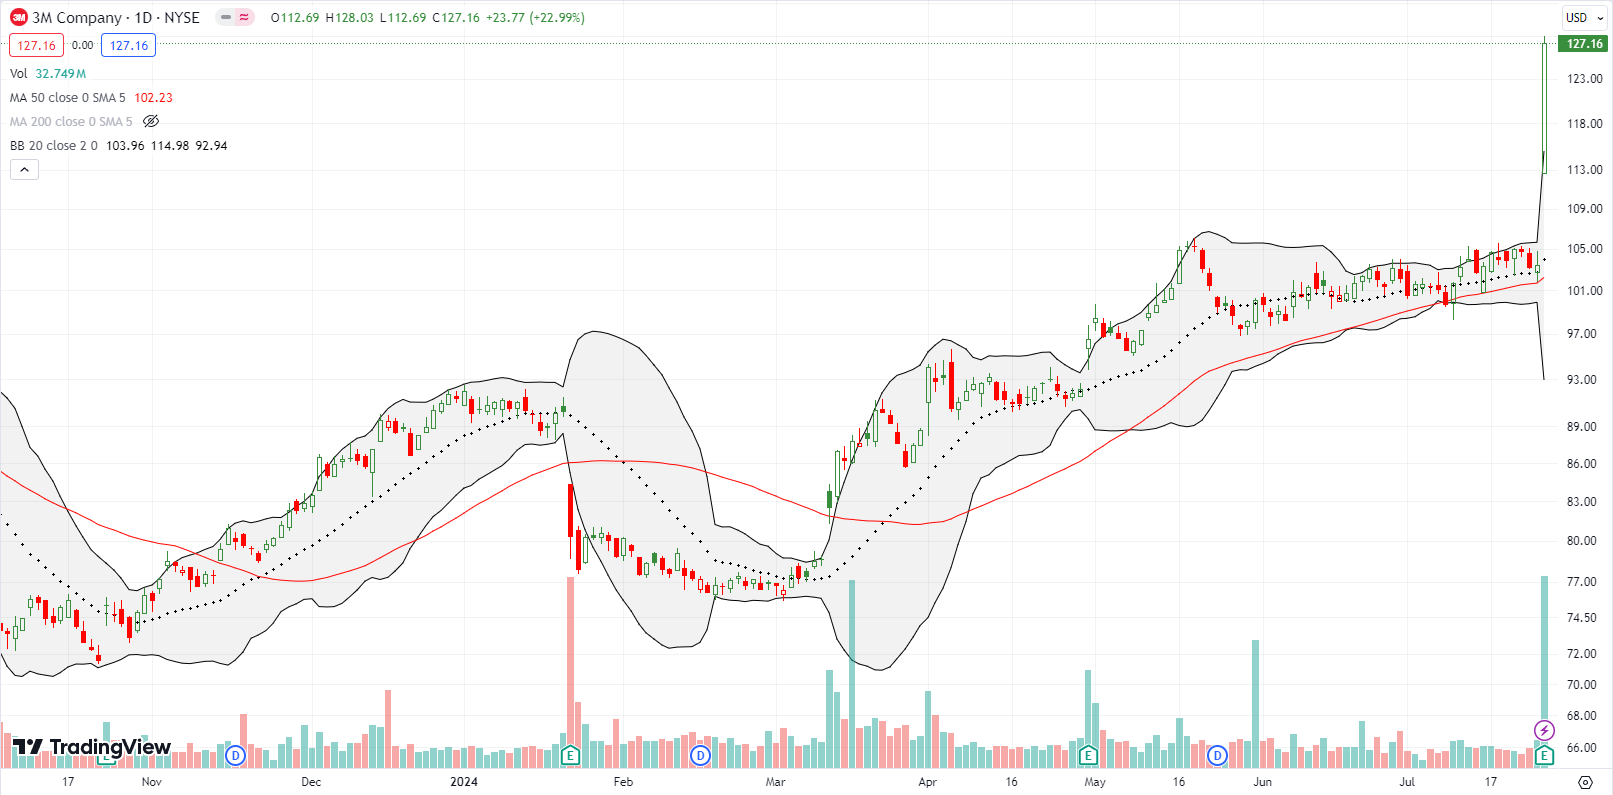
3M Company (MMM) delivered a pleasant surprise. I bought MMM as a contrarian “value” play. Yet, MMM surprisingly continued to sink like a tech stock from the 2021 peak to last year’s bottom. MMM was not contrarian and the value reached bargain basement levels.. So I was quiet relieved and pleased to see MMM soar 22% post-earnings and print a 2-year high. This move is extreme (largest one-day gain ever for MMM!), so I fully expect some cooling and retracement before the stock moves higher again. MMM is looking good with a new CEO who seems ready to actively manage street expectations with under-promising and over-delivering.
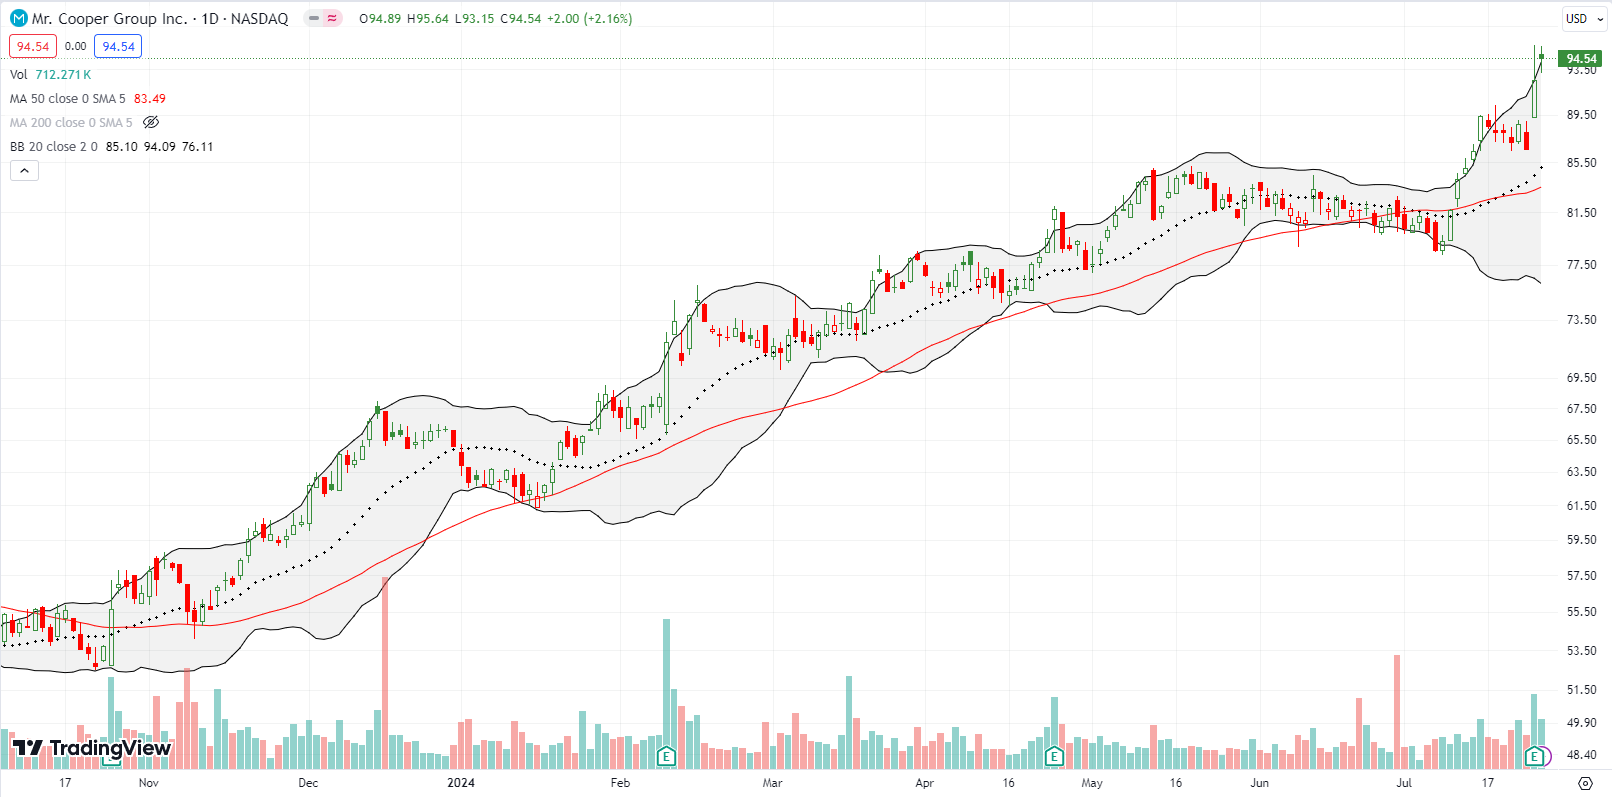
Mr. Cooper Group Inc (COOP) is a non-bank servicer of residential mortgage loans. You might think that the housing market is in a major bull market looking at the stock trend higher all year. COOP hit a fresh all-time high after last week’s earnings. The stock looks like a buy on the dips until proven otherwise.
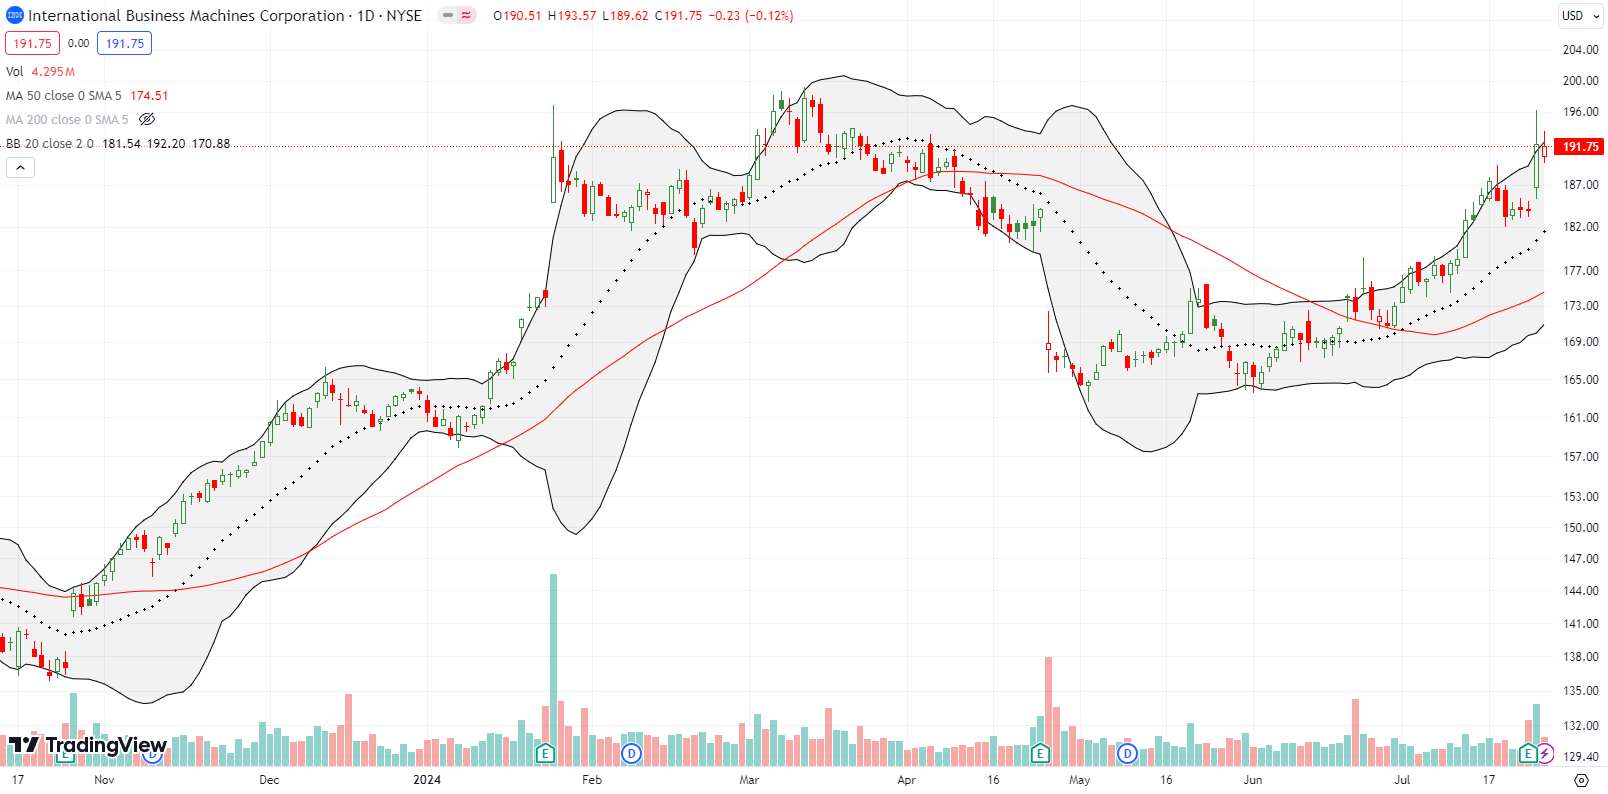
International Business Machines Corporation (IBM) has had one seesaw journey so far this year. Post-earnings excitement in January retreated into post-earnings blues in April. A grinding recovery culminated in last week’s 4.3% post-earnings gain and a close near the highs of the year.
I do not know what to make of this old school tech stock. IBM sits in its own category since it is not part of the growth big cap tech stocks that have vacuumed up so much money. Yet, IBM is also not a small cap stock that was previously left for dead. IBM is somewhere in the middle: a stock that still needs to prove itself with a breakout to a new high for 2024. Note that the current high stopped just short of the all-time high set way back in 2013…
Be careful out there!
Footnotes
Subscribe for free to get email notifications of future posts!
“Above the 50” (AT50) uses the percentage of stocks trading above their respective 50-day moving averages (DMAs) to measure breadth in the stock market. Breadth defines the distribution of participation in a rally or sell-off. As a result, AT50 identifies extremes in market sentiment that are likely to reverse. Above the 50 is my alternative name for “MMFI” which is a symbol TradingView.com and other chart vendors use for this breadth indicator. Learn more about AT50 on my Market Breadth Resource Page. AT200, or MMTH, measures the percentage of stocks trading above their respective 200DMAs.
Active AT50 (MMFI) periods: Day #169 over 20%, Day #68 over 30%, Day #15 over 40%, Day #12 over 50%, Day #11 over 60% (overperiod), Day #7 under 70% (underperiod)
Source for charts unless otherwise noted: TradingView.com
Full disclosure: long SPY put spread and shares, long QQQ calendar call spread, long MMM, long SVXY calls, long CAT put spread, long BHP calls, long CHGG; long IWM call spread, calls, and shares
FOLLOW Dr. Duru’s commentary on financial markets via StockTwits, Twitter, and even Instagram!
*Charting notes: Stock prices are not adjusted for dividends. Candlestick charts use hollow bodies: open candles indicate a close higher than the open, filled candles indicate an open higher than the close.


“Goldman Sachs (GS) upgraded the stock from neutral to buy with a $425 price target. I am surprised traders and investors responded by selling the stock.”
About 20 years ago a very successful day-trader told me to view GS upgrades as sell signals sent to GS’s traders and deepest-pocketed clients. Since then, I’ve occasionally gotten wind of a GS upgrade when I had a moment to glance at the relevant chart. He was right.
=-=-=-=-=
COOP: perhaps COOP will benefit from the increase in mortgage business that will happen in late 2024 and through 2025 as the Fed lowers the FF rate?
Yeah! Trading around analyst ratings are tricky, especially from the big firms because you always have to suspect an attempt to push the market for their own short-term purpose.
If COOP is rallying on rate cuts, it has been doing some significant and sustained pull-forward on the future!