
Stock Market Commentary
A plunge in market breadth on Wednesday made me expect a more bearish take on the markets for my next blog post. A sharp rebound led by strong earnings from various retail companies, quickly changed the narrative from a continued NVDA hangover to a bullish divergence and then a bullish setup. Friday’s PCE (personal consumption expenditures) reading met “expectations” and helped keep market hopes alive for an eventual rate cut.
Some time has passed since I advised “be ready so you don’t have to get ready” about the stock market. Seeing more evidence that World War Three is already well underway brought back my adage to the forefront. News headlines started with European leaders demanding Ukraine get permission to drop Western-supplied weapons onto Russian soil. This kind of incendiary rhetoric is classic escalation material. So I am not surprised to see Russia’s dictator, uh President, warn of an escalating war after the U.S. acquiesced to the calls to expand Ukraine’s strike range. Also in classic fashion, this complacent stock market skipped happily along using the strength in retail earnings as a covering for its ears. I am now making sure to have some collection of put options and shorts every week as a partial hedge… (starting with Caterpillar (CAT) of course).
The Stock Market Indices
The S&P 500 (SPY) confirmed the latest topping pattern (a bearish engulfing pattern) by meandering into its 20-day moving average (DMA) (the dash line below). However, the very next day the index turned around and made a powerful statement by bouncing sharply off 50DMA support (the red line below). The move was strong enough to make the 20DMA look like firm support. Also note that a Bollinger Band (BB) squeeze is forming (the black lines converging onto the price action from the top and bottom). This pattern often transitions the price action from a tranquil period to a breakout or breakdown. Since my short-term trading call is bullish, I happened to buy a fresh weekly SPY call spread at 50DMA support.
")
The NASDAQ (COMPQ) sliced through 20DMA support only to quickly rebound. The tech-laden index did not reach its 50DMA, but the rebound may have sufficiently swept away enough selling pressure to fuel a new push higher. I go into the week with the long side of a QQQ vertical spread. With a $465 strike, the position is a long shot.
")
The iShares Russell 2000 ETF (IWM) made two dramatic reversals for the week. On Wednesday, the ETF of small cap stocks cracked 50DMA support. The very next day, IWM rebounded above its 50DMA. This move made Friday’s bounce off 50DMA support look more meaningful. Still, IWM seems to be trapped in a new period of churn. I flipped IWM calls and did not hold any for the coming week.
")
The Short-Term Trading Call With A Hangover Save
- AT50 (MMFI) = 51.7% of stocks are trading above their respective 50-day moving averages
- AT200 (MMTH) = 58.8% of stocks are trading above their respective 200-day moving averages
- Short-term Trading Call: cautiously bullish
AT50 (MMFI), the percentage of stocks trading above their respective 50DMAs, closed the week at 51.7%. This flat close for the week belied some volatile action – even the volatility index (VIX) swung wildly within a net flat week. My favorite technical indicator fell to 41.8% on Wednesday in a confirmation of an NVDA hangover. I was sure that this weakening market breadth would force me to downgrade the short-term trading call to neutral. Yet, AT50 rebounded the next day and created a telling bullish divergence with the S&P 500. Friday’s follow-through completed the roundtrip for the week. Still, per my wariness over the escalation of the war in Ukraine, I highly emphasize the “cautiously” part of my short-term trading call.
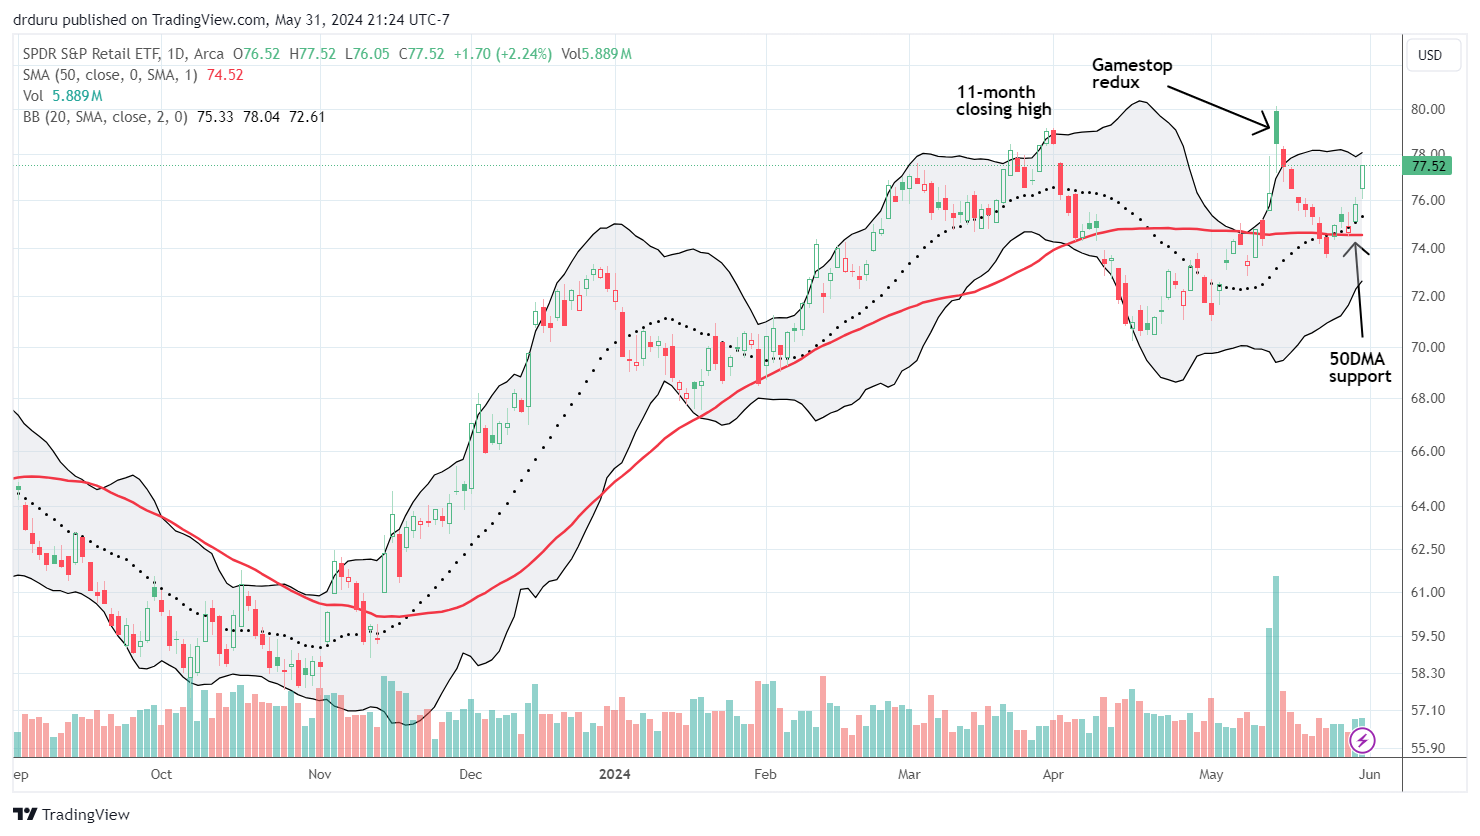
Retail stocks helped to escort AT50 higher those last two days. The SPDR S&P Retail ETF perfectly tested 50DMA support on Wednesday and confirmed support with the two days of subsequent buying. Strong earnings from a multitude of retailers helped push XRT higher.
Best Buy Co, Inc (BBY) was one of several retailers receiving surprisingly strong post-earnings approval as a part of saving the market from the NVDA hangover. BBY gained 13% post-earnings and followed-up with another 4.0% gain. The electronics retailer finished the week with a 10-month high that essentially taunts growing expectations for imminent consumer weakness. BBY occupies a 1.3% share of XRT (XRT is well-distributed with the largest component owning a 1.9% share of the ETF).
")
Burlington Stores, Inc (BURL) also sits on a 1.3% share of XRT. The big box discount retailer delivered a stunning post-earnings reversal from the bearish 50DMA breakdown I pointed out in April. BURL confirmed a 50DMA breakout with a 17% surge and a 2-year high. The company gave guidance higher than expectations.
")
Dell Technologies Inc (DELL) was one of the few sustained beneficiaries of NVDA’s big post-earnings surge. The stock nearly went parabolic to an all-time high going into earnings. A 17% post-earnings plunge ended the fairytale run and created the impression that the NVDA hangover is a tech-specific effect. DELL remains in my (updated) basket for the generative AI trade, but I completely whiffed on buying back in at the test of 50DMA support.
I also whiffed on a pre-earnings diagonal calendar spread similar to what worked for an NVDA pre-earnings play. This time around DELL’s near parabolic move drove the stock right to the top of my configuration. The 5.2% pullback ahead of earnings was a red flag and looked like the beginning of a classic cooling from a parabolic move. In retrospect, I should have taken profits on the long side on EITHER of those days and risked holding the short side of the position. Another lesson learned!
")
Advanced Micro Devices Inc (AMD) churned most of the week just above its 50DMA. While I missed DELL’s rebound off 50DMA support, I hopped into a call spread in AMD right at the 50DMA. As a reminder, AMD is part of the generative AI basket, so I give myself license to trade it aggressively. I bought a June monthly call spread to give some time for this churn to resolve to the upside.
")
SPDR Gold Trust (GLD) pulled back quickly from setting a new all-time high in May. I jumped into a June monthly call spread between the 20DMA and 50DMA. Friday’s close right on top of 50DMA support makes the trading position look precarious. A confirmed 50DMA breakdown would raise the specter of a kind of double top for GLD….and end my short-term trading around my core GLD position.
")
Dave & Busters Entertainment, Inc (PLAY) peaked at a near 7-year high following a 10.3% post-earnings surge. The stock has fallen ever since. PLAY now trades around where it ended 2023 on a powerful run-up. Even the retail rebound last week did nothing to break the grip of this downtrend. Needless to say, I am no longer enthusiastic about jumping back into PLAY with the confidence in an eventual rally. When a stock hits a peak like PLAY, I see huge risks of a blow-off top.
")
UiPath, Inc (PATH) provides robotic process automation (RPA). Last week the processes came to a screeching halt as PATH lost 34% post-earnings. At a 17-month low, PATH looks like a broken stock. The company issued guidance that was slightly short of “expectations” so the announcement of a CEO change likely caused the dramatic collapse. Given the new CEO is the former CEO and founder, I am tempted to buy the stock for a short-term trade after it closes at a new post-earnings high. {June 3, 2024 addendum: I found out that Cathy Wood’s ARK Innovation ETF (ARKK) loaded up on more shares in PATH as the stock collapsed. If anyone still chases ARK’s buys, maybe PATH has a chance for a relief rally after all. PATH is ARKK’s 5th largest holding at a 5.5% allocation.}
")
Along with DELL, Salesforce, Inc (CRM) was the disaster of the week. The big cap tech company that sells a portfolio of sales automation software products disappointed investors to the tune of a 19% post-earnings plunge. While the 7% rebound the next day looks promising, I am inclined to leave CRM alone in favor of other stocks. CRM delivered an early warning with a confirmed 50DMA breakdown in mid-April and then a failure at 50DMA resistance ahead of earnings. Maybe the NVDA hangover was too much for CRM; after all, the CEO told what looks like on the surface an interesting AI story. From the transcript of the earnings call:
“…let me tell you why I’m excited about Data Cloud and why it’s transforming our customers and how it’s preparing them for this next generation of artificial intelligence. Data Cloud was included in 25% of our $1 million plus deals in the quarter. We added more than 1,000 data cloud customers for the second quarter in a row. 8 trillion records were ingested in the Data Cloud in the quarter, up 42% year-over-year and we processed 2 quadrillion records, that’s a 217% increase compared to last year. Over 1 trillion activations drove customer engagement, which is a 33% increase year-over-year. This incredible growth of data in our system and the level of transactions that we’re able to deliver, not just in the core system but especially in data cloud is preparing our customers for this next generation of AI. And last month, we created a Zero Copy Partner Network with partners, including Amazon, Databricks, Google, IBM, Microsoft and Snowflake, so customers can access this live data from anywhere in data cloud without copying or moving it. It’s the engine of our future growth and this is the engine of our future artificial intelligence growth as well.”
")
CRM is the third largest holding in iShares Expanded Tech-Software Sector ETF (IGV) at an 8.1% share. CRM’s loss helped drive IGV into a test of its low of the year set back in January. Back in March, I targeted IGV as my core short to express my skepticism in the stock market rally at the time. IGV hit my target of a test of the January low much faster than I expected. After I covered in April, I never thought to re-establish the short. This second fall to the lows of the year gives IGV a “heavy”, toppy look…
")
Database provider Snowflake, Inc (SNOW) is still suffering from an NVDA hangover. The stock initially gapped up post-earnings but then sank like a stone for a 50DMA breakdown and 5.4% loss. The subsequent selling accelerated and took SNOW to a 13-month loss. I am deep in the red on a put option I sold too eagerly at the 50DMA; I was looking at owning SNOW at these levels given the CEO bought $5M worth of stock in early April. I failed to heed the warning that came from the stock making new lows even after that news…
")
Another database company is suffering from a major post-earnings hangover. MongoDB, Inc (MDB) crashed 23% post-earnings and closed the week at a 52-week low. The NVDA hangover was a warning for MDB. Like SNOW, MDB initially gapped up at the open following NVDA earnings only to end the day at a loss and a close below its 50DMA. The selling accelerated from there…
")
According to Seeking Alpha, InMode Ltd (INMD) “designs, develops, manufactures, and markets minimally invasive aesthetic medical products based on its proprietary radiofrequency assisted lipolysis and deep subdermal fractional radiofrequency technologies in the United States and internationally.” I like the stock for a potential bottoming play. After earnings, the stock bounced off a near 4-year low. From there, it has ground its way along an uptrending 20DMA and is holding support at a converged 20DMA and 50DMA. A breakout from here validates the technicals. Otherwise, I will need to back out of the trade.
")
Software debugging alert system PagerDuty, Inc (PD) experienced strange trading around its earnings. PD lost 7.6% going into earnings and closed at a 4-year low. That plunge looked like a dire pre-earnings warning. Instead, PD gapped higher post-earnings by 18.4%. From there, sellers faded the stock from 50DMA resistance and whittled the post-earnings gain to 5.7%. I bought stock when the price hit the previous day’s intraday high. The clear stop loss below the 4-year low made the trade attractive, and I like even better the prospect of the stock meandering its way back to 50DMA resistance.
I asked ChatGPT to provide some insight on why investors may have mixed feelings about the quarter based on analyzing the transcript of the earnings conference call.
Prompt: PagerDuty (PD) opened higher by 18.4% but closed the day with just a 6% gain. Examine the transcript from the earnings call and explain to me why investors may have mixed feelings about PD’s results. I noticed an analyst called the results “great”:
ChatGPT: The earnings call transcript reveals several reasons why investors might have mixed feelings about PagerDuty’s (PD) results despite some positive highlights. Here’s a breakdown of key points that could contribute to both optimism and caution:
Positive Aspects
Revenue and Profitability:
- Revenue growth of 8%, hitting the midpoint of their guidance.
- Non-GAAP operating margin of 14%, which is four points above their guidance range.
- Seventh consecutive quarter of non-GAAP profitability.
Annual Recurring Revenue (ARR):
- ARR increased by $11 million to $463 million, with ARR growth stabilizing at 10% for the second consecutive quarter.
- Positive momentum in large, multiyear, multiproduct contracts.
Customer Growth and Product Expansion:
- Growth in large customer contracts, with customers spending more than $500,000 and $1 million growing in the high teens.
- Strong adoption of multiproduct solutions, with 60% of net new ARR composed of customers investing in additional products.
New Product Introductions:
- New enterprise plan for incident management.
- Acquisition of Jeli, which exceeded ARR contribution targets.
Negative Aspects
Macro Environment and SMB Challenges:
- Pressure on gross retention due to capital constraints, especially among SMBs.
- High levels of churn and downgrades in SMB segment continue to be a headwind.
Dollar-Based Net Retention (DBNR):
- DBNR at 106%, which is stable but not showing significant improvement.
- Expectations for flat DBNR in the upcoming quarter, with hopes of improvement in the second half of the year.
International Market:
- Modest change in international contribution to total revenues, indicating limited growth in this area.
- Signs of stabilization but not significant growth in international markets.
Guidance and Market Sentiment:
- Conservative revenue growth guidance for the next quarter and full fiscal year (7% to 9% for Q2 and 9% to 11% for FY2025).
- Continued macroeconomic volatility affecting customer spending and growth.
Investor Sentiment
The analyst calling the results “great” likely refers to the company’s ability to maintain profitability and show resilience in a challenging macro environment. However, mixed feelings may arise from:
- The ongoing challenges in the SMB segment.
- Stable but not exceptional DBNR.
- Conservative guidance indicating cautious optimism rather than strong growth expectations.
Overall, the earnings call suggests that while PagerDuty is performing well and showing resilience, the broader economic environment and specific segment challenges temper the overall outlook, leading to mixed investor sentiments.
")
Work management software company Asana, Inc (ASAN) had a similar earnings experience as PD. The stock lost 4.9% ahead of earnings and closed at a 16-month low. The stock gapped up 13.4% post-earnings, tried to move beyond 50DMA resistance, and then faded all the way to a slight loss on the day of 0.6%. Like PD, I bought the stock at the previous day’s intraday high. With the stock trading straight down to my stop loss point, I will release this position like a hot potato in the coming week if buyers do not show up right away.
I asked ChatGPT a question similar to the one I asked about PD:
Prompt: “Asana, Inc (ASAN) opened higher by 13.4% but closed the day with 0.6% loss. Examine the transcript from the earnings call and explain to me why investors may have mixed feelings about PD’s results.
I noticed an analyst summarized the strength of Asana’s results as follows: “A number of software companies have talked about sequential enterprise demand weakness this quarter, calendar Q1 versus calendar 4Q. And if I heard your comments correctly, what you’re experiencing is markedly different or more positive. I think I heard you talk about a solid finish to the quarter, stabilizing or stable churn rates and strong pipeline. So if I heard that correct, to what do you attribute the relative strength? Is it the product? Is it relatively low penetration? I think it would be helpful to put a finer point on that just given how the markets responded recently to some of the other company commentary.”:
However, ChatGPT’s answer was not compelling. It provided a good summary of strengths but not the weaknesses, including some generic commentary and a reference to the volatility in the price of the stock. So I next asked for a specific analysis of the weaknesses shown in the transcript.
Prompt: “Your analysis of the negative aspects was too generic and an insufficient explanation of why the positive aspects were not enough to keep the stock higher. Please re-analyze the transcript and specifically categorize all the weaknesses in the report.”
ChatGPT:
Upon re-evaluating the Asana, Inc. (ASAN) earnings call transcript, I can identify several specific weaknesses that could explain why the stock did not maintain its initial gains. Here is a more detailed analysis of the negative aspects:
Detailed Weaknesses in the Report
Guidance and Growth Concerns:
- Modest Guidance: Asana’s guidance for Q2 fiscal 2025 projected revenues of $177 million to $178 million, representing growth of 9% to 10% year-over-year. This is relatively modest and may not meet the high growth expectations of investors, especially given the initial excitement around AI advancements.
- Full Year Growth Rate: The full fiscal year 2025 revenue growth guidance of 10% to 11% also suggests a deceleration compared to past growth rates, which could be a cause for concern among investors looking for higher growth trajectories.
Ongoing Operating Losses:
- Non-GAAP Loss from Operations: For Q2 fiscal 2025, Asana expects a non-GAAP loss from operations of $21 million to $23 million, indicating continued unprofitability. This translates to an operating margin of negative 12% at the midpoint of guidance.
- Full Year Operating Losses: For the full fiscal year 2025, the expected non-GAAP loss from operations ranges from $55 million to $59 million, representing an operating margin of negative 8%. Continued losses, despite revenue growth, can dampen investor sentiment.
Net Retention Rate (NRR) and Renewal Challenges:
- Expected Decline in NRR: The dollar-based net retention rate (DBNR) is expected to bottom in Q2, at or slightly below 100%, indicating that existing customers are not expanding their spend at a rate sufficient to offset churn.
- Tough Renewals: Asana highlighted specific tough renewals in Q2, suggesting potential difficulties in maintaining and expanding existing customer relationships.
Customer Churn and SMB Segment:
- Churn Rates: While overall churn rates have stabilized, there remains pressure from the SMB segment. This is a critical segment for Asana, and continued challenges here could impact overall growth.
- Seat Adjustments: There are ongoing seat adjustments, particularly in the U.S., which may reflect broader macroeconomic challenges or internal issues in maintaining customer seat counts.
Cash Flow and Profitability Concerns:
- Negative Free Cash Flow: Q1 free cash flow was negative $4.3 million, although improved from the previous year. Continued negative cash flow, even if improving, remains a concern for long-term sustainability.
- Investment Needs: Asana is front-loading investments to capture the AI opportunity, which, while potentially lucrative, requires significant capital outlay, affecting short-term profitability and cash flow.
Market and Competitive Environment:
- Competitive AI Landscape: The market is saturated with numerous software companies touting AI capabilities. Asana’s ability to differentiate and maintain a competitive edge amidst this crowded landscape could be challenging.
- Broader Market Sentiment: There is a general sentiment of demand weakness in the enterprise software market, as highlighted by other software companies. This broader market concern may overshadow Asana’s individual performance, affecting investor confidence.
Geographic Variability:
- North America Lag: While EMEA and Japan showed strong growth, North America’s performance has been lagging. The company expects improvement, but this remains a risk if North America does not meet expectations.
- EMEA Leadership Improvement: While improvements in EMEA are promising, the delayed similar improvements in North America could indicate regional execution challenges.
Conclusion
Despite the positive aspects such as strong AI integration, enterprise growth, and strategic customer wins, these specific weaknesses provide a clearer picture of why the stock did not sustain its initial gains. Investors are likely concerned about modest growth guidance, ongoing operating losses, challenges in net retention and renewals, negative cash flow, and the competitive and market environment. These factors collectively contribute to a more cautious outlook, balancing out the initial optimism from the positive highlights in the report.
")
")
")
Be careful out there!
Footnotes
Subscribe for free to get email notifications of future posts!
“Above the 50” (AT50) uses the percentage of stocks trading above their respective 50-day moving averages (DMAs) to measure breadth in the stock market. Breadth defines the distribution of participation in a rally or sell-off. As a result, AT50 identifies extremes in market sentiment that are likely to reverse. Above the 50 is my alternative name for “MMFI” which is a symbol TradingView.com and other chart vendors use for this breadth indicator. Learn more about AT50 on my Market Breadth Resource Page. AT200, or MMTH, measures the percentage of stocks trading above their respective 200DMAs.
Active AT50 (MMFI) periods: Day #131 over 20%, Day #30 over 30%, Day #21 over 40%, Day #1 over 50% (overperiod), Day #9 under 60% (underperiod), Day #98 under 70%
Source for charts unless otherwise noted: TradingView.com
Full disclosure: long SPY call spread, long QQQ call, long PD, long ASAN, long BBY, long AMD shares and call spread, long GLD shares and call spread, short SNOW put, long INMD, long CAT put spread, long ARKK
FOLLOW Dr. Duru’s commentary on financial markets via StockTwits, Twitter, and even Instagram!
*Charting notes: Stock prices are not adjusted for dividends. Candlestick charts use hollow bodies: open candles indicate a close higher than the open, filled candles indicate an open higher than the close.