Stock Market Commentary
Last week was a week like few other for the volatility index, the VIX. In my last Market Breadth I made the case for the VIX mattering again. A VIX follow-through demonstrated even more strength and resilience. The resulting closing high for the year is a firmer bearish signal for the stock market…at least until market breadth finally falls into oversold conditions. While market breadth plunged along with the spike in the VIX, the major indices are doing their best to maintain their own veneer of resilience as money rotates right back into big cap tech stocks.
The escalating conflict in the Middle East further expanded World War 3 and could raise the stakes for financial markets. I only say “could” because, to-date, the market has largely ignored geo-political tensions. Accordingly, I am not directly factoring in such things into my assessment of the stock market. However, while predictions are futile given the market’s ability to whistle right by all the fighting and destruction, I continue to stick by my theme for this rally: be ready, so you don’t have to get ready. On a related sidenote, I have taken note of the multitude of times on the news where the experts and pundits expressed surprise at the scale of the latest escalation. In other words, do not expect anyone (credible) to provide ample warning of the next calamity.
The Stock Market Indices
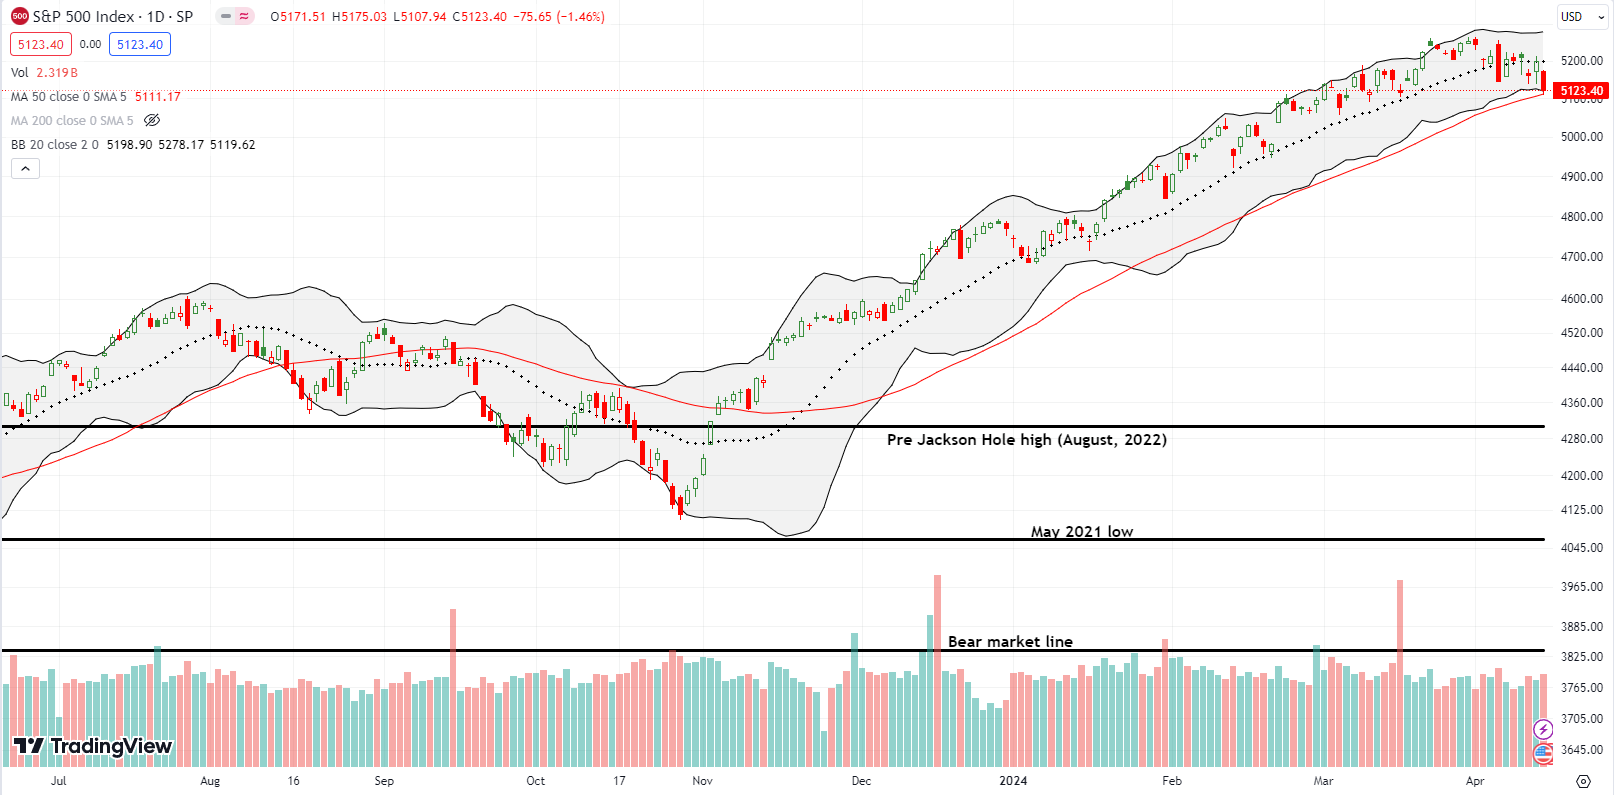
The S&P 500 (SPY) started the week looking ready to forget all about the previous week’s disappointment over the March inflation (CPI) report. After holding just above the 20-day moving average (DMA) (the dotted line) buyer resolve weakened just enough to allow for a tentative test of 50DMA support (the red line). The rebound off the 50DMA was classic technicals, but the the result was also weak and unconvincing. After 4 months of nearly unrelenting buying and rebounds from bearish signals, the S&P 500 finally looks toppy. Moreover, for the first time this year, the index has created a downtrend from its previous all-time high.
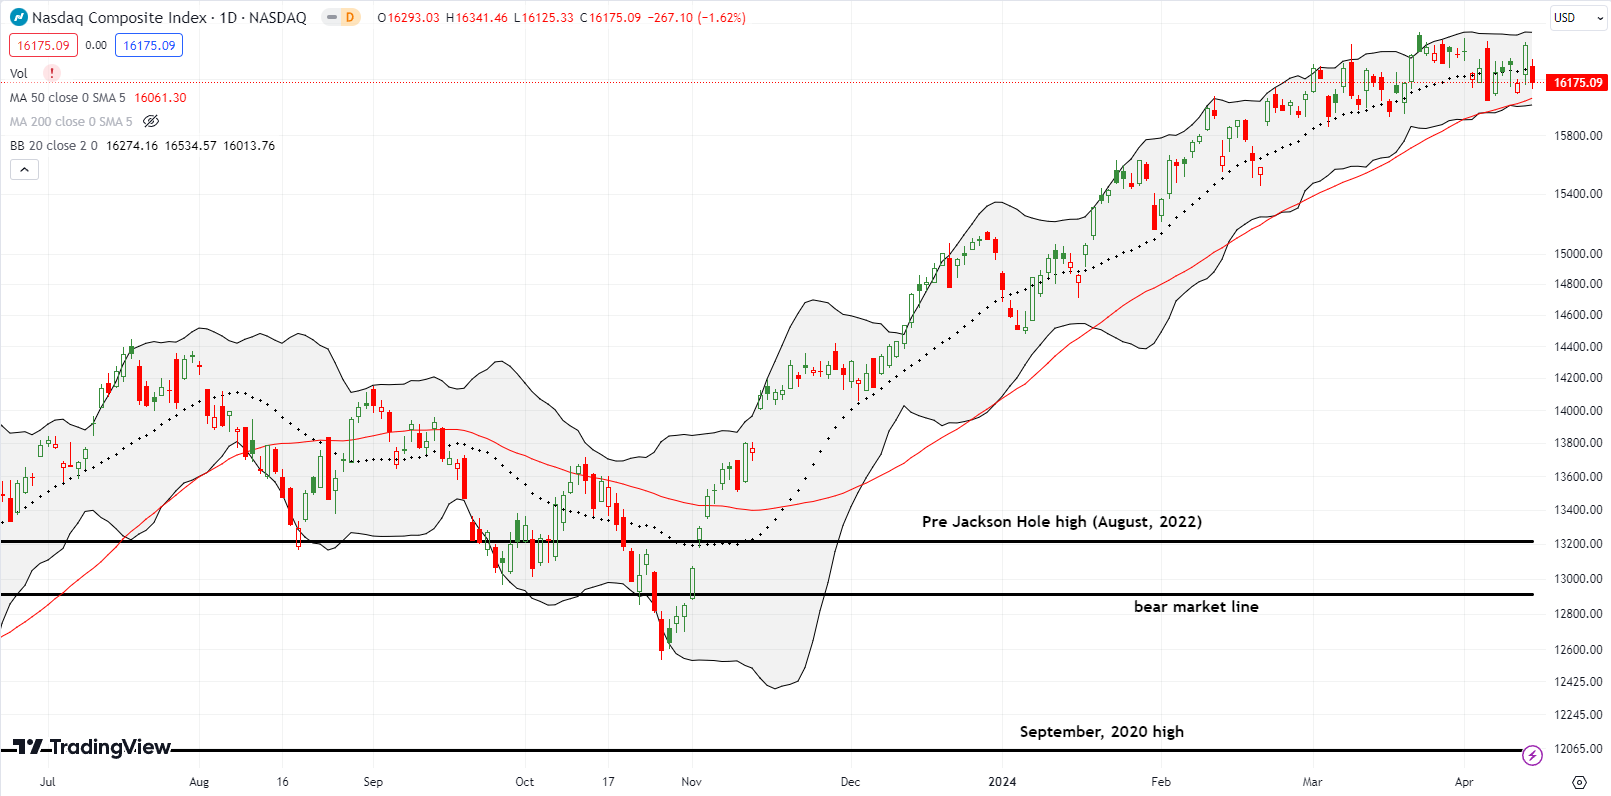
The NASDAQ (COMPQ) seemed better positioned to test its 50-day moving average (DMA) than the S&P 500. In fact, big cap tech looked ready to lead major outperformance on Thursday with a new (marginal) all-time high for the NASDAQ. The surge was large enough to help the tech-laden index avoid a test of 50DMA support on Friday’s 1.6% loss. On balance, the NASDAQ has been churning since late February, but it does not quite look toppy…yet.
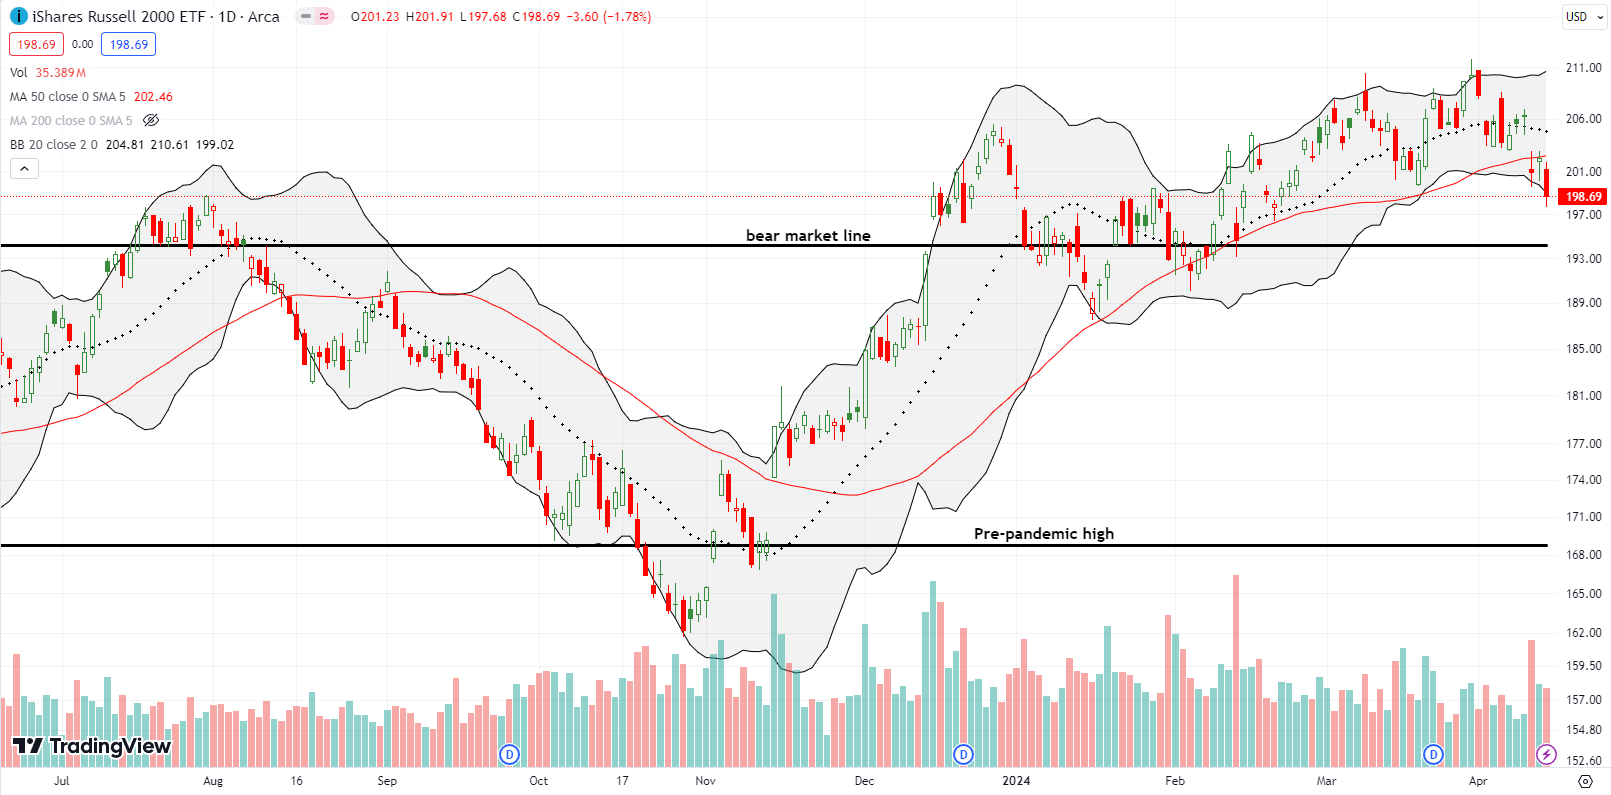
The iShares Russell 2000 ETF (IWM) looks topped out with a confirmed 50DMA breakdown (two lower closes below the 50DMA). While a retest of the bear market line now seems in play, I bought speculative IWM call options in case the stock market pulls off an unexpected turnaround in the coming week.
The Short-Term Trading Call With A VIX Follow-Through
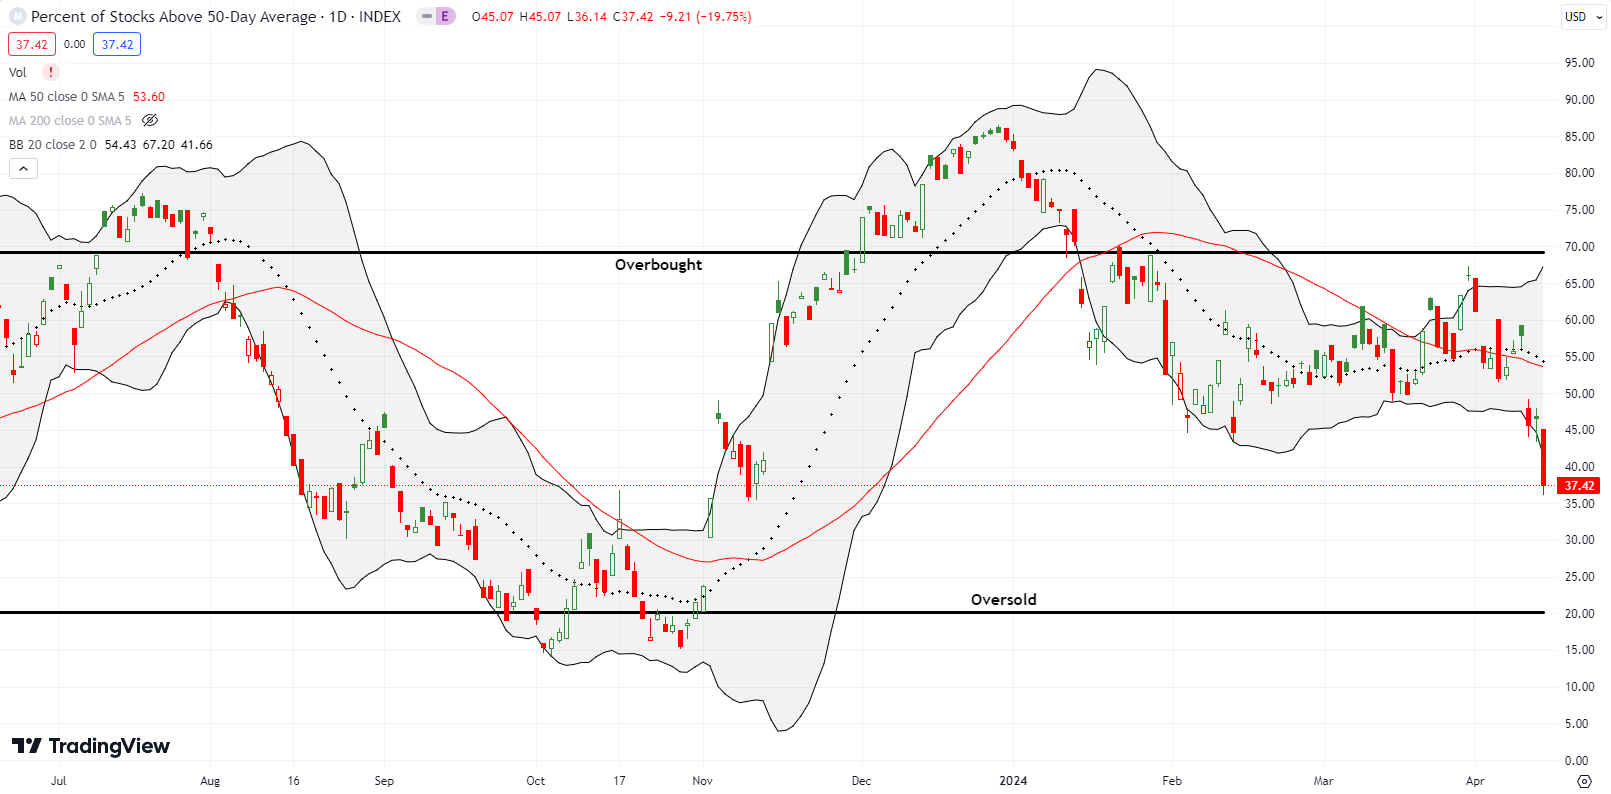
- AT50 (MMFI) = 37.4% of stocks are trading above their respective 50-day moving averages
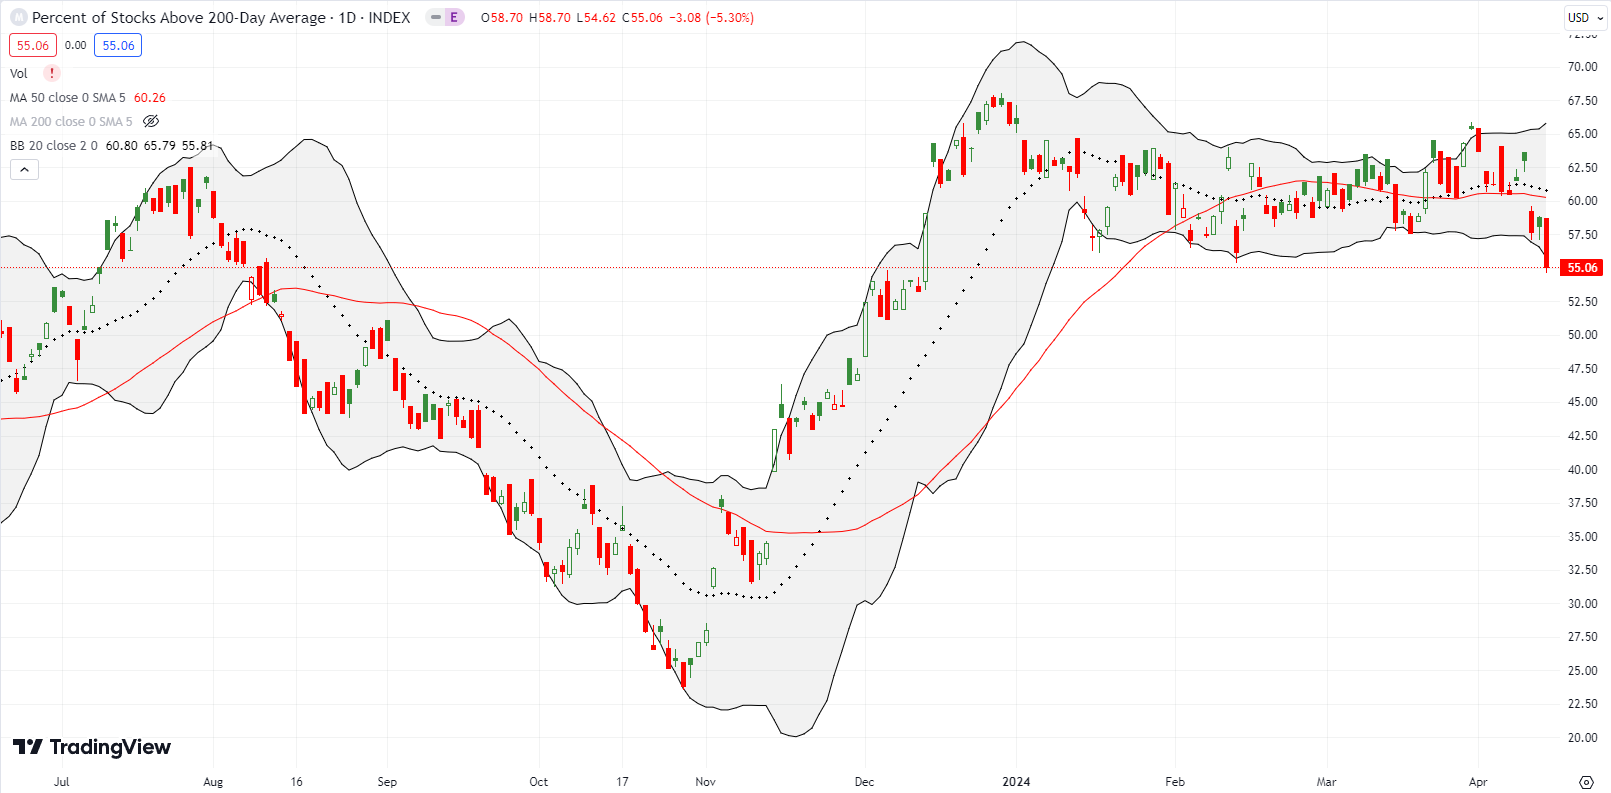
- AT200 (MMTH) = 55.1% of stocks are trading above their respective 200-day moving averages
- Short-term Trading Call: skeptical
AT50 (MMFI), the percentage of stocks trading above their respective 50DMAs, closed at 37.4%, its lowest level since November 9th last year. This plunge further confirmed the stock market’s underlying weakness even as the S&P 500 and the NASDAQ remain above key support levels. In fact, the sharp 9 percentage point drop in my favorite technical indicator, AT50, now starkly contrasts with the ongoing stock market rally in its most bearish way yet. Still, the extreme 1-day decline sets up “quasi-oversold” trading conditions given the surge in the VIX. Thus, it is very possible traders will mechanically buy “bargains” on Monday no matter the headlines. I am skeptical that such a reaction can last the week.
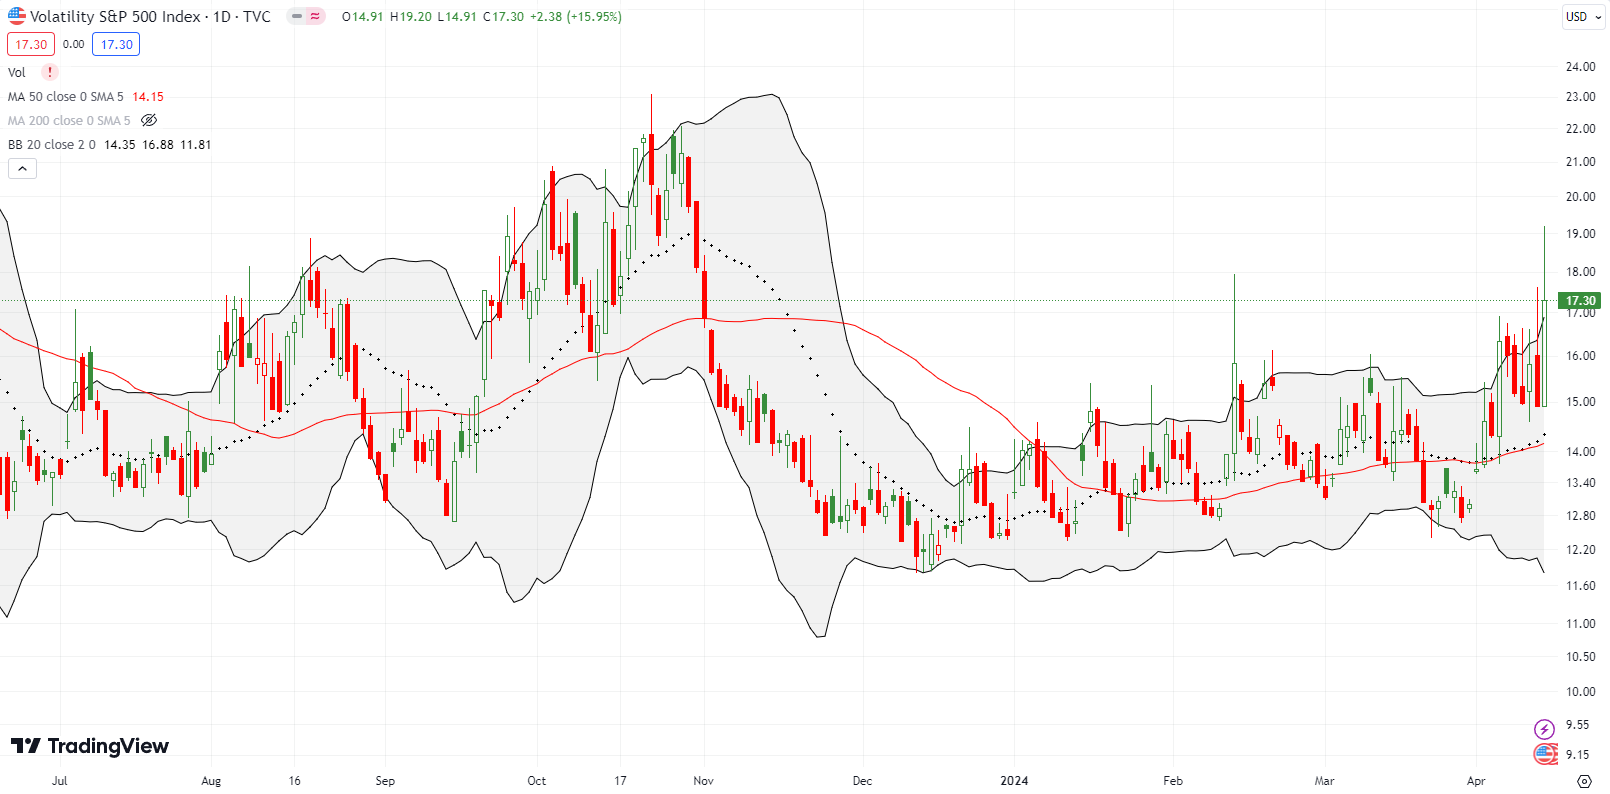
For the second straight week, the VIX was the star of the show. In the prior week, I noted the significance of the VIX’s resilience. Last week’s surge was most visible on Friday’s high to 19.2 which wiped away strong fades in prior days. Friday’s faders only managed to push the VIX back to 17.3, a new high for the year. Overall, the uptrend in the VIX is very much intact and confirmed over the last two weeks of upward pressure.
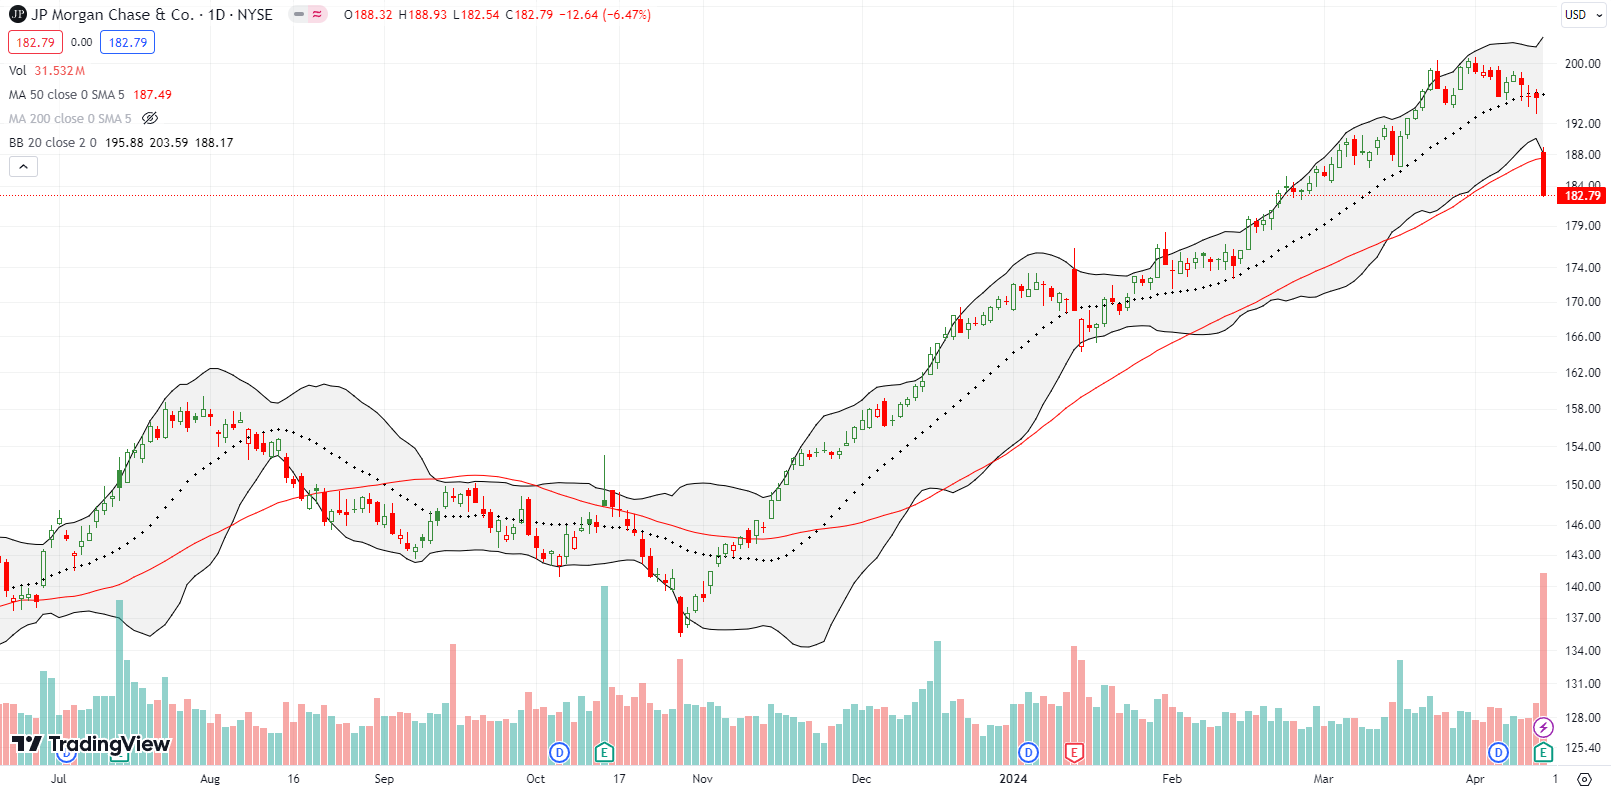
The biggest star of the bearish show on the stock side of things was JP Morgan Chase & Co (JPM). JPM plunged 6.5% post earnings for a very bearish looking 50DMA breakdown. JPM closed near a 2-month low and dragged the Financial Select Sector SPDR Fund ETF (XLF) into its own bearish 50DMA breakdown. Both JPM and XLF last closed below the 50DMA trendline back in October. A mechanical rebound is possible from here given JPM closed well below its lower Bollinger Band (BB) and is thus stretched to the downside.
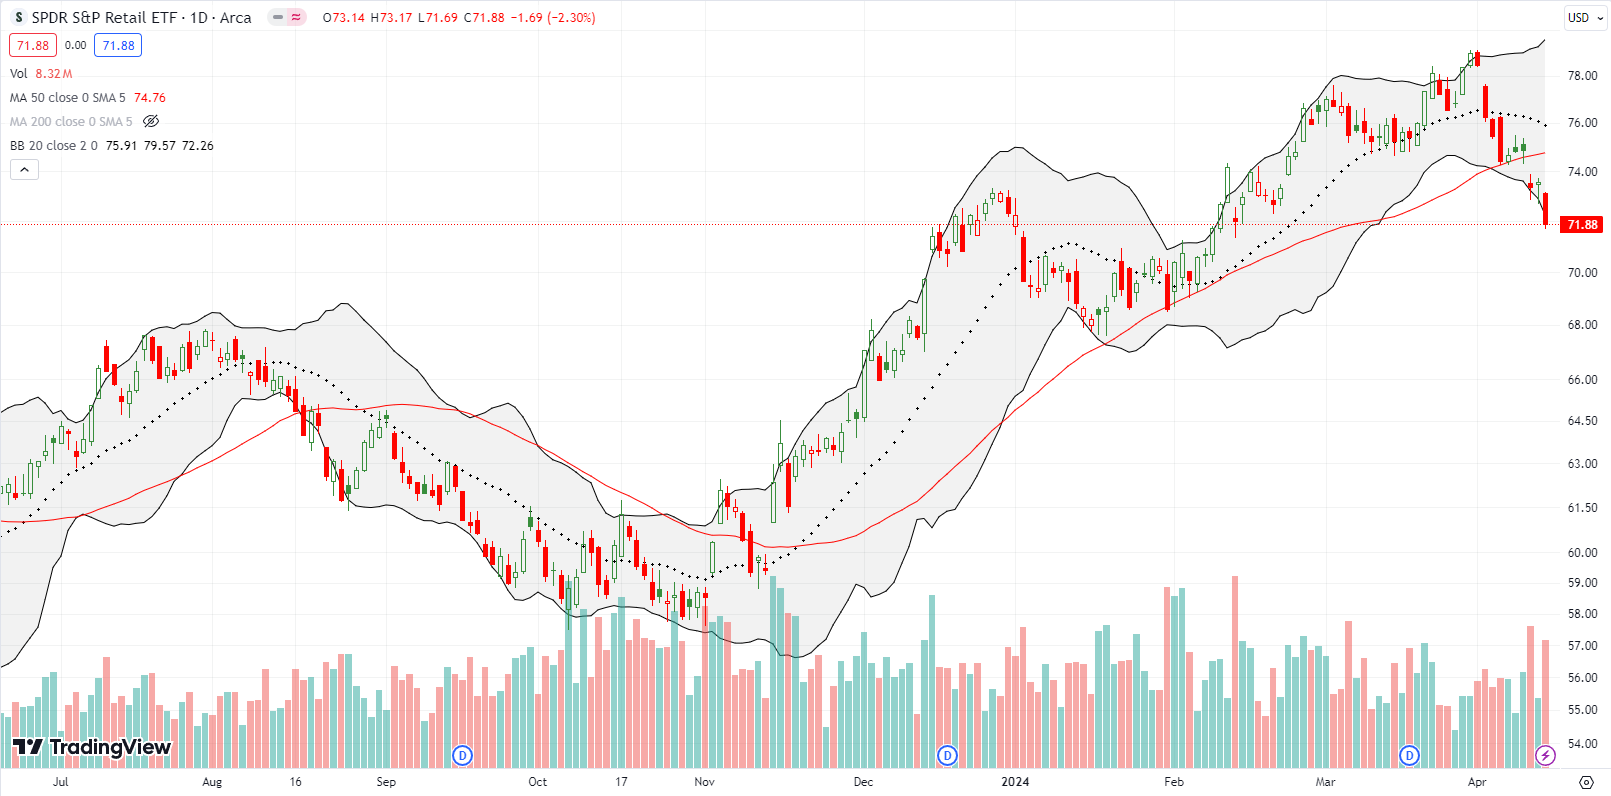
Retail stocks added their confirmation of the market’s growing underlying weakness. XRT lost 2.3% on Friday and confirmed a 50DMA breakdown. The close below the December high also confirms the end of XRT’s primary uptrend.
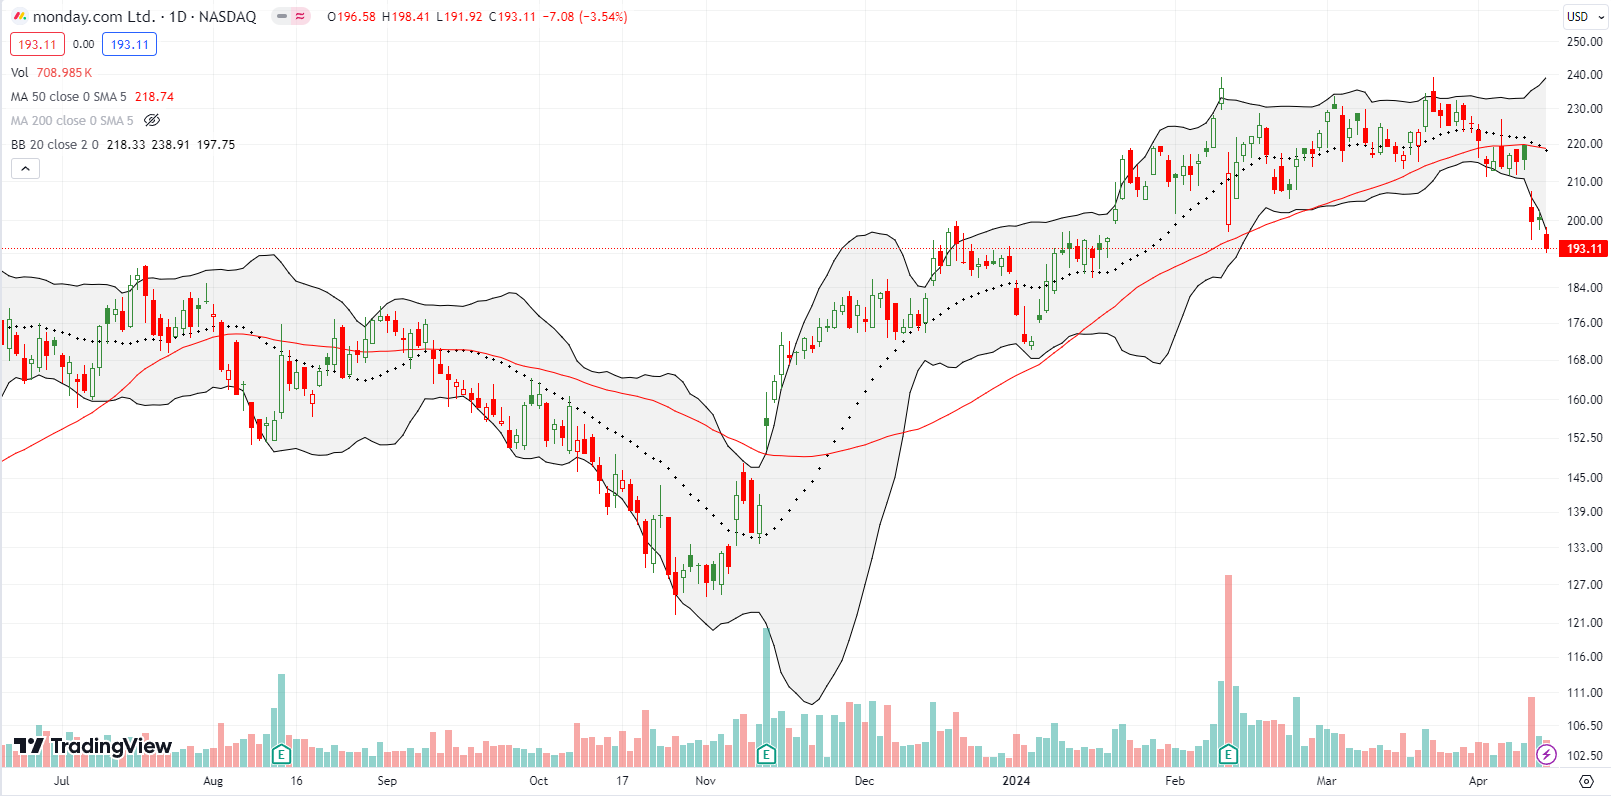
monday.com Ltd (MNDY) is a project management software company that has somehow managed to maintain a significant valuation premium (for example, 11.6 price/book). You may have seen the company’s ads on Youtube and wondered why the company thinks you will buy its software. However, the marketing works, and the brand helps prop up the valuation.
On Wednesday, Citigroup took a step back from its bullish peers and downgraded MNDY to neutral. While the reduced price target to $250 still implies a great return from current levels, the stock still took a 7.3% hit. I jumped into a put spread based on the confirmed 50DMA breakdown.
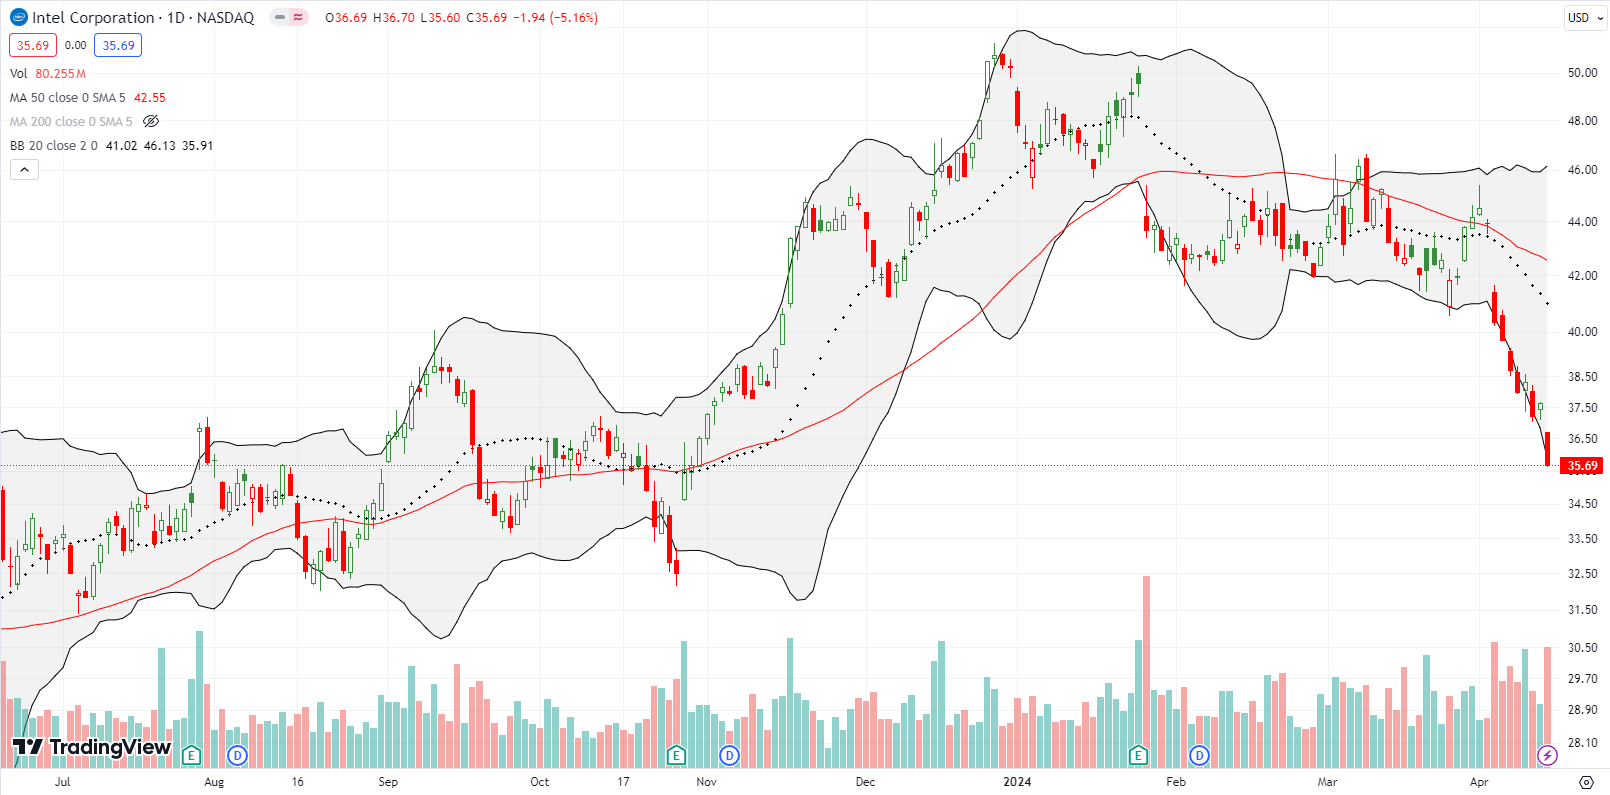
Intel Corporation (INTC) has experienced a nearly continuous decline throughout the month. INTC gapped down 8.2% on April 3rd in response to a business update titled “Intel Outlines Financial Framework for Foundry Business, Sets Path to Margin Expansion.” The title looked promising, but investors clearly do not buy it. Intel created “Intel Foundry”, a new operating segment that will “unlock significant cost savings, operational efficiencies and asset value.” The time horizon for margin expansion out to 2030 must feel like an eternity away. The subsequent selling has been so relentless that the stock never created an entry point for one last between earnings trade. With the October lows around the corner, I remain on alert for an opportunity after the next earnings report.
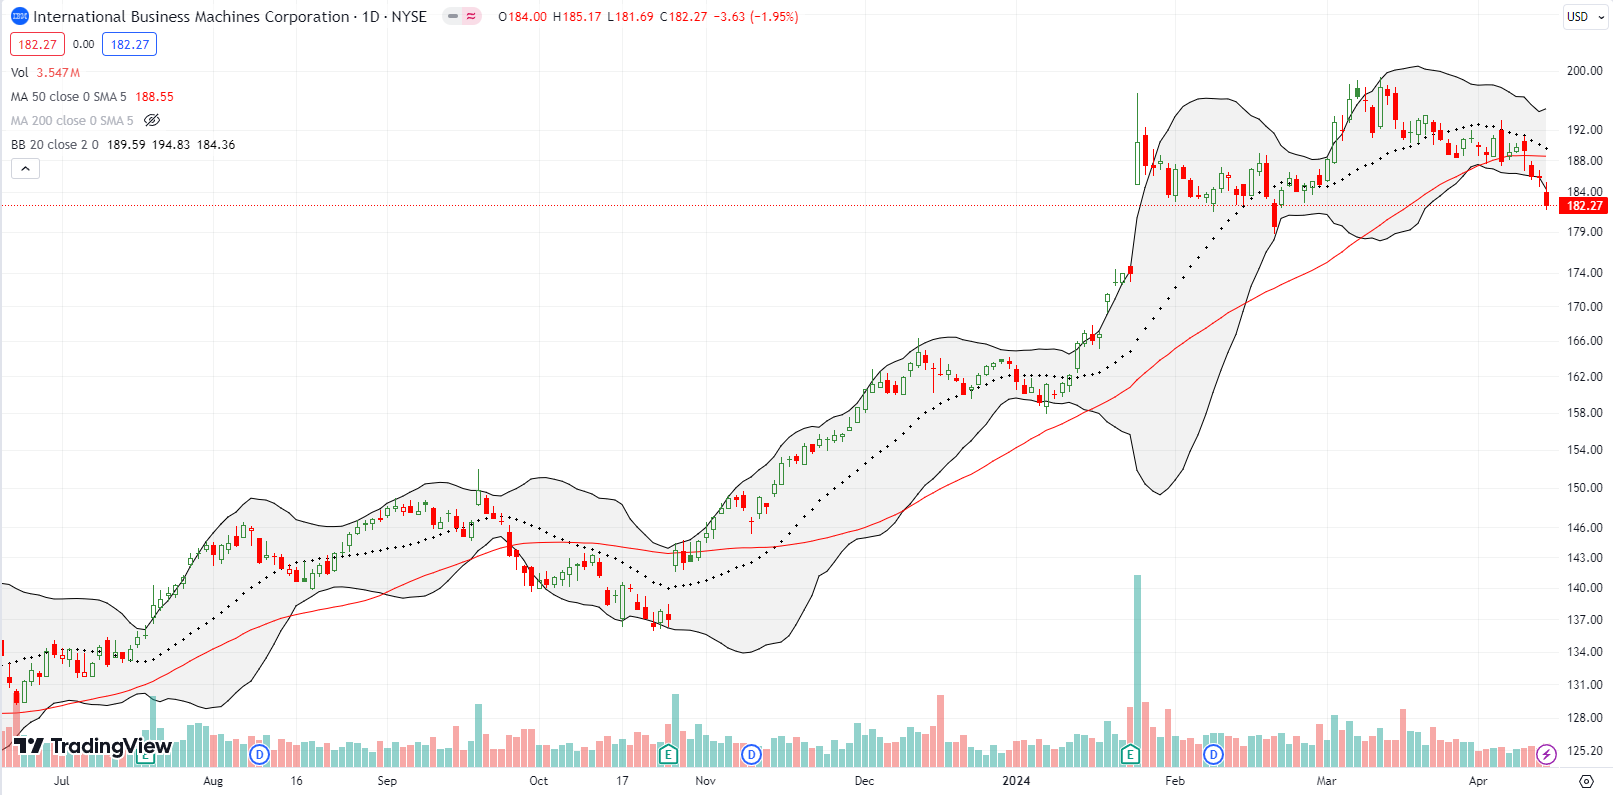
This year, International Business Machines Corporation (IBM) became a sneaky tech trade and generative AI play. Unfortunately, IBM failed to make much progress after its startling 9.5% post-earnings pop in January. Last week, IBM confirmed a 50DMA breakdown and printed its second lowest post-earnings close. Thus, the stock looks tired. A new post-earnings low will set IBM on a bearish path toward a complete reversal of its post-earnings gains.
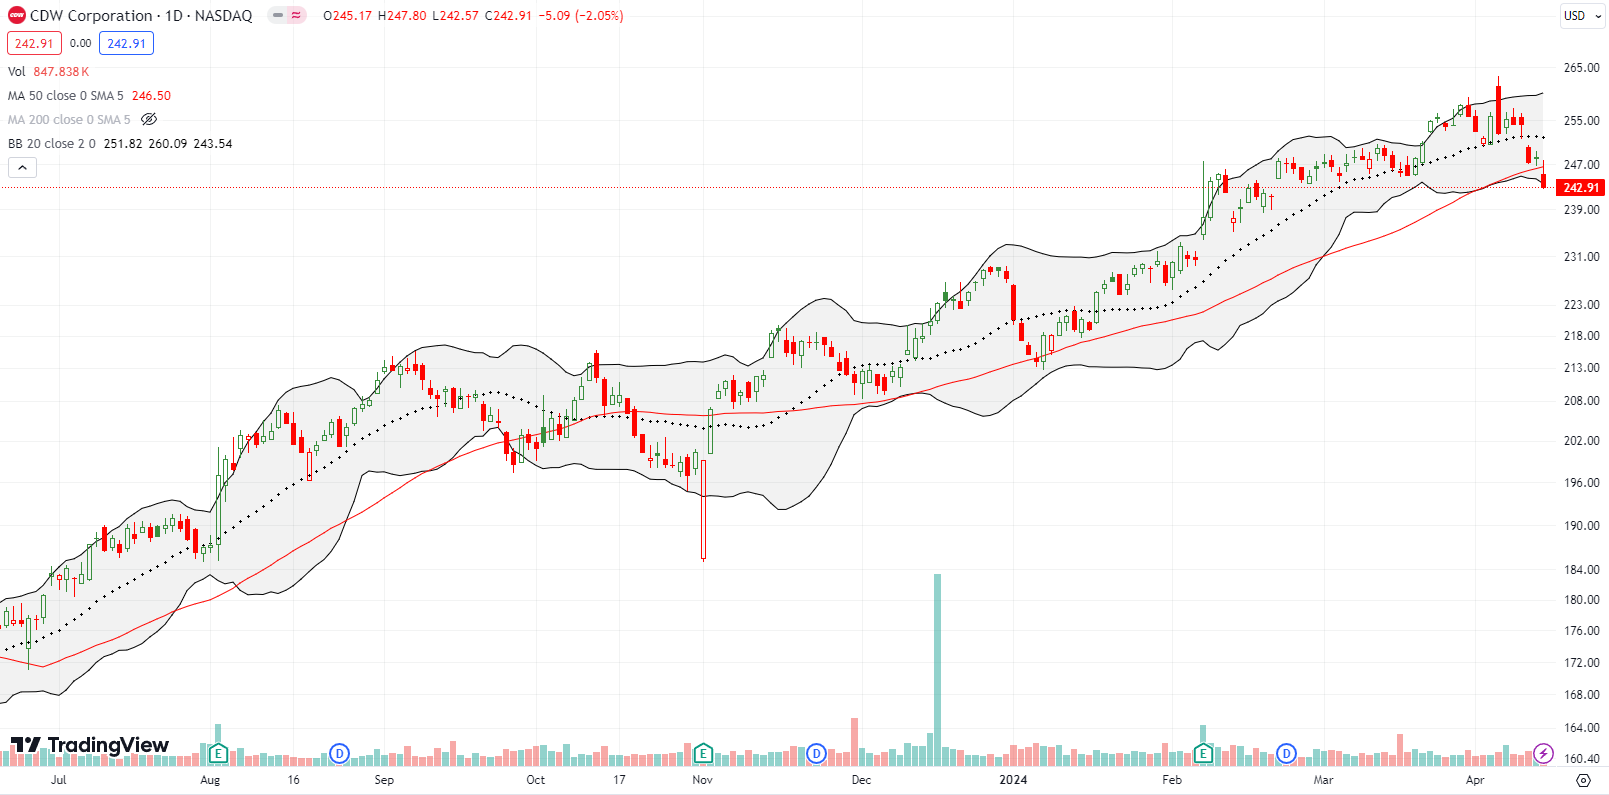
A year ago, CDW Corporation (CDW) made big headlines after warning about IT spending. The stock promptly lost 13.2% on that day. Yet, the stock never traded lower and proceeded to rally to new all-time highs. CDW has gained a puzzling 47.1% since the post-warning collapse. The subsequent rally makes me wonder what was so bad about the news after all.
Anyway, last week, CDW closed convincingly below its 50DMA for the first time this year. Given the market context, I shorted a small number of shares. I wanted to buy a put spread, but CDW options have poor liquidity.
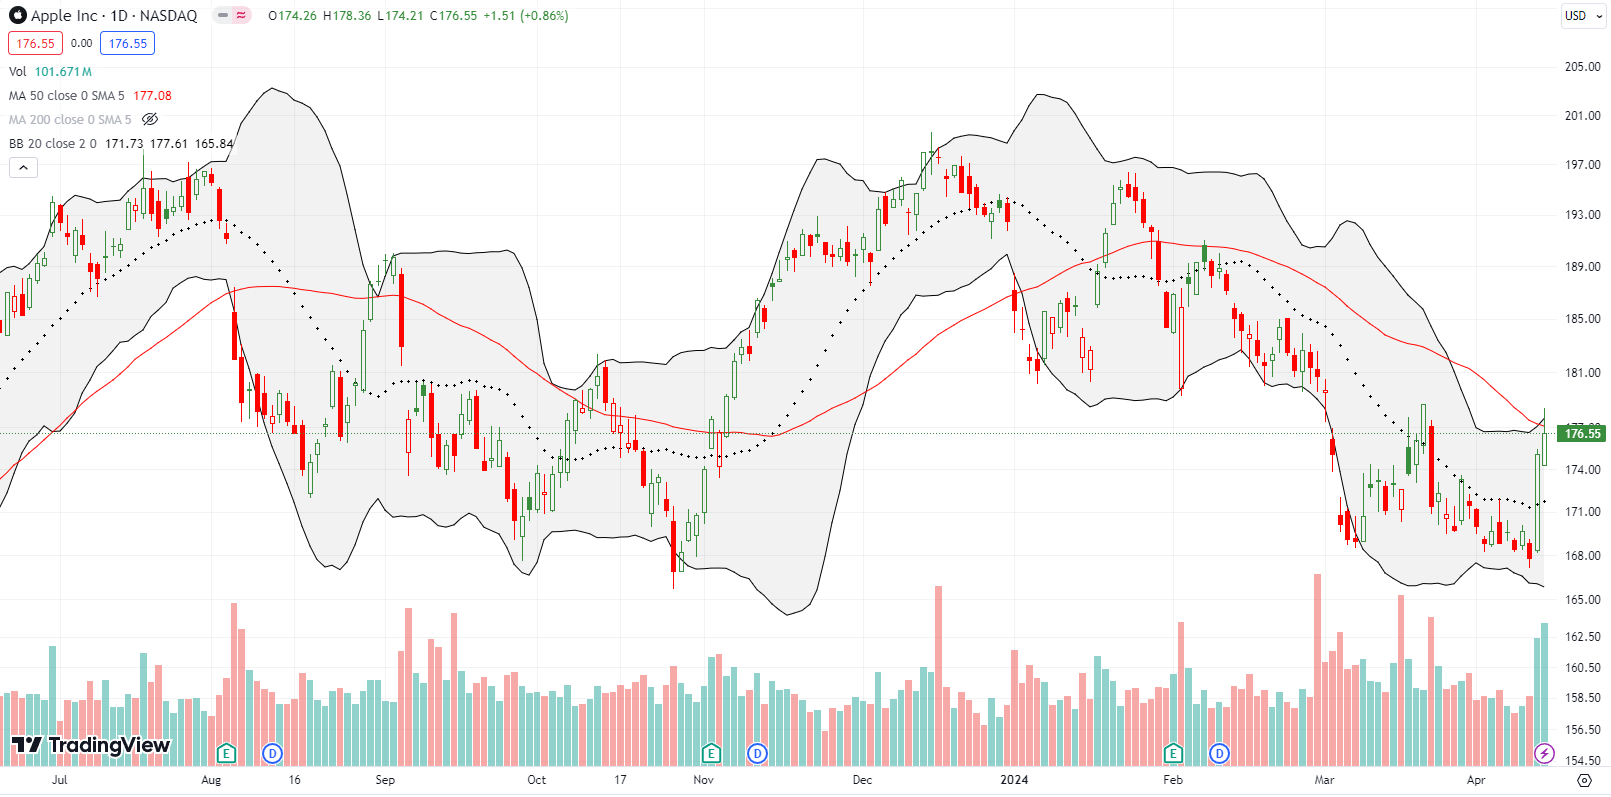
Apple Inc (AAPL) is finally vying for a spot in my generative AI trade. On Thursday, Bloomberg ran a report with rumors of an AI-related refresh for the Mac computer. I call the news a rumor given Apple has yet to publish related news on its website.
The trading action was swift and demonstrated pent-up demand waiting for an excuse to buy AAPL. I happened to have a call option in hand ahead of the news but took profits too quickly (poor execution – I did not check the news BEFORE selling!). I jumped back in on Friday with a call spread. Apple closed the week fading from a 50DMA breakout and closing just short of resistance.
Apple’s sudden outperformance presents a challenge for the general market. Presumably, AAPL’s weakness this year helped provide funds that supported a modest broadening of market breadth. An Apple rally could suck money out of a lot of stocks and in turn create a drag on market breadth.
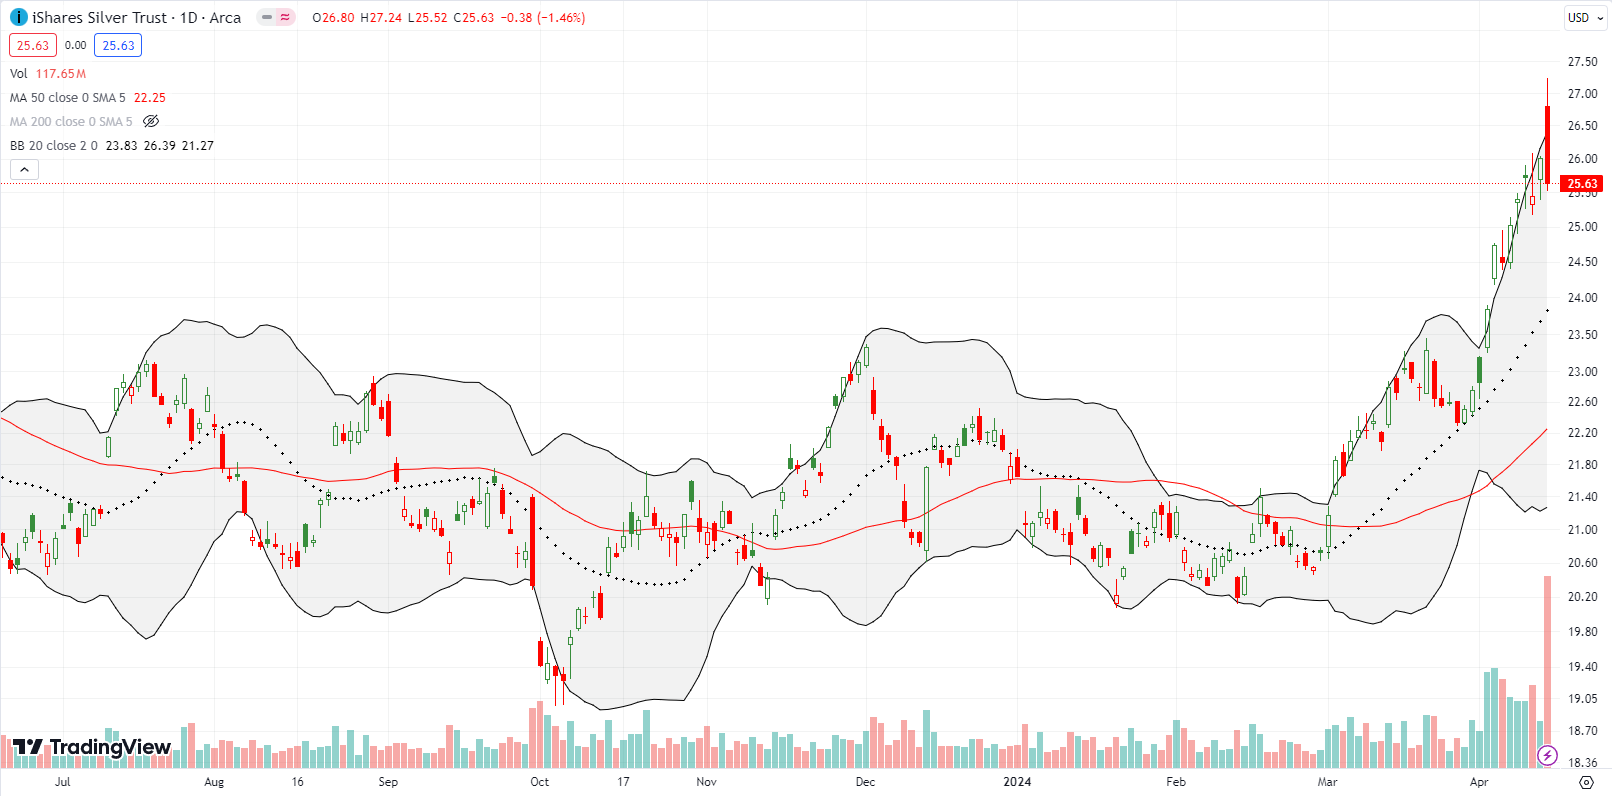
At the end of March, I touted the gold trade. April delivered bigtime, and I made a successful trade around my core GLD position. I neglected to point out a similar trajectory for silver. The iShares Silver Trust (SLV) surged sharply this month, but the rally may have come to a screeching halt with Friday’s sharp reversal.
SLV was up as much as 4.7% before closing down 1.5% on the day. The reversal created a rally-ending bearish engulfing topping pattern. At a minimum, SLV, and similarly GLD, look ready for a “cooling” period. I will look for an entry for the next trade, like a test of uptrending 20DMA support.
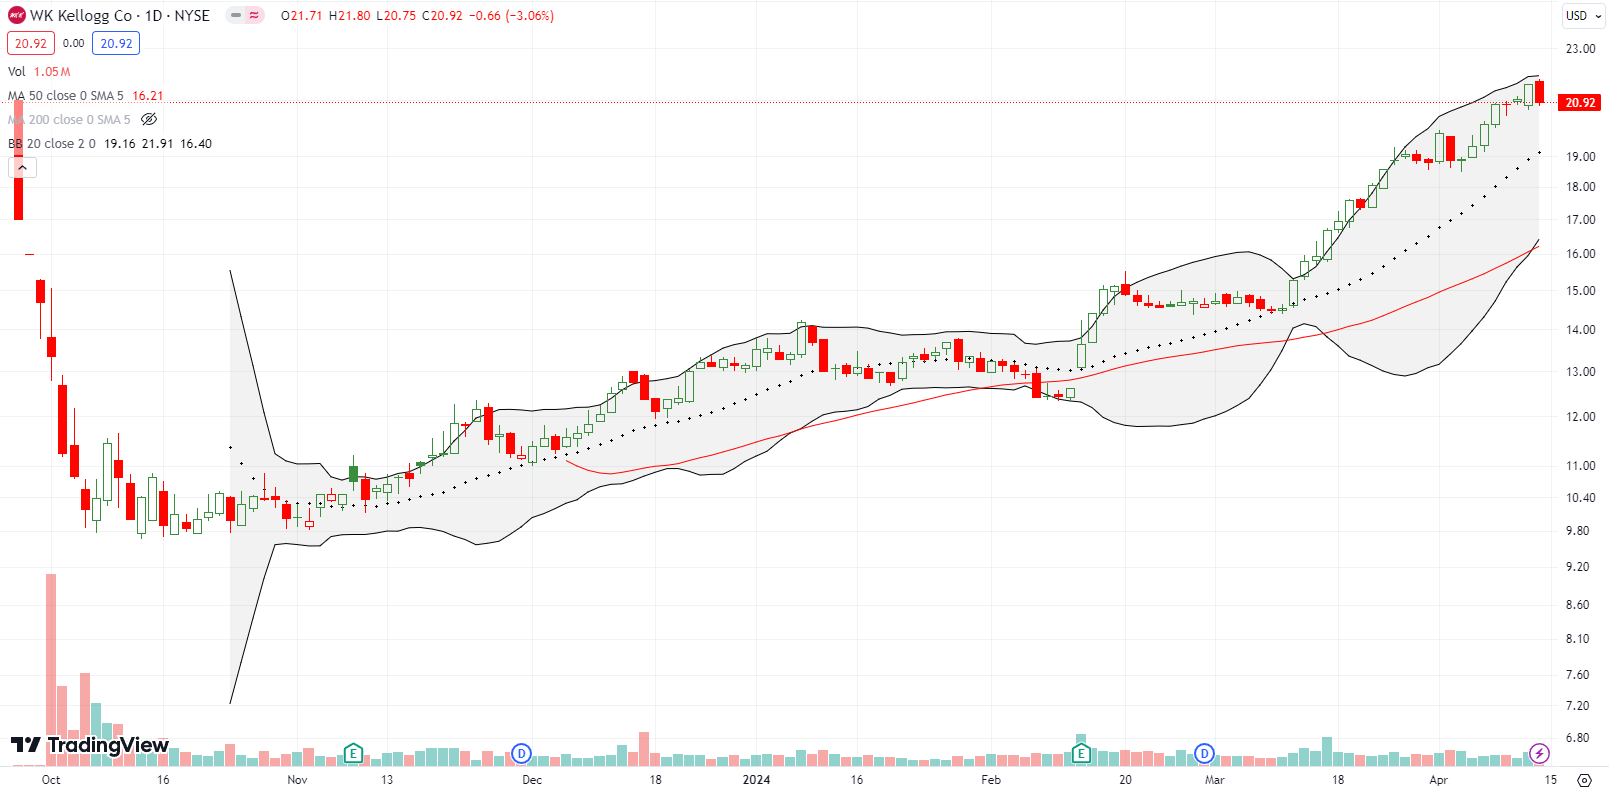
WW Kellogg Co (KLG), the cereal business spin-off from what is now called Kellanova (K), has had a strange but familiar journey. Sellers cut KLG in half within the first month of trading. I assume large investors were not interested in holding the spin-off. That “forced” selling created a great buying opportunity. In the book “You Can Be A Stock Market Genius” by Joel Greenblatt, I first learned about these situations where a spin-off gets sold to undervalued levels. After KLG finally looked like it attracted buying interest, I jumped aboard (remember, celebrate with buyers, do not argue with sellers). I took profits last month.
KLG continued its rally in April and now trades right at its opening price. Given the uptrend, KLG is still a buy on the dips. Someone out there still likes their breakfast cereal!
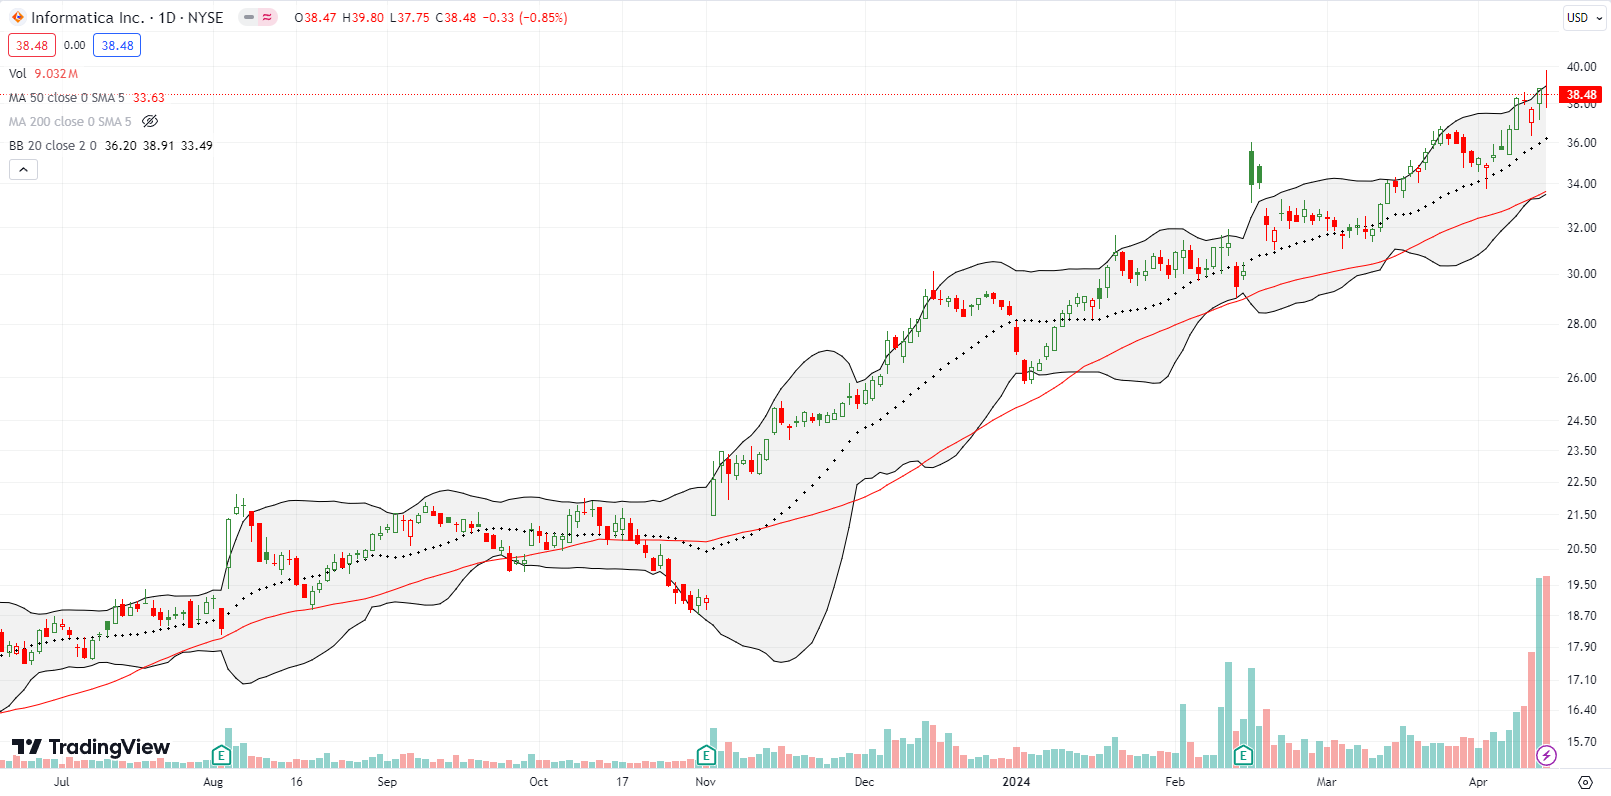
Informatica, Inc (INFA) just keeps motoring. This trade will be a case of lost opportunities. I made a successful pre-earnings trade by selling put options, but I once again neglected to buy shares on a subsequent dip. INFA’s rally could hardly be more orderly and predictable: the 20DMA has provided the majority of support in the uptrend since November’s post-earnings gap up.
Be careful out there!
Footnotes
Subscribe for free to get email notifications of future posts!
“Above the 50” (AT50) uses the percentage of stocks trading above their respective 50-day moving averages (DMAs) to measure breadth in the stock market. Breadth defines the distribution of participation in a rally or sell-off. As a result, AT50 identifies extremes in market sentiment that are likely to reverse. Above the 50 is my alternative name for “MMFI” which is a symbol TradingView.com and other chart vendors use for this breadth indicator. Learn more about AT50 on my Market Breadth Resource Page. AT200, or MMTH, measures the percentage of stocks trading above their respective 200DMAs.
Active AT50 (MMFI) periods: Day #97 over 20%, Day #95 over 30% (overperiod), Day #1 under 40% (underperiod ending 92 days over 40%), Day #3 under 50%, Day #9 under 60%, Day #64 under 70%
Source for charts unless otherwise noted: TradingView.com
Full disclosure: long VXX puts, short CDW, long IWM calls, long AAPL call spread, long MNDY put spread, long SLV covered call
FOLLOW Dr. Duru’s commentary on financial markets via StockTwits, Twitter, and even Instagram!
*Charting notes: Stock prices are not adjusted for dividends. Candlestick charts use hollow bodies: open candles indicate a close higher than the open, filled candles indicate an open higher than the close.


