
Stock Market Commentary
April showers have arrived in the form of stockdrops instead of raindrops. After a near relentless push higher every month since November, the S&P 500 is down 4.4% month-to-date. Both the S&P 500 and the NASDAQ have confirmed bearish breakdowns and the ETF of small caps, IWM, is again in a bear market. Yet, the stock market has flipped so quickly from buying bravado to rushing for the exits that market breadth is near oversold extremes. Moreover, April historically is, on average, the most benign month for drawdowns. For some, the collection of short-term price extremes (more below) make the market look oversold enough to buy. I am not ready or willing to skip ahead of the technicals like that. The bearish breakdowns taking the market to this point look like a significant turning point for the market. The following charts make the case…
The Stock Market Indices
The S&P 500 (SPY) has not experienced this kind of selling pressure since the October lows. The index is on a 4-day losing streak including a confirmed breakdown below support at its 50-day moving average (DMA). The S&P 500 is now working on closing a gap up from February 22, 2024. With the 20DMA (the dotted line) turning downward, the S&P 500 suddenly looks positioned for a test of (presumed) support at the former all-time high from 2021.
The chart below provides a visual on my short-term trading calls during this epic rally. Regular readers know that I was not able to act much on the bearish trading calls because signals either lacked confirmation and/or the bearish signals quickly vaporized. I finally created a more functional trading call labeled “skeptical” to more accurately reflect the realities of an index powering through bearish signals. Confirmation of underlying weakness finally arrived with a sharp reversal and bearish engulfing breakdown below 20DMA support. I have now returned the short-term trading call to cautiously bearish. Read below for important caveats and nuances on this call. For example, I bought a SPY call spread expiring on Friday as a small hedge on remaining bearish positions.
")
The NASDAQ (COMPQ) quickly reversed from an all-time high to a breakdown that looks even more bearish than the S&P 500’s breakdown. The tech-laden index mainly churned just above its former all-time high (from 2021) for 2 months, so this confirmed 50DMA breakdown looks a lot like exhaustion.
")
The iShares Russell 2000 ETF (IWM) finds itself in a bear market yet again. This familiar territory comes on the heels of a confirmed 50DMA breakdown. IWM looks exhausted and topped out. My languishing IWM calls look similarly burnt out!
")
The Short-Term Trading Call With Stocks Potentially Oversold Enough
- AT50 (MMFI) = 27.1% of stocks are trading above their respective 50-day moving averages
- AT200 (MMTH) = 50.2% of stocks are trading above their respective 200-day moving averages
- Short-term Trading Call: cautiously bearish
AT50 (MMFI), the percentage of stocks trading above their respective 50DMAs, closed at 27.1% as it speeds toward the oversold threshold at 20%. The breakdowns accompanying the plunge in my favorite technical indicator rubbed out the bullish taint on my skeptical trading call and transformed it to cautiously bearish. I fully recognize that I may need to quickly flip to (cautiously) bullish on oversold conditions. However, I want to be mentally prepared to fade the indices and stocks on tests of overhead resistance.
Given the combined surge in the VIX, the closes of the S&P 500 and the NASDAQ below their lower Bollinger Bands (BBs), and the speed of AT50’s decline, the stock market actually looks oversold enough for buyers to jump back into the fray at any time. In other words, I am prepared for the stock market to rebound sharply at any time. Accordingly, I took profits on a majority of my bearish positions and nibbled on some call options. From here, I will close out most of my remaining bearish positions whether as a stop loss or with more profits.
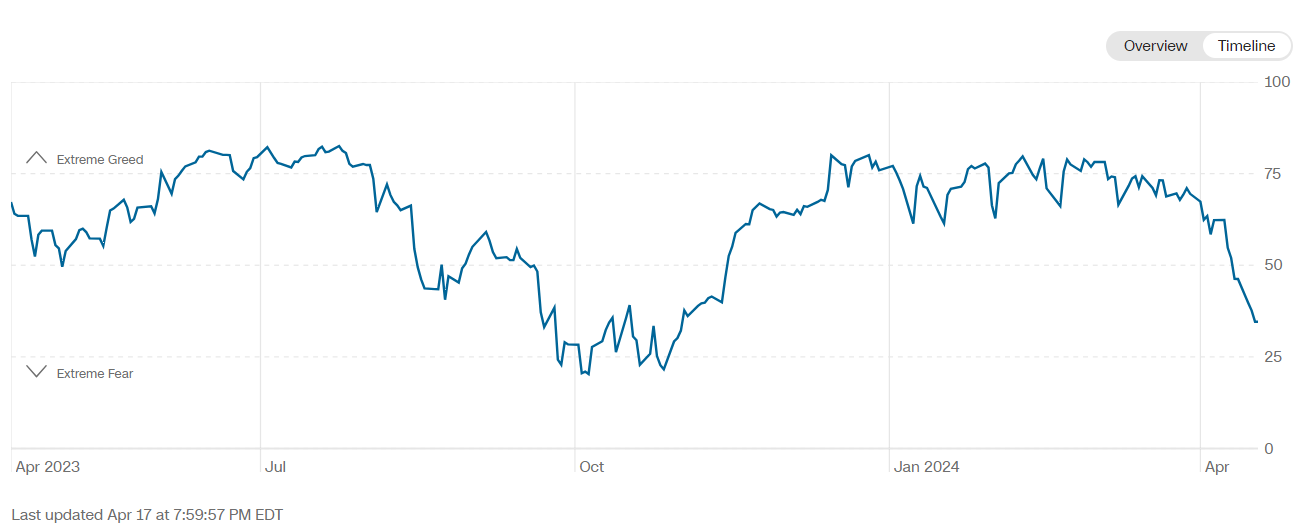
CNN’s Fear and Greed Index further highlights the rapid change in market sentiment. Just one week ago, this indicator was in neutral territory. The index was in greed territory just one month ago. Now, just like AT50, the Fear and Greed Index is speeding toward oversold conditions.
The VIX is a stock market star for a third straight week. On Monday, the VIX held close to its high of the day after surging to a 5+ month high. The faders did their usual the past two days but the VIX has managed to bounce off intraday lows. I see enough momentum here for an eventual test of the October highs. Such a move would no doubt coincide with an oversold AT50. In the meantime, a bounce from “oversold enough” conditions would send the VIX reeling back down before stabilizing for the next run-up.
")
Bond yields have flashed a “quiet” bearish signal all year. The market mostly ignored the overall uptrend in rates until now. Higher rates drive bond prices, like iShares 20+ Year Treasury Bond ETF (TLT), downward. Stocks typically prefer lower yields over higher. The correlation snapped back into place with a vengeance over the past week as rate cut expectations, hopes, and dreams keep shrinking and shrinking fast.
TLT has experienced some strong swings from various inflation data and shifting sands under the resulting Fedspeak. Through it all, TLT trended downward. The recent new lows for the year steepened the downward trajectory of the lower part of the channel. A continued rebound for TLT from here will support a rebound in stocks.
The discussion about interest rates has become more and more fascinating. The bond market clearly never quite believed in rate cuts. I am now hearing alternative narratives. Either bond yields reflect “higher for longer” Fed interest rates or they reflect a market more and more troubled by the coming need for the federal government to issue $10 TRILLION in new debt. You read that correctly; that amount is a whopping 1/3 of the entire GDP of the U.S. economy. Needless to say, the bond market will likely demand a nifty premium for all that debt….and I want to fade rallies in TLT. If stocks sink in conjunction with all that debt issuance, we have a first suspect for who is siphoning off the money.
")
If the VIX is the star of the show, Apple Inc (AAPL) is a distinct victim in the show. AAPL’s fortunes looked much better last week as AI rumors sent the stock soaring into 50DMA resistance. On Friday, I overlooked the rejection from that resistance and bought a call spread. Monday’s fade confirmed AAPL remains a victim of bearish sentiment; the move reminded me once again of the dangers of choosing discretion over the rules of technical trading. AAPL is right back to an important test of the October lows. I am NOT adding AAPL to my generative AI trade just yet! {4/19/24 correction: the chart below shows the October, 2023 low not an October, 2022 low}
")
My favorite hedge against bullishness finally cracked 20DMA support. Caterpillar Inc (CAT) has dropped ever so slowly the last 4 trading days. The stock looks set for an overdue test of 50DMA support, but buyers stepped in right at the lower Bollinger Band (BB). Earnings are next week.
")
Just one day after I wrote about Informatica Inc (INFA), the stock delivered a fresh buying opportunity. In one of the more strange M&A rumors, INFA dropped 6.5% on news that Salesforce.com (CRM) wants to buy the company for a lower price. Assuming shareholders would never agree to such a thing, I proceeded to buy the dip right at the last test of 20DMA support. INFA tested 50DMA support today.
")
")
")
Be careful out there!
Footnotes
Subscribe for free to get email notifications of future posts!
“Above the 50” (AT50) uses the percentage of stocks trading above their respective 50-day moving averages (DMAs) to measure breadth in the stock market. Breadth defines the distribution of participation in a rally or sell-off. As a result, AT50 identifies extremes in market sentiment that are likely to reverse. Above the 50 is my alternative name for “MMFI” which is a symbol TradingView.com and other chart vendors use for this breadth indicator. Learn more about AT50 on my Market Breadth Resource Page. AT200, or MMTH, measures the percentage of stocks trading above their respective 200DMAs.
Active AT50 (MMFI) periods: Day #100 over 20%, Day #98 over 30% (overperiod), Day #4 under 40% (underperiod), Day #6 under 50%, Day #12 under 60%, Day #67 under 70%
Source for charts unless otherwise noted: TradingView.com
Full disclosure: long VXX puts, long SPY call spread, long IWM calls, long CAT put spread, long AAPL call spread
FOLLOW Dr. Duru’s commentary on financial markets via StockTwits, Twitter, and even Instagram!
*Charting notes: Stock prices are not adjusted for dividends. Candlestick charts use hollow bodies: open candles indicate a close higher than the open, filled candles indicate an open higher than the close.
I rarely watch fast money, or any other video market commentary, these days. But every time I do watch fast money, I’m impressed over again with Karen Finerman’s just plain sanity, in a business that thrives on over-reaction to ephemera. In this clip, she calmly points out that current interest rates are historically slightly *below* average, and our economy has repeatedly thrived in our current situation.
I think there is something to be said for being 100% long equity! 🙂