Stock Market Commentary:
It took a mixed jobs report and soft economic data to spark late New Year’s cheer in the stock market. The December jobs report refreshed the message of a strong labor market whose unemployment rate has stayed between 3.5% and 3.7% the entire time the Federal Reserve has hiked interest rates. Yet, Wall Street seemed to take solace in slightly lower wage growth than “expectations.” Perhaps more importantly, the December ISM Non-Manufacturing Index fell to 49.6%. Economic contraction in the services industry occurs below 50%. The index was last below 50% almost three years ago. These two signs of softness are quite marginal, but the stock market celebrated with late New Year’s cheer anyway. This market is constantly grasping for any sliver of good news about inflationary pressures. The resulting rally was enough to grant the S&P 500 a 1.5% gain for the new year’s first week of trading.
The Stock Market Indices
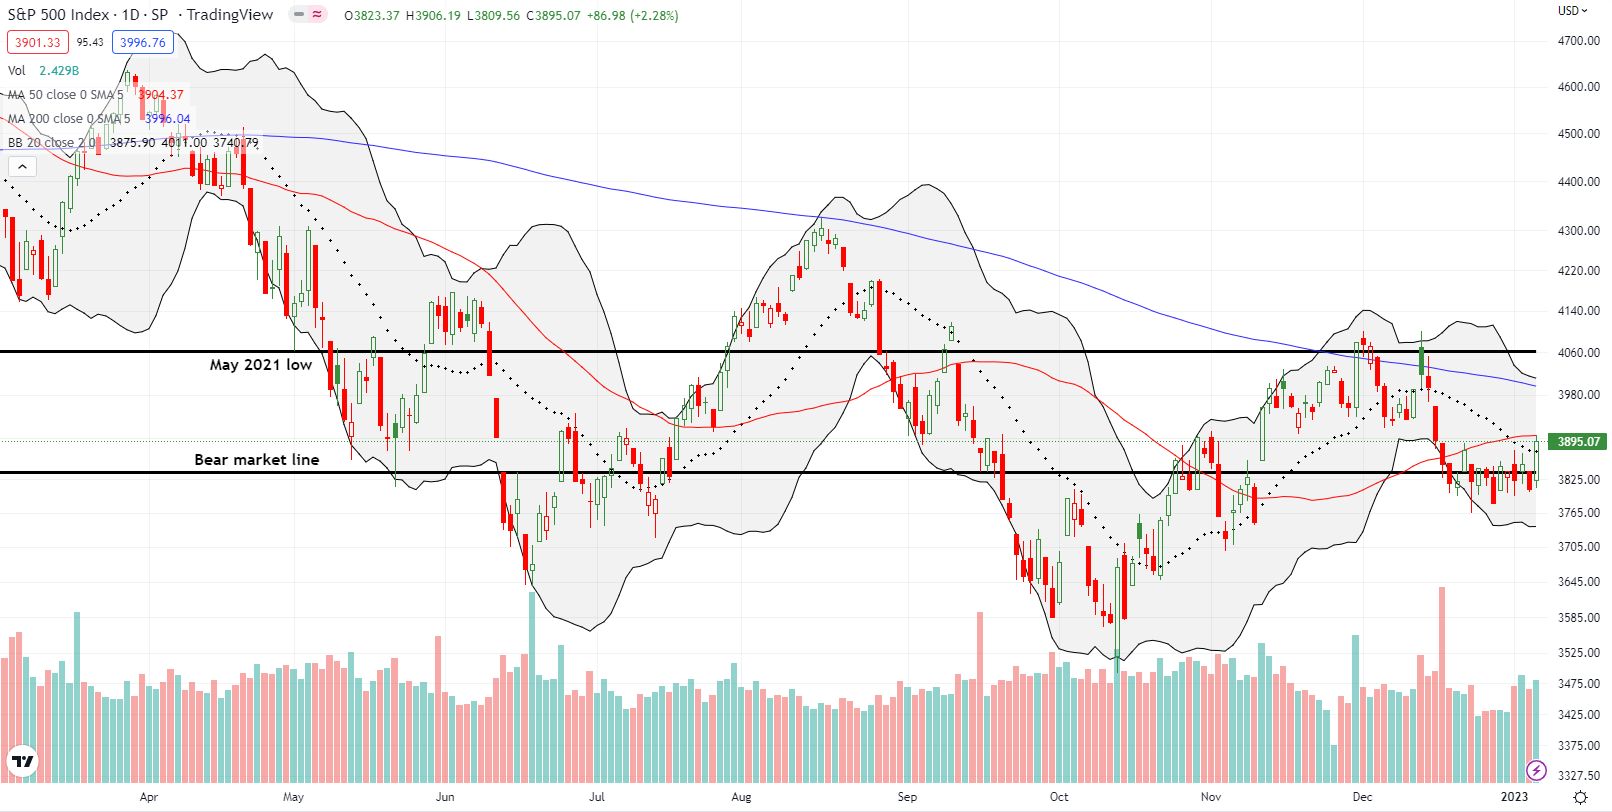
The S&P 500 (SPY) is finally separating from its bear market line. The index gained 2.3% on the day on its way to a challenge of overhead resistance from its 50-day moving average (DMA) (the red line below). The intraday high perfectly tapped the 50DMA. So with every trader watching this test, the big question is whether the index can smash through this resistance ahead of Thursday’s release of December’s CPI. Perhaps the S&P 500 can add to the drama with a rush to 200DMA resistance in time for the CPI news. Either way, bears now look hard-pressed to force the index below the December lows in time for earnings season.
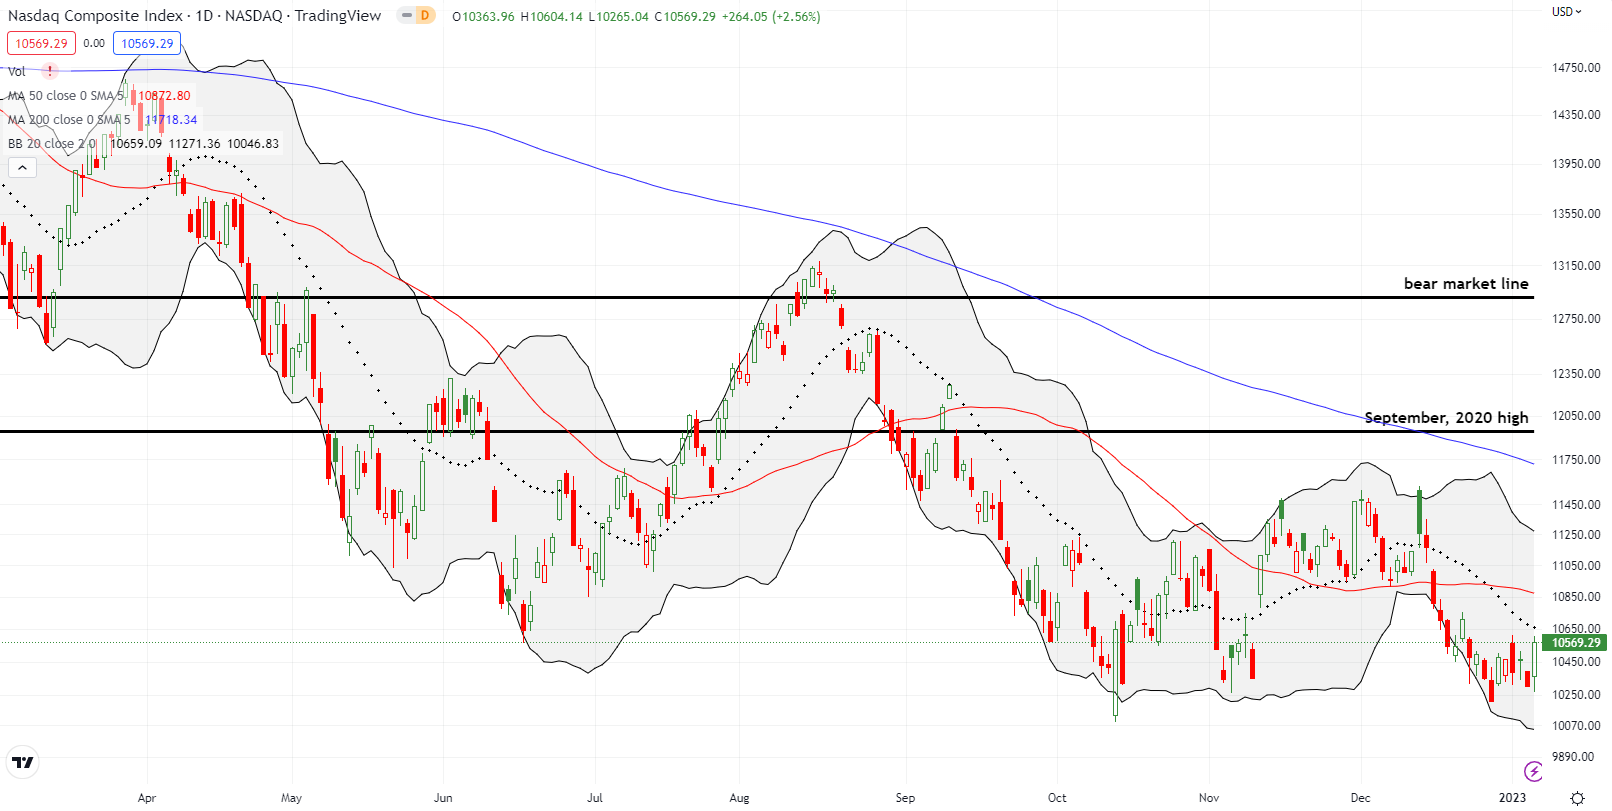
The NASDAQ (COMPQ) had a gain similar to the S&P 500’s, but it remains far behind on a technical basis. The tech-laden index did not quite tap downtrending 20DMA resistance (the dotted line), and 50DMA resistance is still a few daily rallies away. The NASDAQ also still looks more vulnerable than the S&P 500 to lower lows given last month’s breach. Accordingly, I used the rally to add another QQQ put spread. This trade is likely my last bearish move as I await a potential market push back to overbought trading conditions.
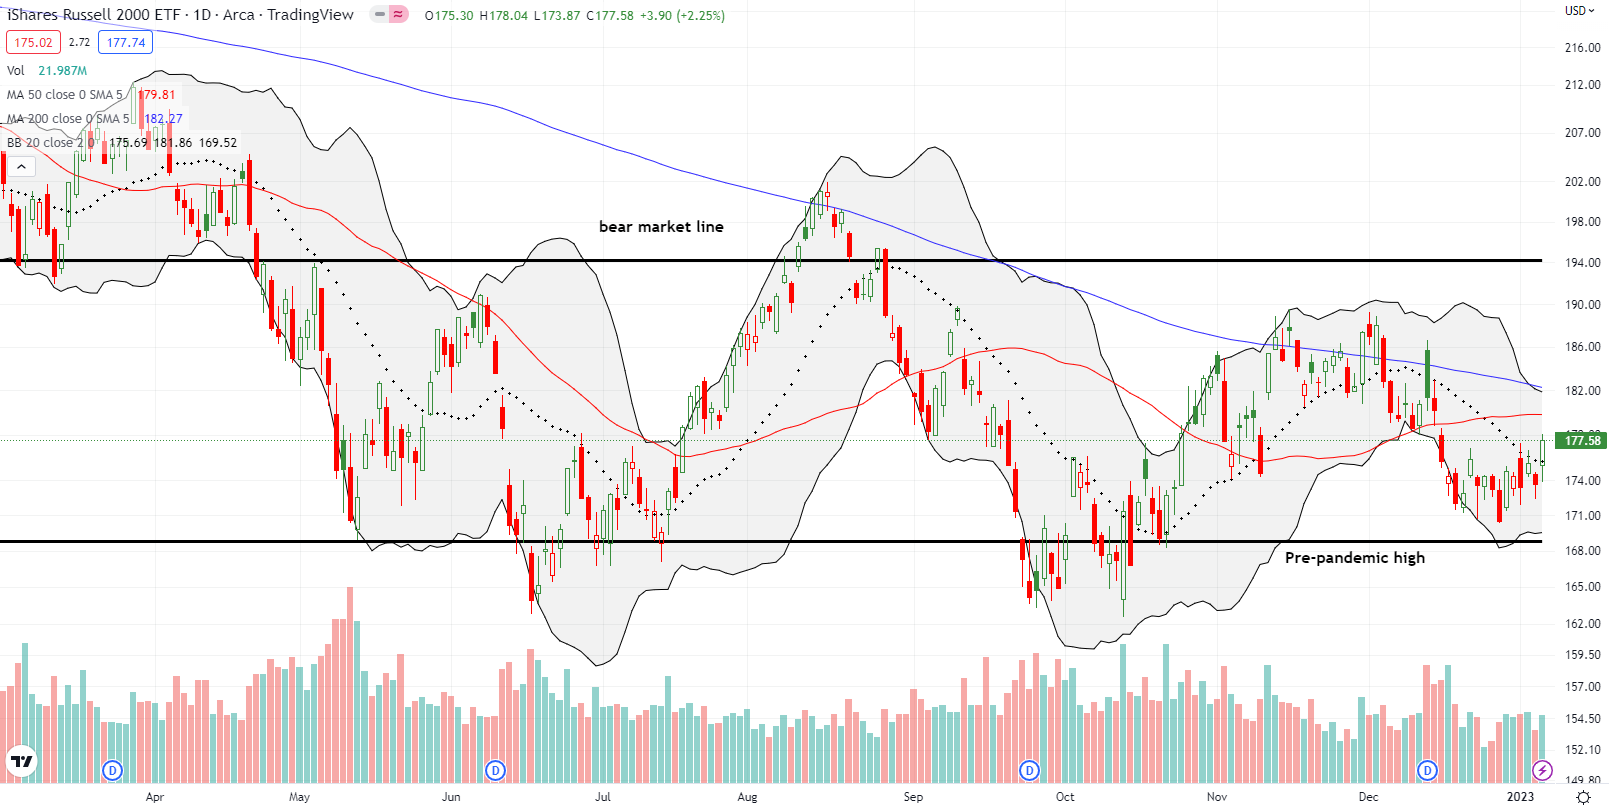
The iShares Russell 2000 ETF (IWM) cleared 20DMA resistance with a 2.3% gain. The ETF of small cap stocks faces a tough challenge ahead with converging 50DMA and 200DMA (the blue line) resistance. The pre-pandemic high looks like it survived as approximate support for now. Still, I added to my IWM put on the outside chance the ETF pulls back all over again. Like the QQQ put spread, this is my last bearish trade on IWM for this cycle.
Stock Market Volatility
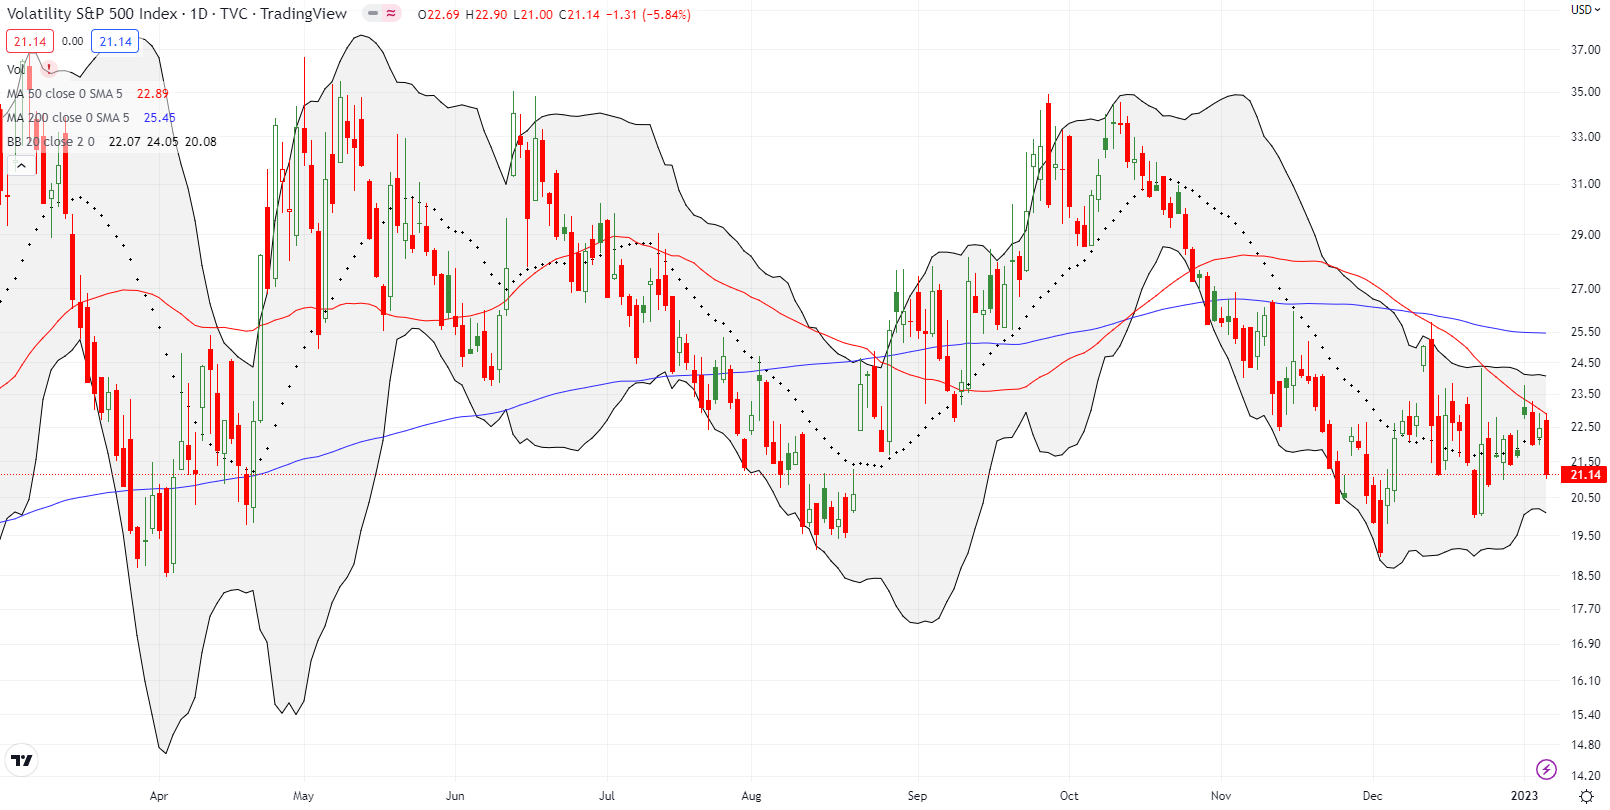
The volatility index (VIX) is not providing clear signals anymore. However, a fresh technical pattern may have emerged. I typically do not ascribe meaning to the moving averages for the VIX, but in this moment the VIX’s 50DMA is acting like a tight ceiling. As this resistance holds, the runway for bearishness shortens. A 50DMA breakout would of course invalidate this signal.
The Short-Term Trading Call With Late New Year’s Cheer
- AT50 (MMFI) = 52.1% of stocks are trading above their respective 50-day moving averages
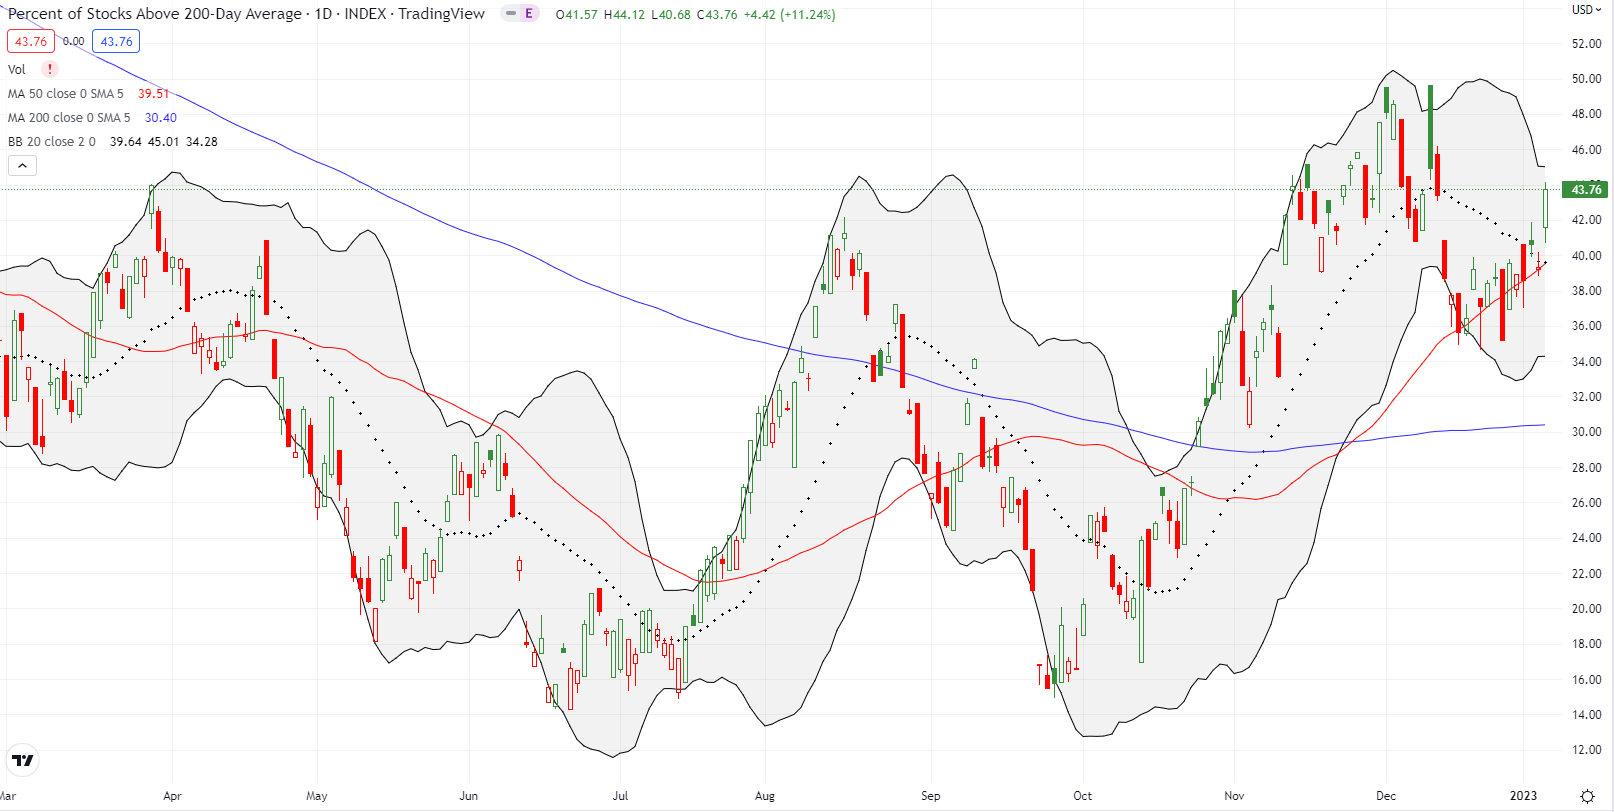
- AT200 (MMTH) = 43.8% of stocks are trading above their respective 200-day moving averages
- Short-term Trading Call: cautiously bearish
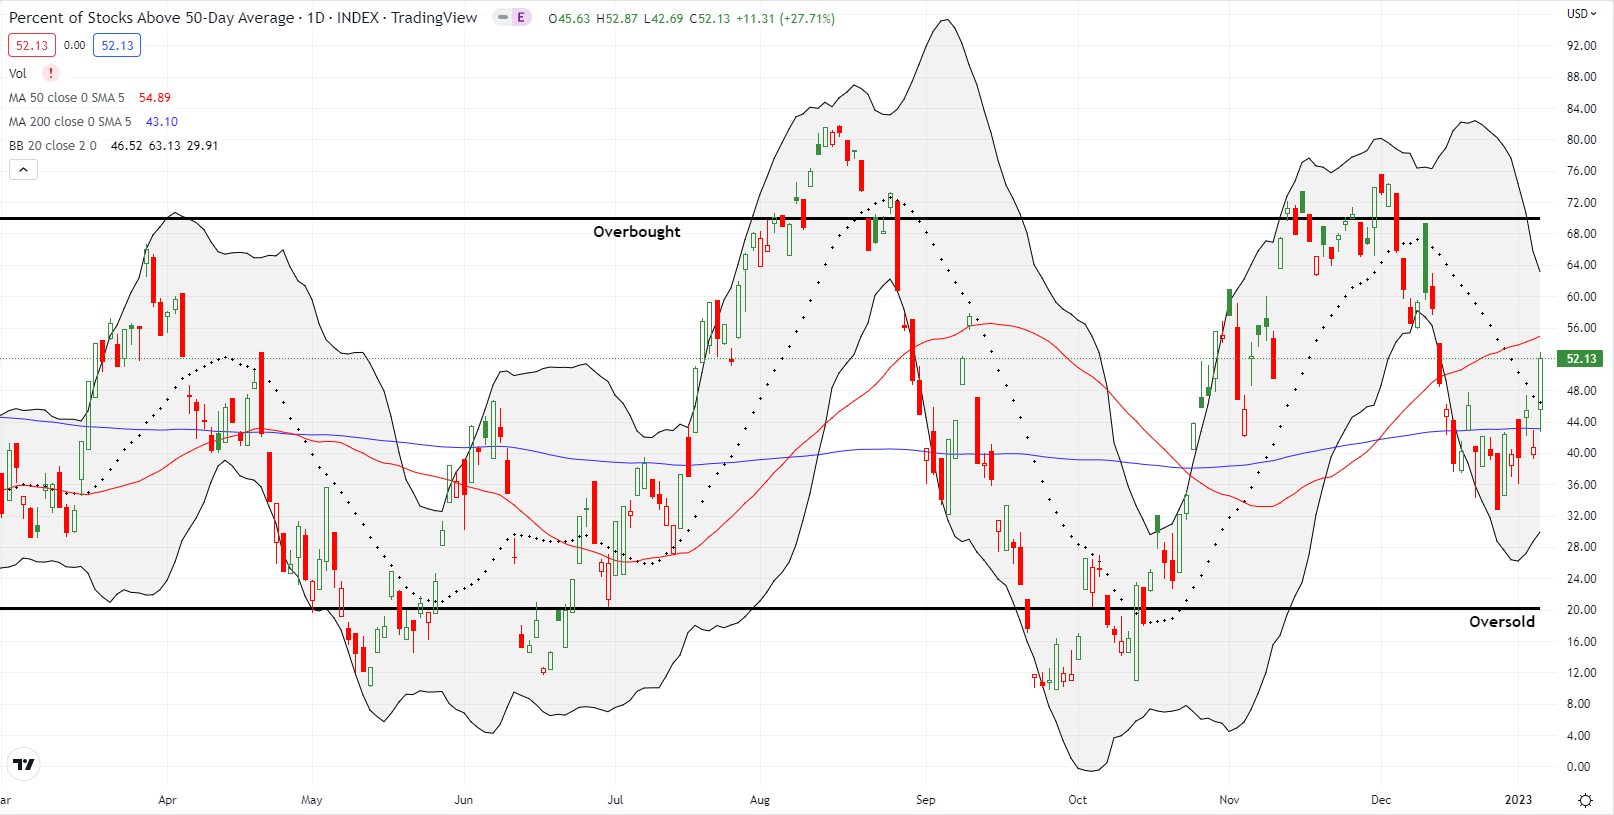
AT50 (MMFI), the percentage of stocks trading above their respective 50DMAs, surged along with the stock market. My favorite technical indicator provided definitive validation of the day’s rally. AT50 jumped from 40.8% to 52.1%. This big move demonstrates substantial and broad buying pressure in the market. The breakout for AT50 clears a path for imminently testing overbought trading territory (threshold at 70%). Typically, under these conditions, I would take a cautiously bearish short-term trading call down to neutral. However, as I have stated earlier, I want to keep focused on the overall bearish setup in the market. Even with AT50 hitting “close enough to oversold” territory last month, I see trouble ahead when/if AT50 returns to overbought status.
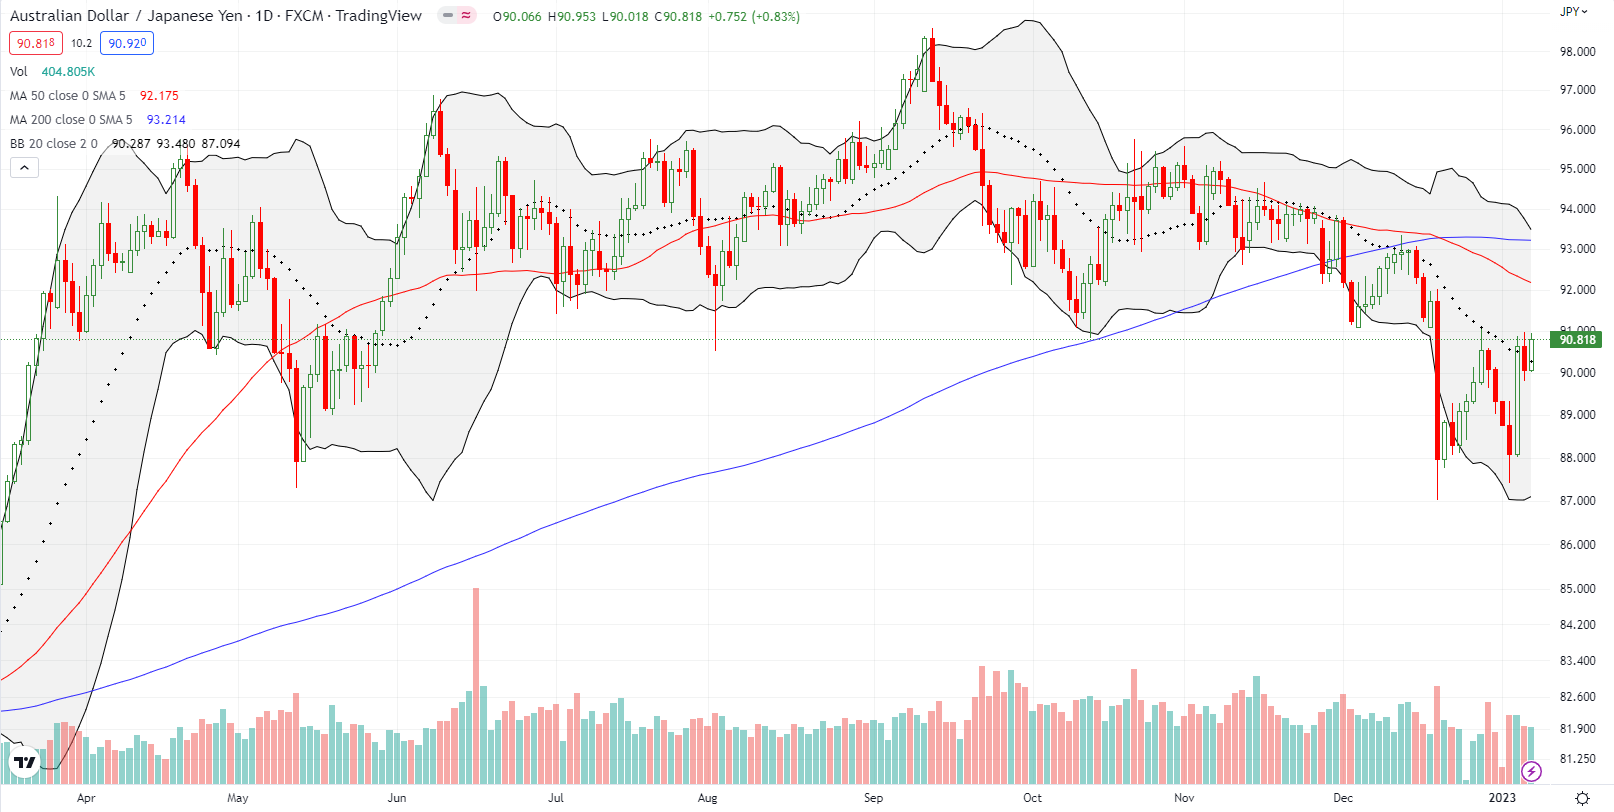
The Australian dollar vs the Japanese yen (AUD/JPY) added to the more constructive setup in financial markets. This currency-based proxy for market sentiment recovered from a dramatic reversal to end the week at a marginally higher close. Positioned above its 20DMA resistance, the rebound could easily continue to 50DMA resistance. Such a move should accompany a higher stock market.
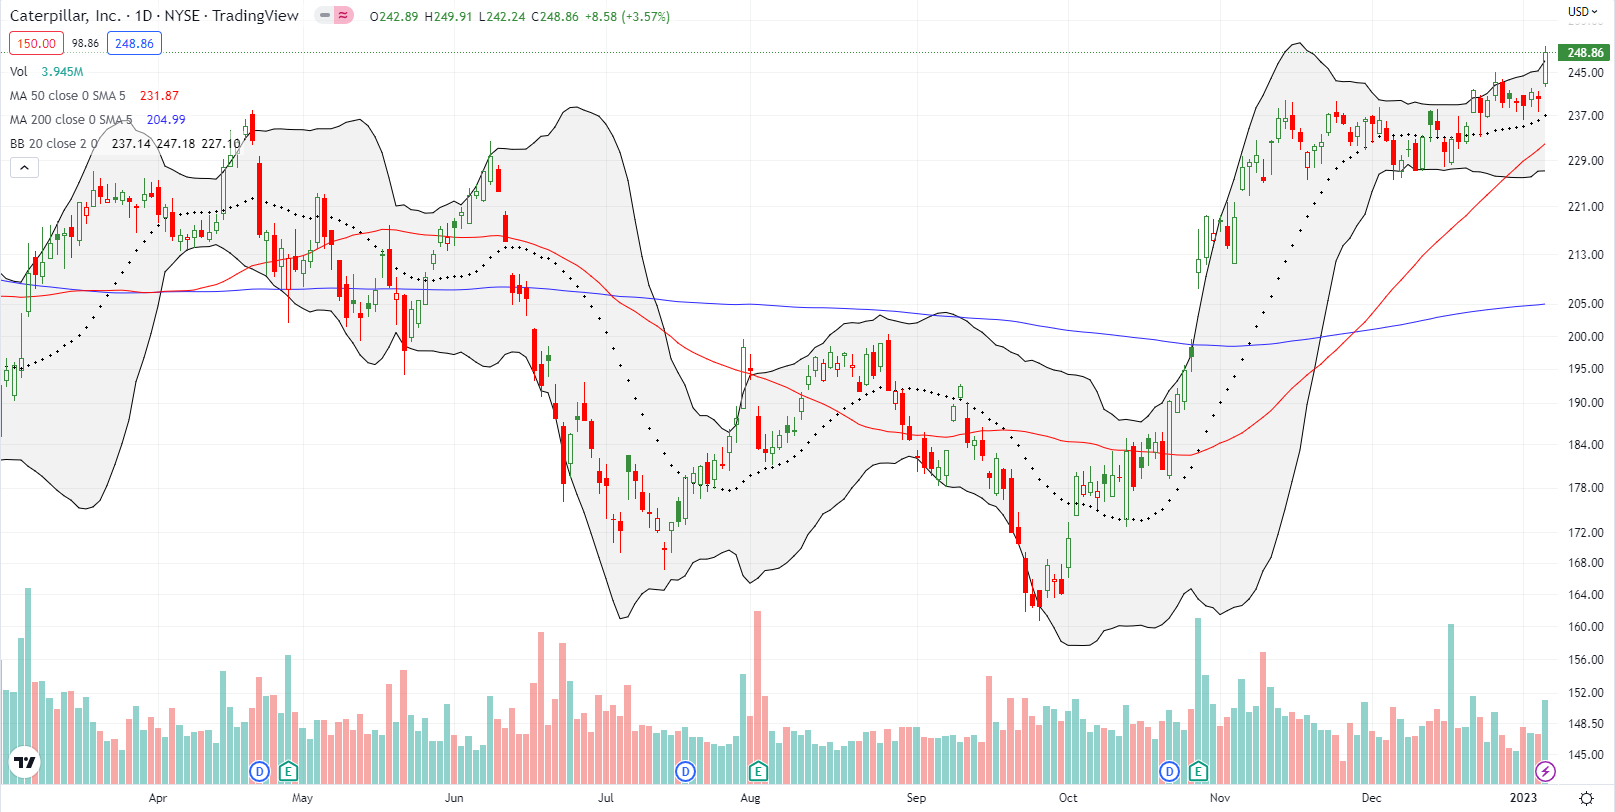
When I last described the market’s path of least resistance as pointing upward, I identified Caterpillar Inc (CAT) as a trading exception to my bearishness. CAT broke out the next trading day, and I moved on a calendar call position. Suspecting CAT would trade slowly, I took on more risk on the short side of the calendar call. I bought a Dec 30 $245/ Jan 20 ’23 $250 calendar call. CAT proceeded to drift, and the short December call expired worthless. Friday’s breakout to an all-time high brought the long side to even. I went ahead and closed out the position satisfied with achieving all the profit from the short side of the trade. These kinds of potential outcomes make calendar spreads my preferred trade on short-term momentum where I expect delayed follow-through.
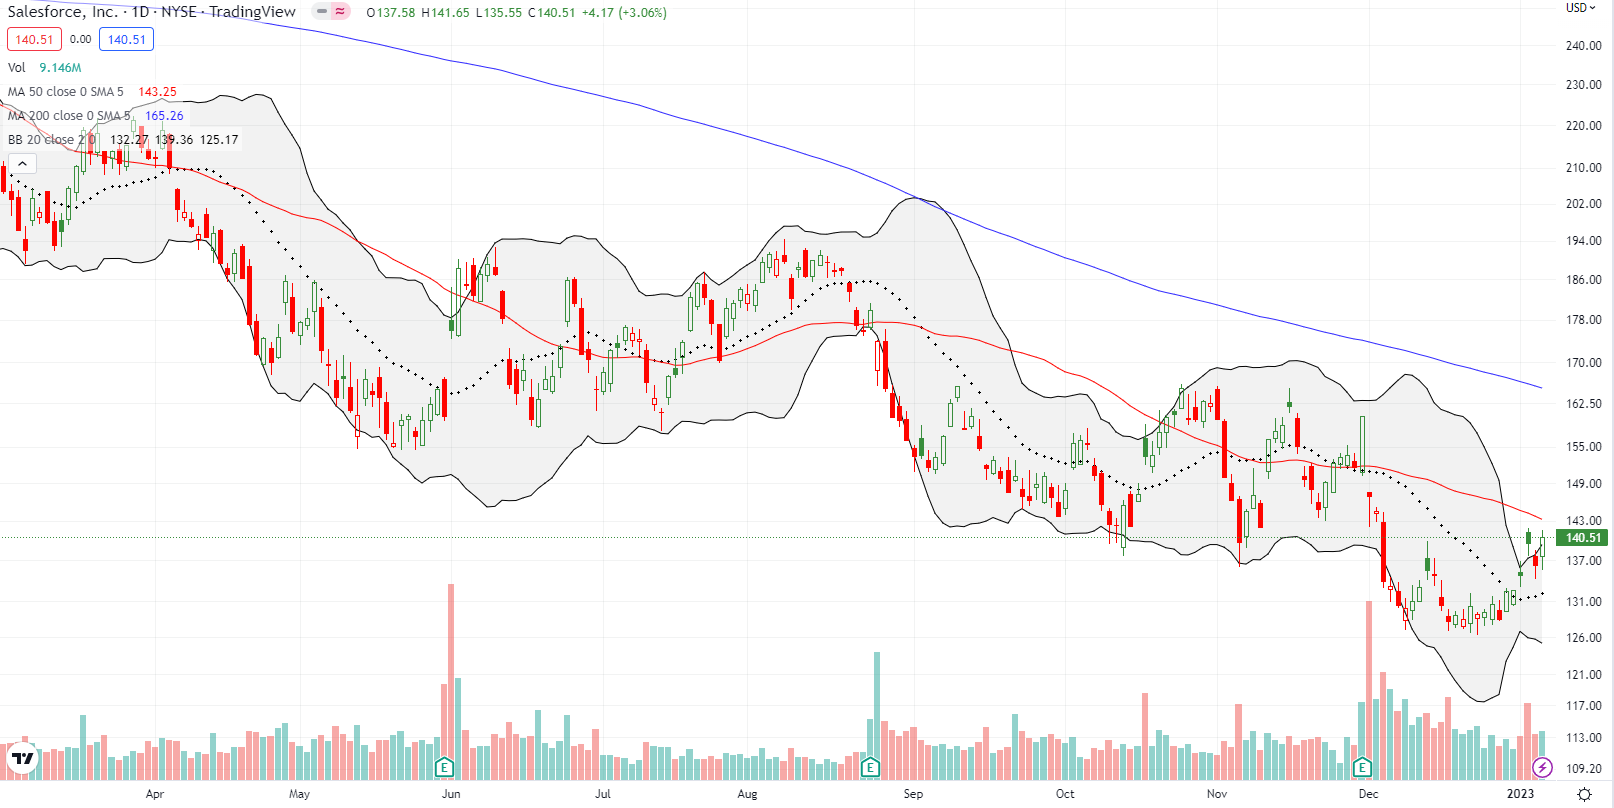
Salesforce, Inc (CRM) put the contrariness of Wall Street’s economic logic on full display. After the company announced massive layoffs, CRM gapped higher to a 3.6% gain and closed just below 50DMA resistance. Bearish market forces took over the very next day and wiped out those gains. Friday’s 3.1% rally revived the layoff celebration all over again. Since that rally was likely in sympathy with the market’s rally, CRM still looks vulnerable to its declining 50DMA resistance.
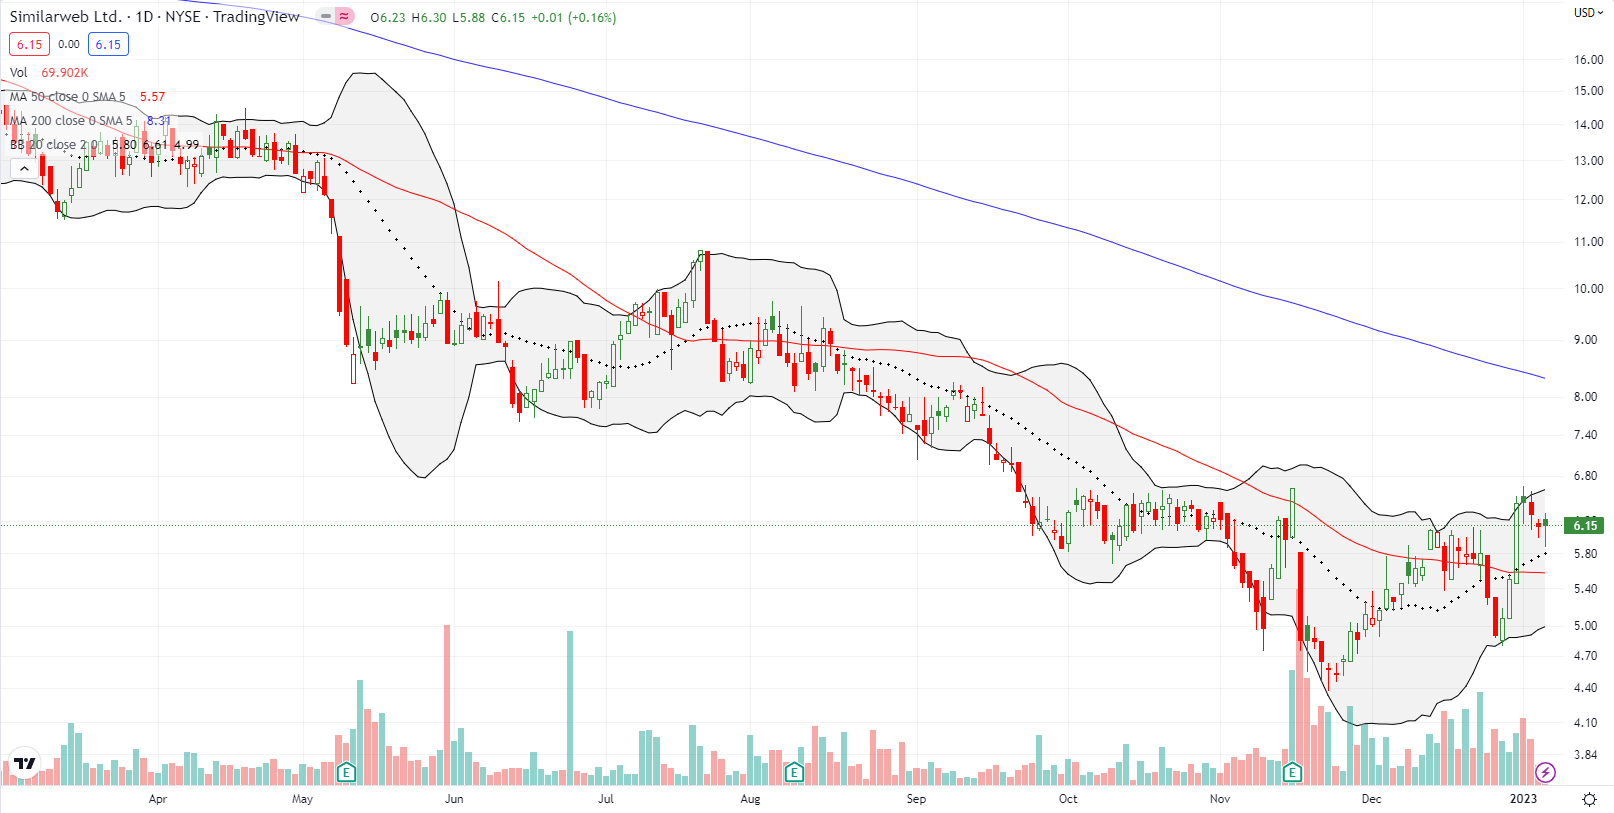
Similarweb Ltd (SWMB) is one of a few beaten up software stocks I am tracking for buying opportunities, whether for a relief rally or a longer-term recovery play; I used Similarweb’s competitive market analysis platform in a prior job. I completely missed the three-day surge into the end of last year. That buying looks like it already exhausted interest as SMWB failed to benefit from Friday’s run in the market. In fact, SMWB at one point slouched into 20DMA support. Still, with a 50DMA breakout awaiting confirmation, I see a bullish opportunity if the stock can clear the closing high from 4 trading days ago. I would target a run to 200DMA resistance. If the market was not overall bearish, I would take a chance on a buy right here.
Be careful out there!
Footnotes
“Above the 50” (AT50) uses the percentage of stocks trading above their respective 50-day moving averages (DMAs) to measure breadth in the stock market. Breadth defines the distribution of participation in a rally or sell-off. As a result, AT50 identifies extremes in market sentiment that are likely to reverse. Above the 50 is my alternative name for “MMFI” which is a symbol TradingView.com and other chart vendors use for this breadth indicator. Learn more about AT50 on my Market Breadth Resource Page. AT200, or MMTH, measures the percentage of stocks trading above their respective 200DMAs.
Active AT50 (MMFI) periods: Day #58 over 20%, Day #54 over 30%, Day #3 over 40%, Day #1 over 50% (overperiod), Day #22 under 60%, Day #24 under 70%
Source for charts unless otherwise noted: TradingView.com
Full disclosure: long IWM put, long QQQ put spreads
FOLLOW Dr. Duru’s commentary on financial markets via StockTwits, Twitter, and even Instagram!
*Charting notes: Stock prices are not adjusted for dividends. Candlestick charts use hollow bodies: open candles indicate a close higher than the open, filled candles indicate an open higher than the close.


