

Stock Market and Inflation: Understanding the Impact of the Consumer Price Index (CPI) Report
Soon after the Federal Reserve started tightening monetary policy, the stock market started acting like the Fed will see evidence that inflation is actually not a problem and thus plateau or pivot on rate hikes. Yet, the Fed said no in 2022, consistently and persistently. The desperate longing for the Fed to return to its standard policy of accommodating financial markets has created additional sources of volatility. In this context, the report on the Consumer Price Index (CPI) provided by the U.S. Bureau of Labor Statistics has taken on much more importance than usual. Last September, the CPI report helped to bring an abrupt and bearish end to a breakout for the S&P 500 (SPY). Last October, the CPI report came in hotter than “expectations”, yet the S&P 500 reversed sharply. The move created a bottom that still holds. Suddenly, traders need to pay attention the CPI surprise created by the gap between expectations and actuals for the CPI report.
Inflation Nowcasting: A Robust Standard for Forecasting
Conventional financial media uses a consensus of economics and/or analysts/pundits to measure expectations for a given financial metric. When it comes to inflation, many have opinions, but the Federal Reserve Bank of Cleveland creates a robust standard for forecasting inflation. The Cleveland Fed developed “inflation nowcasting” which estimates real-time inflation which in turn provides a projection for the next monthly CPI report. From the Cleveland Fed:
“Our inflation nowcasts are produced with a model that uses a small number of available data series at different frequencies, including daily oil prices, weekly gasoline prices, and monthly CPI and PCE inflation readings. The model generates nowcasts of monthly inflation, and these are combined for nowcasting current-quarter inflation. As with any forecast, there is no guarantee that these inflation nowcasts will be accurate all of the time. But historically, the Cleveland Fed’s model nowcasts have done quite well—in many cases, they have been more accurate than common benchmarks from alternative statistical models and even consensus inflation nowcasts from surveys of professional forecasters.”
The chart below shows the percentage difference between the inflation nowcast and the actual core CPI since the month before the Fed started hiking rates. (As a reminder, core CPI excludes food and energy from the CPI). I used the inflation nowcast the day before the CPI report as representative of the best possible forecast.
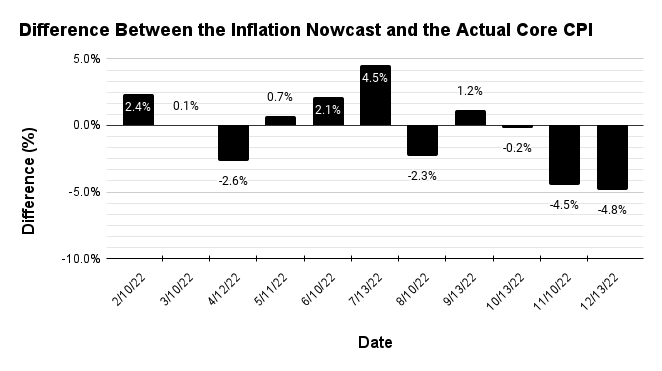
Inflation forecasting is difficult. The inflation nowcast shows a few notable, yet statistically insignificant, differences from actual. Last month’s particularly large core CPI surprise came from a 6.26% nowcast versus a 5.96% actual. Yet, in a market grasping for reasons to believe that peak inflation is creating an imperative for the Fed to reverse course, these small differences can loom large. The next chart overlays the performance of the S&P 500 (SPY) at the close following the day’s CPI release. The directional relationship between a core CPI surprise and the index’s performance is very clear.
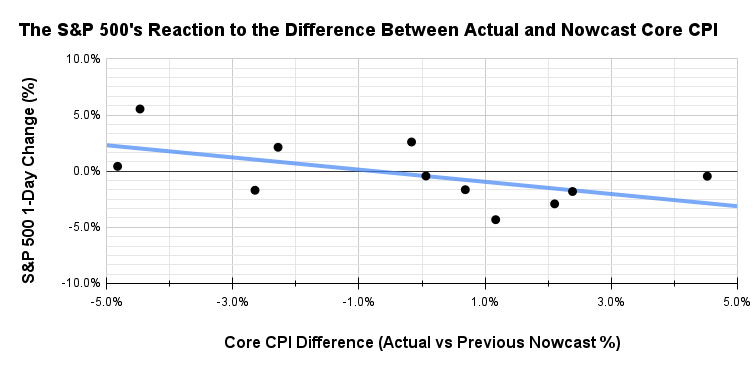
The blue line provides a trendline that approximates a linear relationship between the actual and nowcast core CPI. The correlation between these two measures is -0.57. The inverse correlation is not as strong as it otherwise could be. The degree of surprise in the CPI will leave a different impact depending on existing sentiment and trends. Still, of the 11 CPI reports here, only one failed to produce an inverse relationship. On April 12th, the actual core CPI of 6.47% came in under the nowcast core CPI of 6.65% for a gap of -2.6%. The S&P 500 fell anyway by 1.7%.
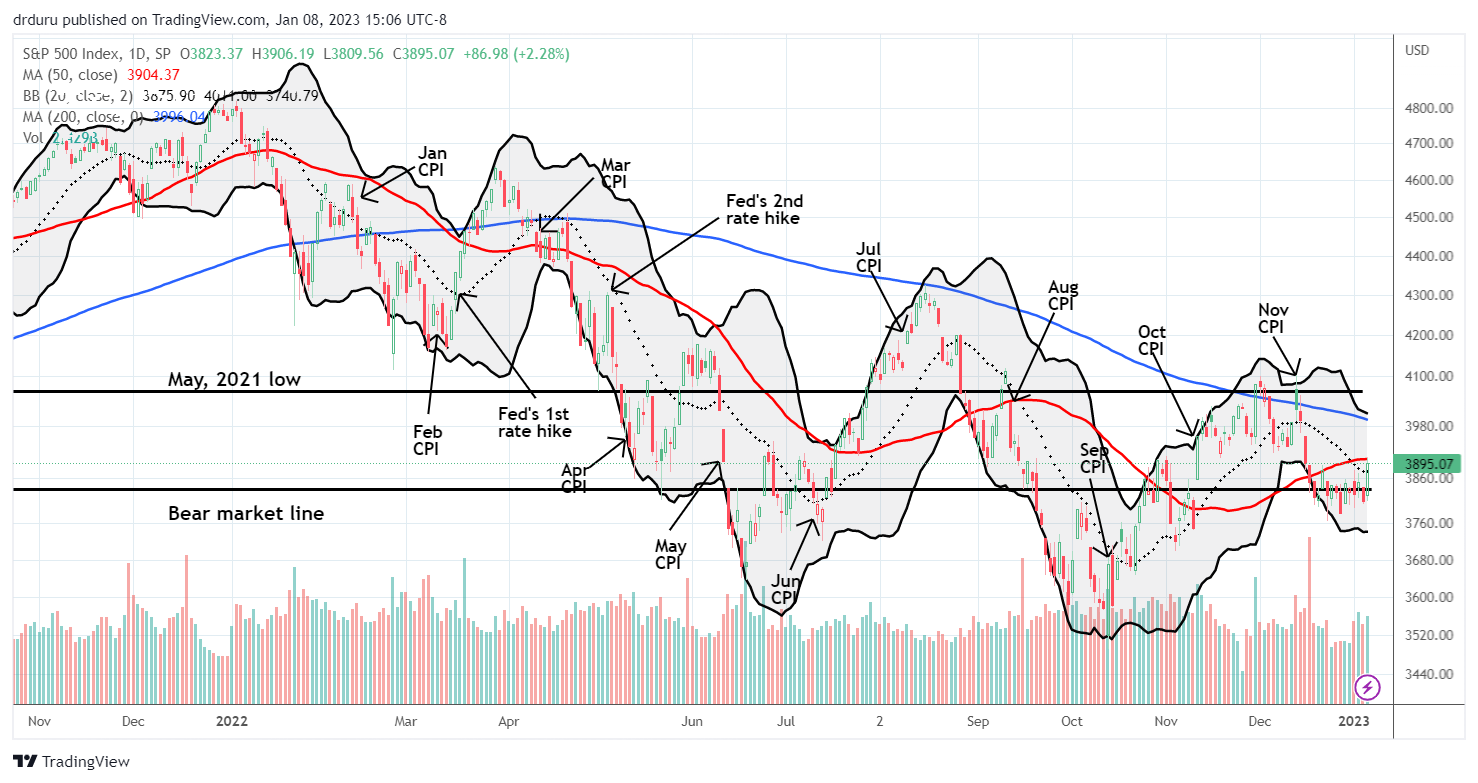
The chart below overlays a timeline of CPI changes and the first two rate hikes on the S&P 500.
Making The Trade: Using the Inflation Nowcast
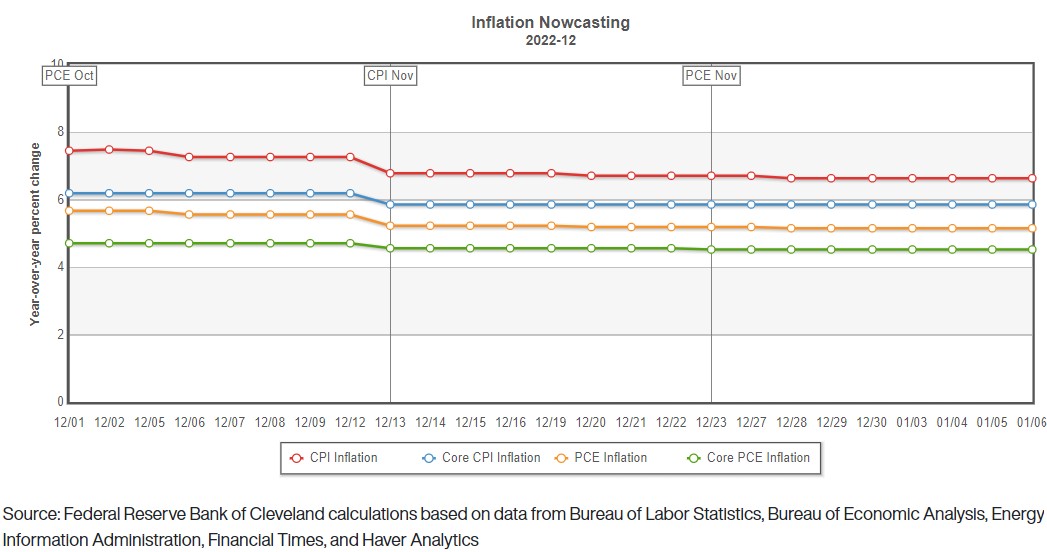
The inflation nowcast is relatively stable over stretches of weeks and can be used as a reliable tool to cut through the noise of other analysts and pundits offering their opinions. The screenshot below shows the time series of the nowcast last month, highlighting the relative stability of the forecast.
The relative stability allows me to treat the last nowcast before the CPI report as the best forecast available. If I think the nowcast core CPI has a better than 50/50 chance to undershoot actual core CPI, then I want to bet against the S&P 500. If I think the nowcast core CPI has a better than 50/50 chance to over-estimate actual core CPI, then I want to bet bullishly on the S&P 500. The difficulty is in the details.
Since I do not dare to think I can conjure up a better forecast than the nowcast, it is more fruitful to think through potential scenarios. For a trade ahead of the CPI, I can consider the past record of surprises. The nowcast over-estimated the actual CPI 4 out of the last 5 reports. The S&P 500 had large inverse reactions 4 out of 5 times. Accordingly, I want to bet the nowcast is more likely to eliminate some its recent bias and undershoot the January report. The January nowcast is currently 5.87% which is a small drop from December’s actual CPI of 5.96%. I would more comfortably bet on an underestimate with a larger gap.
If I instead choose to trade after the CPI report, I have to make a real-time assessment whether I think the open sufficiently reflects the level of surprise.
This analysis is learning in progress. I will post my thinking and results from January’s CPI report in the comments below. I stored the data and analysis in a Google sheet.
Be careful out there!
Full disclosure: no positions
“I want to bet the nowcast is more likely to eliminate some its recent bias and undershoot the January report.”
Absent a change in how the nowcast is calculated – which seems to me unlikely given its high level of success – why and how would the bias be reduced or eliminated?
My guess is that the statisticians will tweak the calculation to eliminate the consistent over-estimate. That change will in turn increase the chance that the actual comes in hotter than the forecast. A good forecast should be as likely to over-predict as under-predict the actual.