
Stock Market Statistics
- AT40 = 41.8% of stocks are trading above their respective 40-day moving averages (DMAs) (ranged from 25.8% to 42.8%)
- AT200 = 42.6% of stocks are trading above their respective 200DMAs (ranged from 39.2% to 45.5%)
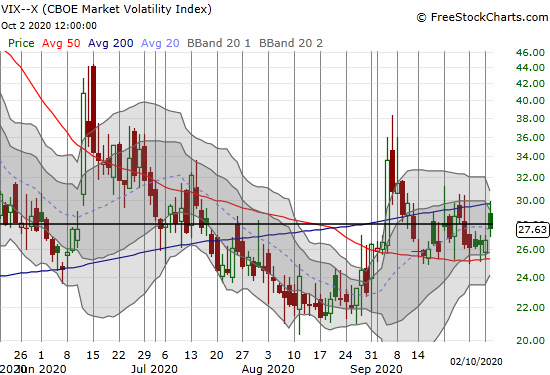
- VIX = 27.6
- Short-term Trading Call: cautiously bullish
Stock Market Commentary
Last Friday was the kind of day that made me completely forget about the latest jobs report (for September). I neglected to check in on a LOT of stock-specific news. The stock market gapped down under the weight of news that U.S. President Donald Trump became one of the world’s latest cases of coronavirus (COVID-19) infections. After the dust settled on the day, a surprising bullish divergence emerged with the S&P 500 (SPY) and NASDAQ (COMPQX) closing in weakness and small caps, financials, home builders, and even retail closing with strength. AT40 (T2108), the percentage of stocks trading above their respective 40-day moving averages (DMAs), signaled the bullish divergence by closing with a GAIN that effectively filled the gap from the big down day on September 21st.
The Stock Market Indices
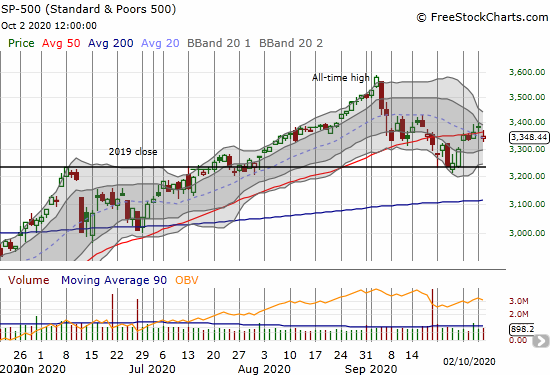
The S&P 500 (SPY) ended the day with a loss of 1.0% after sellers rejected the index from overhead 50DMA resistance.
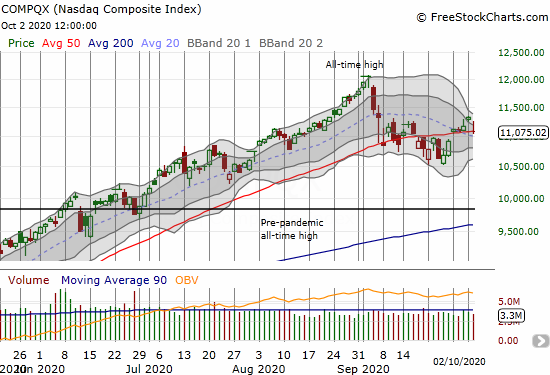
The NASDAQ (COMPQX) rebounded intraday and almost filled its entire gap down. Sellers took over from there and made sure to submerge the NASDAQ beneath 50DMA support and a 2.2% loss.
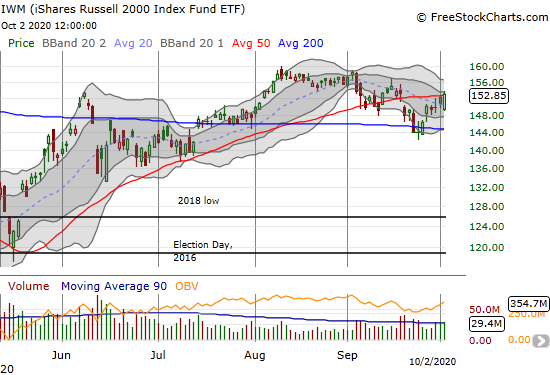
The losses on those major indices delivered the markings of an ugly day on the stock market. However, in many other places, stocks rallied enough to leave the day with gains and create a bullish divergence. For example, the iShares Russell 2000 Index Fund ETF (IWM) rallied back to a 0.4% gain. IWM gave its 50DMA resistance a “love tap” for the second straight day.
Stock Market Volatility
The volatility index (VIX) showed some signs of stress in the market. However, the faders went to work to shrink the VIX’s gain to 3.5% on the day. The faded mini-pops may be letting off enough steam to soften up support at the VIX’s 50DMA. Yet, I still cling to the expectation that the VIX has at least one more major pop coming in the near-term.
The Short-Term Trading Call With Bullish Divergence
When the S&P 500 and my favorite technical indicator, AT40, move in significantly opposite directions, the shifts create a divergence. This divergence is bullish because it contradicts the otherwise bearish move in the S&P 500. The fresh 50DMA breakdown for the S&P 500 left behind a 1-day false 50DMA breakout. AT40 tells me to expect an imminent recovery as the relatively stronger stocks lead the way; AT40 is the truer tell of the market.
As a result, I am not following the 50DMA breakdowns to downgrade my short-term trading call from cautiously bullish. The bullish divergence leaves my trading call well intact. Moreover, AT40 is too close to oversold to flip me bearish anyway. At worst, an invalidation of the bullish divergence would send me neutral.
Stock Chart Reviews – Below the 50DMA
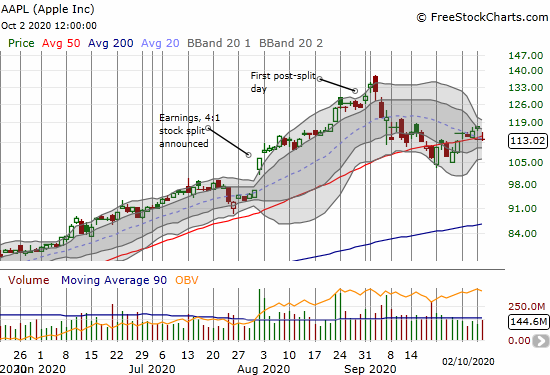
Apple (AAPL)
Apple (AAPL) helps explain what happened to the S&P 500 and the NASDAQ. AAPL, along with other big cap tech, weighed on the indices. Presumably, these still bloated stocks became a source of funds to buy the other “bargains” created in the rest of the stock market. A key tell will be what kind of follow-through happens in the wake of the bullish divergence. In other words, do Friday’s winners continue moving forward no matter what big cap tech does?
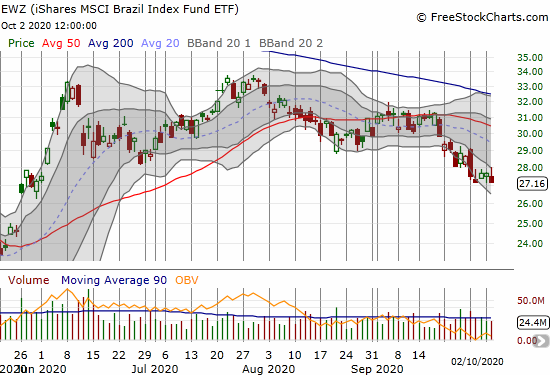
iShares MSCI Brazil Index Fund ETF (EWZ)
The iShares MSCI Brazil Index Fund ETF (EWZ) closed at its low of the day and a 4-month low. EWZ is close to triggering my “20% rule” where I buy the ETF after a decline of at least 20% from the most recent high. The trigger point is $26.78/share.
Nordstrom Inc (JWN)
Nordstrom (JWN) was on my buy list after Thursday’s close. JWN jumped 5.7% off an 11 1/2 year low. As with other speculations on JWN, I assume upside is capped. I bought Nov $15 call options to allow for some potential churn in October. JWN should benefit from follow-through in retail stocks.

Stock Chart Reviews – Above the 50DMA
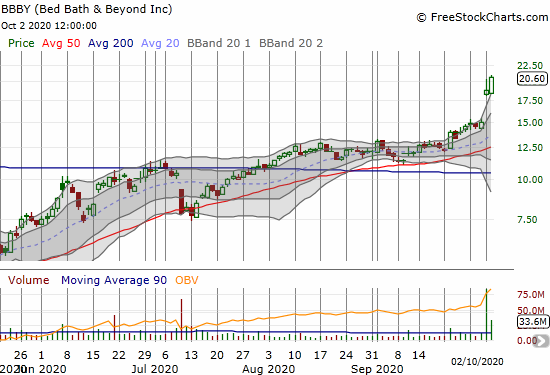
Bed Bath & Beyond (BBBY)
Bed Bath & Beyond (BBBY) was part of a startling retail sector. BBBY soared 25.1% post-earnings on Thursday. The stock barely blinked on Friday’s open and followed through with a 9.9% gain. BBBY fell as low as $3.56 on April 2nd. The uptrend since then defies the odds. I am sure I am not alone in assuming the economic crisis driven by the coronavirus pandemic would extinguish Bed Bath & Beyond. Instead, the stock is a buy on the dips.
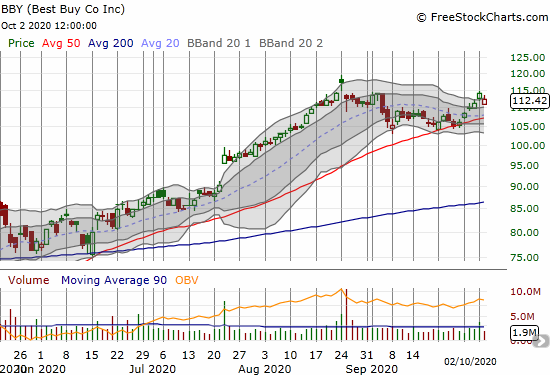
Best Buy (BBY)
Best Buy (BBY) lagged other retailers on the day. Still, the stock is on a firm comeback trail. BBY bounced perfectly off 50DMA support in September. The post-earnings abandoned baby top in August still stands as an ominous top. BBY returns to fully bullish form on a break to a new all-time high. It flips bearish on a 50DMA breakdown.
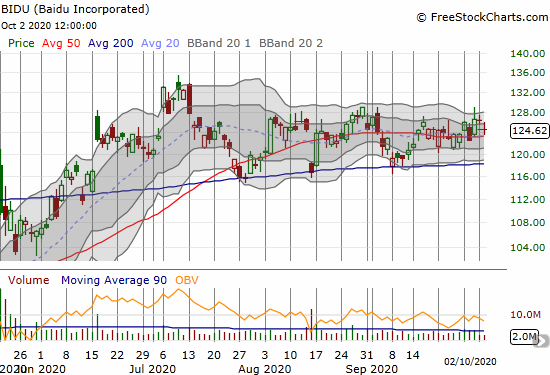
Baidu (BIDU)
I am still not buying Chinese stocks, but I cannot resist taking a peak from time-to-time. Baidu (BIDU) is hanging in there nicely. Since July, BIDU has held 200DMA support while pivoting around its 50DMA. For those interested, BIDU is a buy on a bullish breakout above this near 4-month trading range. BIDU is a short on a 200DMA breakdown.
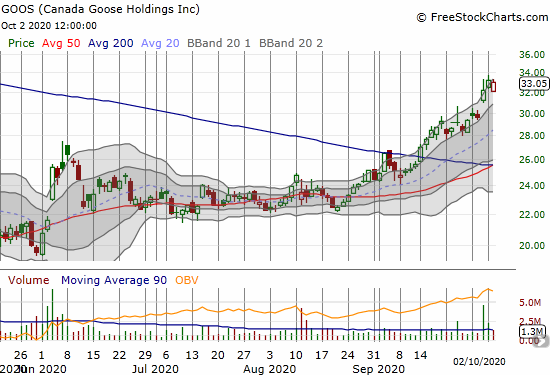
Canada Goose Holdings (GOOS)
Coat manufacturer Canada Goose Holdings (GOOS) completely fell off my radar. An upgrade from Cowen on September 30th taking GOOS to an outperform and $36 price target put the stock back on my radar. GOOS made a double breakout last month above its 200DMA and the June high. Showing strength in September is reason alone to like GOOS. Perhaps the stock market is trying to anticipate a particularly cold winter in 2020. This year is surely the kind of year to develop historic bitter cold. Bundle up!
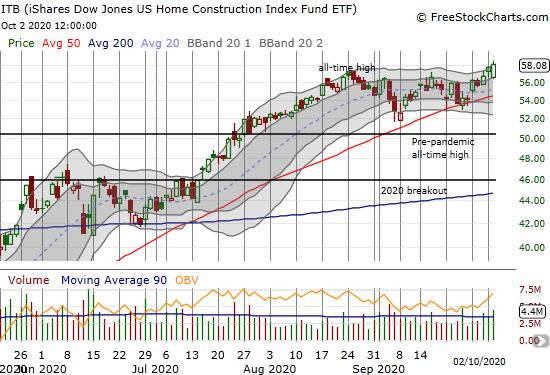
iShares Dow Jones US Home Construction Index Fund ETF (ITB)
The iShares Dow Jones US Home Construction Index Fund ETF (ITB) got love from the bargain shoppers as it joined the positive side of the day’s bullish divergence. ITB just barely surpassed the all-time high from August with a 0.6% gain. I may not get a good dip to buy into the seasonal trade in home builders later this month or in November.
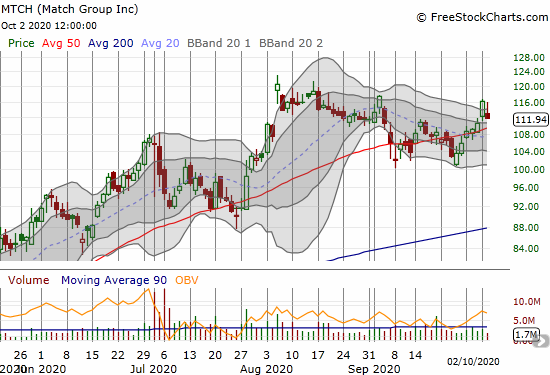
Match Group (MTCH)
Match Group (MTCH) formed a kind of double-bottom in September. I flipped my attitude on MTCH 180 degrees. At the depths of the coronavirus pandemic I assumed social distancing, quarantines, and lockdowns would dissuade people from dating. However, online dating is the perfect place for dating in a pandemic. Singles can meet no matter what madness exists in the physical world, and they can apply whatever filters they choose to determine physical meet-ups. I am looking to buy into the current dip.
Nvidia (NVDA)
My bearish call on Nvidia (NVDA) failed spectacularly as 50DMA support held throughout September. NVDA served up another lesson on the hazards of impatience. NVDA is quite bullish as long as it maintains 50DMA support. The uptrend is strong in this one.

SPDR S&P Retail ETF (XRT)
For two straight days, the SPDR S&P Retail ETF (XRT) used its 20DMA as a springboard for 50DMA breakouts. XRT is another example of the bullish divergence especially given last month’s 50DMA breakdown looked like a confirmation of bearish tidings for September. I am on alert for retail buys as long as XRT is in this bullish position.

— – —
FOLLOW Dr. Duru’s commentary on financial markets via email, StockTwits, Twitter, and even Instagram!
“Above the 40” uses the percentage of stocks trading above their respective 40-day moving averages (DMAs) to assess the technical health of the stock market and to identify extremes in market sentiment that are likely to reverse. Abbreviated as AT40, Above the 40 is an alternative label for “T2108” which was created by Worden. Learn more about T2108 on my T2108 Resource Page. AT200, or T2107, measures the percentage of stocks trading above their respective 200DMAs.
Active AT40 (T2108) periods: Day #5 over 20%, Day #4 over 30%, Day #1 over 40% (overperiod ending 8 days under 40%), Day #18 under 50% (underperiod), Day #20 under 60%, Day #23 under 70%
Daily AT40 (T2108)
")
Black line: AT40 (T2108) (% measured on the right)
Red line: Overbought threshold (70%); Blue line: Oversold threshold (20%)
Weekly AT40 (T2108)

*All charts created using FreeStockCharts unless otherwise stated
The T2108 charts above are my LATEST updates independent of the date of this given AT40 post. For my latest AT40 post click here.
Be careful out there!
Full disclosure: long QQQ puts, long UVXY, long AAPL calls, long JWN calls
*Charting notes: FreeStockCharts stock prices are not adjusted for dividends. TradingView.com charts for currencies use Tokyo time as the start of the forex trading day. FreeStockCharts currency charts are based on Eastern U.S. time to define the trading day.