
AT40 = 2.0% of stocks are trading above their respective 40-day moving averages (DMAs) (18th oversold day)
AT200 = 2.6% of stocks are trading above their respective 200DMAs (new low for the oversold period)
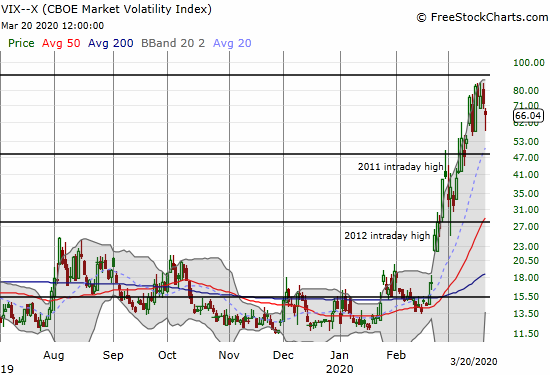
VIX = 66.0
Short-term Trading Call: bullish
Stock Market Commentary
The bear market grinds on. At the time of writing, U.S. stock market futures traded limit down (-5%). Given the Culture of Collapse in this brutally bearish oversold period, the U.S. stock market could be headed for its 5th circuit breaker day in less than 3 weeks. While the rush for the exits continues, I am writing with a focus on the signals from last week. Believe it or not, some “green shoots” appeared, and I do not yet want to lose sight of them. If the stock market manages to gap UP on Monday in direct contrast to futures, I will be on alert for a launchpad that finally brings this oversold period to an end.
Oversold
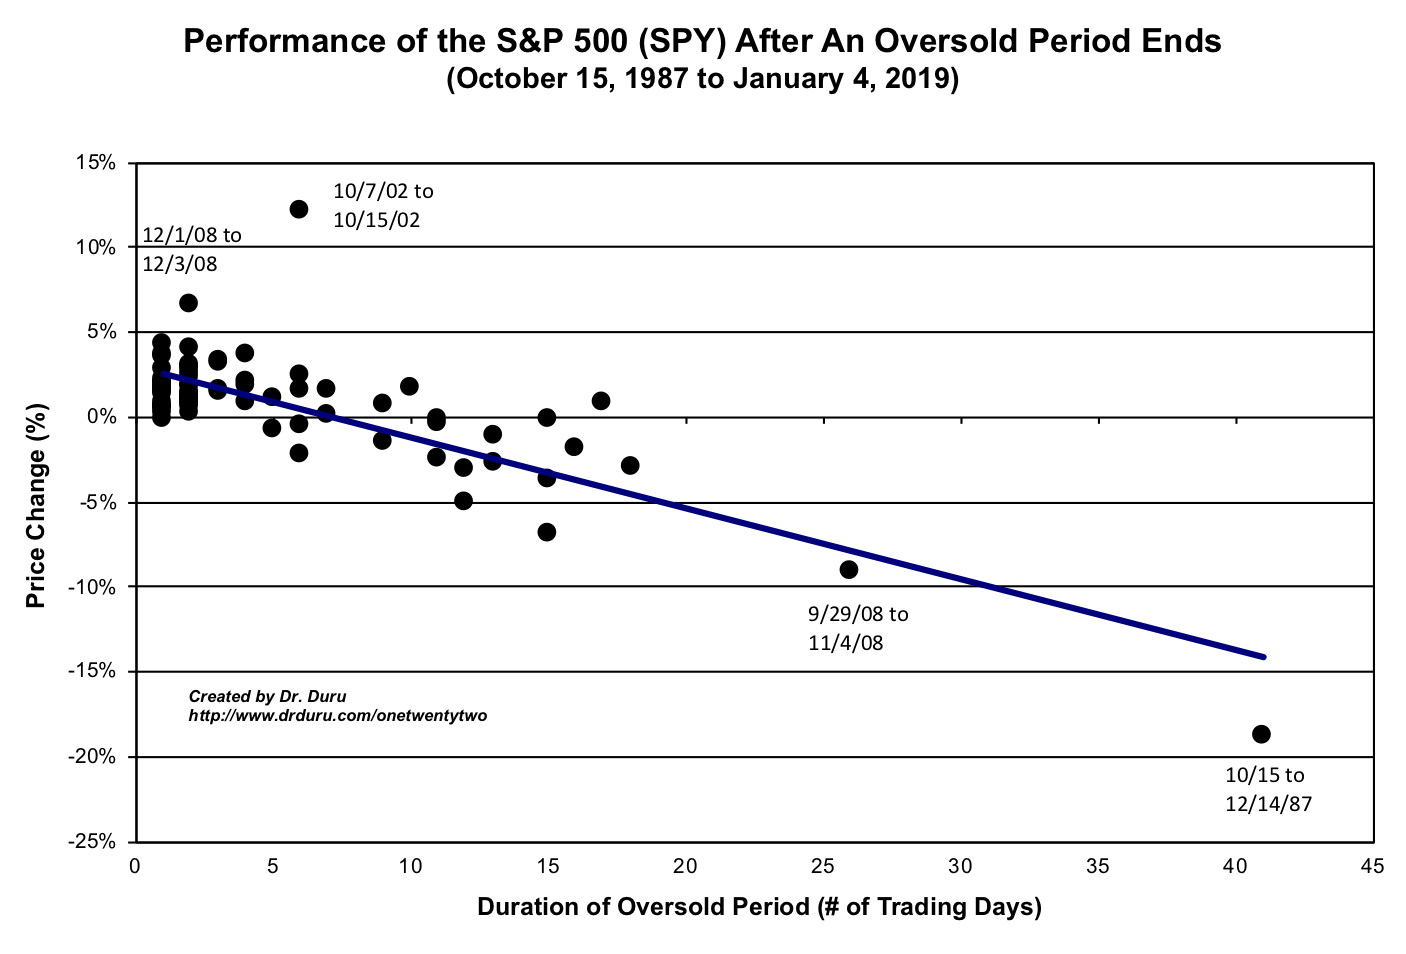
At 18 trading days, this oversold period has become the third longest on record (since 1986). The S&P 500 (SPY) is down 26.0% since AT40 (T2108), the percentage of stocks trading above their 40DMAs, closed below 20% on February 26, 2020. The S&P 500 hit a new 38-month closing low; these levels were last seen around the time of President Trump’s inauguration. AT200 (T2107), the percentage of stocks trading above their respective 200-day moving averages (DMAs), dropped to a new low for this oversold period.
That bad news is a sample of the on-going calamity in financial markets. However, amid all this bad news, the volatility index (VIX) actually fell for a second day in a row for the first time during this entire oversold period. The VIX has dropped 4 of the last 6 trading days. I consider this change in behavior the beginning of something positive, albeit small. Add a few more positives, like the VIX closing below Friday’s intraday low and/or the S&P 500 stringing together two up days for the first time during this oversold period, and suddenly we can talk about seeing a light at the end of this bear market tunnel.
The Stock Market Indices
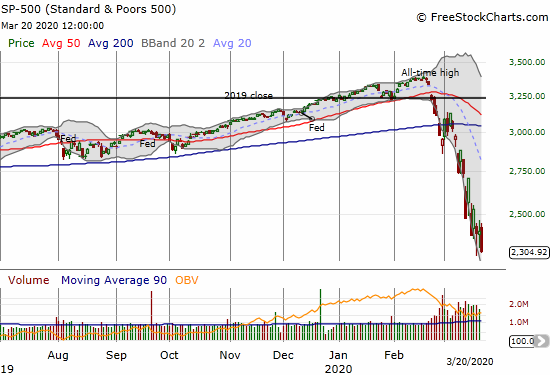
The S&P 500 (SPY) lost 15.0% for the week. The index lost 8.8% the previous week. The index gained 0.1% the week before that. Finally, the S&P 500 lost 11.5% the week the market flipped oversold. So last week represented an acceleration of losses. In terms of a positive spin, the market got one step closer to flushing the motivated sellers out of the market.
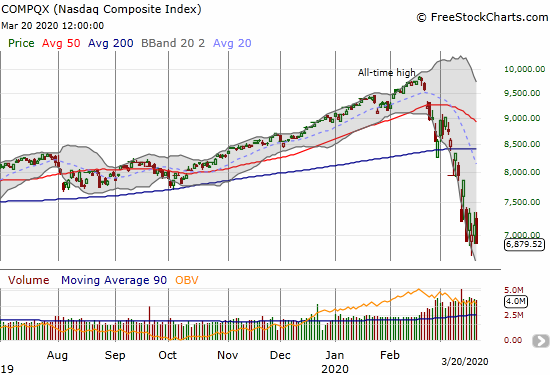
The buyer versus seller stalemate in the NASDAQ (COMPQX) on Wednesday actually held up as a bottom for the week on an intraday basis. I count this achievement as one more green shoot for a bottoming process even as the tech-laden index closed at a new (marginal) 14-month low.
Volatility
On Monday, March 16th, the volatility index (VIX) set a new all-time record closing high since its formulation in 1990. The prior high was set on November 20, 2008. The all-time intraday high of 89.5 from October 24, 2008 still stands (horizontal line in the graph below). So I consider it meaningful that the VIX managed to lose two straight days for the first time during this oversold period. The quadruple witching on Friday, the expiration of a series of options and futures contracts, provides a caveat to interpreting Friday’s loss in volatility. It is very possible the anticipation of the quadruple witching caused a large over-inflation in volatility that is independent from the buying and selling interest in the indices.
The Short-Term Trading Call
In my last Above the 40 post, I described a reset in my trading strategy. Friday’s options expiration symbolized that reset as I watched a whole host of call options (singles, vertical and calendar spreads) expire harmless. Collectively, those call options represented my expectations from the early part of this oversold period that within 2 weeks or so, these positions would be very profitable. At the time, I had also taken profits on most short positions and put options in order to maximize the upside I thought would come from flipping from bearish to bullish. Last week, I finally got the message from the Culture of Collapse to fade rallies. However, I flipped most of my bearish positions quickly because I still want to be positioned aggressively long whenever the market decides to bring this grinding oversold period to an end.
In other words, I remain bullish simply out of an expectation that the oversold period will at some point end. Yet until buyers created a firmer base of support, it makes sense to look for quick opportunities to create a buffer on my long positions. I also remain uninterested in accumulating too many more positions until that base of firmer support shows up. Unfortunately, the AT40 trading rules have nothing to say about identifying that support with levels so low and the length of the oversold period at historic levels.
Stock Chart Reviews – Below the 200DMA
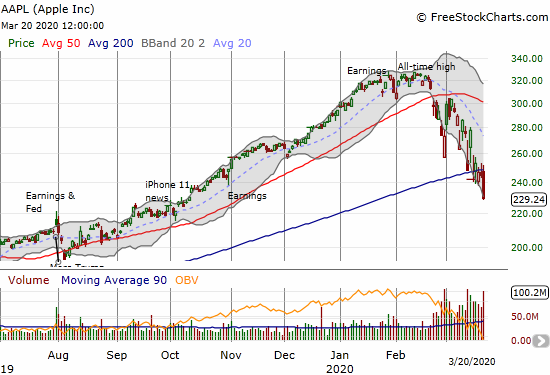
Apple (AAPL)
The market lost Apple (AAPL) at the beginning of last week. AAPL gave a valiant fight holding onto its 200DMA, but Friday’s selling finally proved too much. AAPL lost 6.4% and hit a 5-month low. While most stocks in the stock market WISH they were only at 5-month lows, AAPL’s breakdown is one of the biggest red flags waving against the green shoots I am squinting to see.
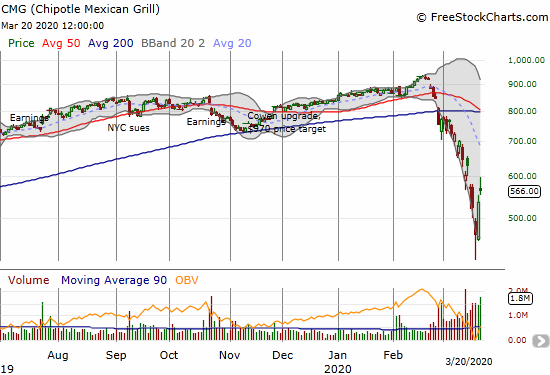
Chipotle Mexican Grill (CMG)
Chipotle Mexican Grill (CMG) was the last of my “backstop” bearish positions that closed out last week. Ironically, it was a far too conservative backstop as a 700/680 put spread expiring March 20th. I could have opted for a cheaper March 13th expiration and/or just bought the March 20 $680 put. Despite a sharp rebound the last two days, CMG is still stuck in a steep downtrend.
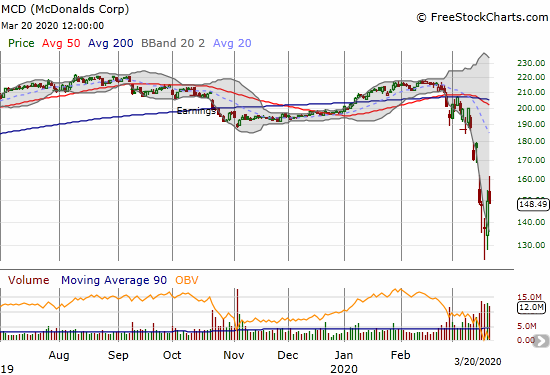
McDonalds Corp (MCD)
McDonalds Corp (MCD) participated in Thursday’s large rebound in casual dining establishments. At its lowest point last week, MCD was at a 3-year low. MCD looks like an obvious buy at some point later in this crisis. Sadly, a lot of poorly capitalized restaurants will go banrupt no matter what aid governments provide. McDonalds will likely be one of the few places in many local communities still open for fast food and casual dining. However, note that MCD has about $900M in cash versus $48B in debt and a negative book value (from Yahoo Finance).
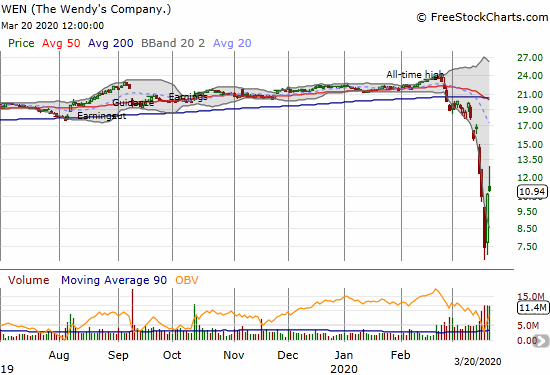
The Wendy’s Company (WEN)
Just ahead of the stock market’s collapse, The Wendy’s Company (WEN) sat at an all-time high, and I planned to sell my holdings. I never got around to it. At one point the stock fell as much as 68.8% from its all-time high as the Culture of Collapse weighed heavily on WEN. Now, it is far “too late” to sell. I have WEN on my list for a buy sometime in the future. Wendy’s has $300M in cash versus $3.7B in debt and a positive book value. WEN looks like an even better buy than MCD at these extreme depths.
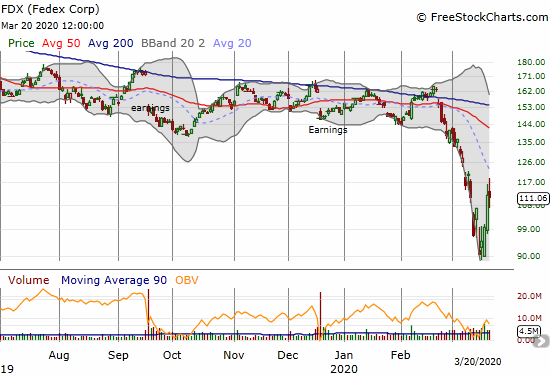
Federal Express (FDX)
Federal Express (FDX) is so far doing well after reporting earnings after the market close last Tuesday. I am not interested in buying FDX until it retests the recent low, but I have my eye on it as a potential tell for the sustainability of a bottom during this oversold period.
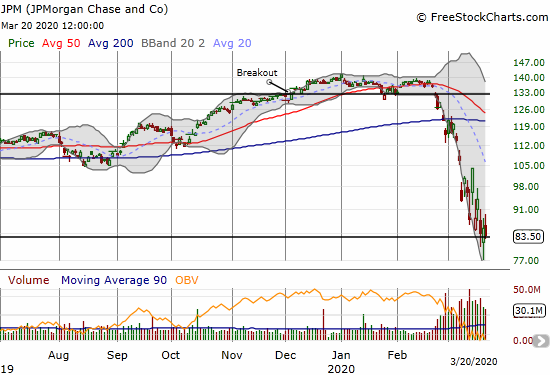
JPMorgan Chase (JPM)
JPMorgan Chase (JPM) is still in a steep downtrend from its 50DMA breakdown last month. Yet, it looks like it is trying to hold recent lows. Of course the Culture of Collapse implies this support is tenuous until proven otherwise.
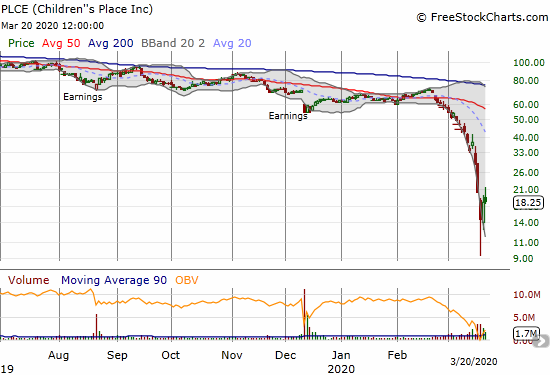
Children’s Place (PLCE)
Children’s Place (PLCE) is another solid business that is suffering mightily from the Culture of Collapse. Since its 50DMA breakdown, PLCE lost an incredible 85.4% at last week’s intraday low. The susbequent rebound doubled the price of the stock by the end of the week. I hazard to guess motivated sellers flushed themselves out of PLCE. I am not buying the stock here, but I am watching for some sign of stabilization and a base that would make the stock a more attractive risk/reward.
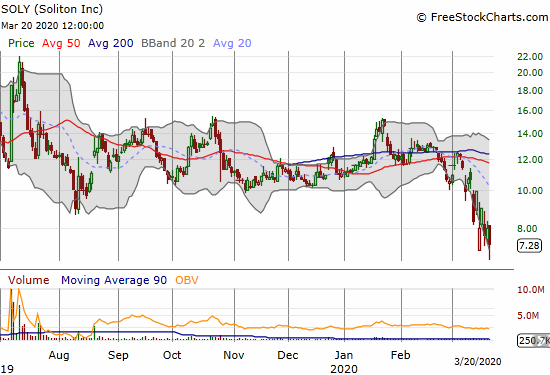
Soliton (SOLY)
I have written extensively about Soliton (SOLY). I thought the next time the stock got to current levels, I would load up. Instead, I now worry that anyone who wanted to remove a tattoo will postpone indefinitely the operation. That reality means SOLY becomes a long-term play instead of a stock and company with promise about to bloom right around the corner. The next level of support for SOLY is around $5 where it bottomed from its last steep sell-off after a short-seller’s report.
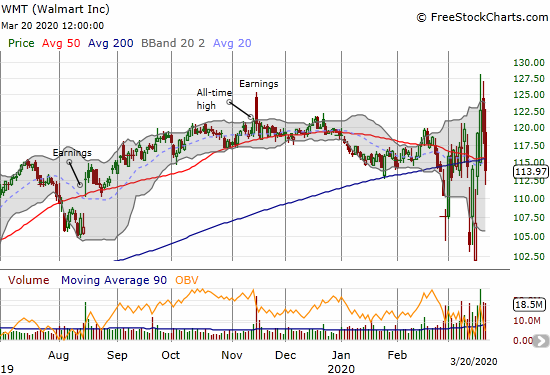
Walmart (WMT)
Walmart (WMT) did a rare thing last week: the stock hit an all-time high. I assumed that the promise of large fiscal stimulus that puts thousands directly in the hands of U.S. consumers was an obvious benefit for Walmart. That optimism quickly faded into a fresh 50/200DMA breakdown for WMT. WMT is a tough buy because it still sports trailing and forward P/Es over 20. I am stuck on the fence here. Moreover, I put my idea to buy (more) Target (TGT) as a lagging play on the shelf. (I visited a local Target store today that was packed with shoppers).
Stock Chart Reviews – Above the 200DMA
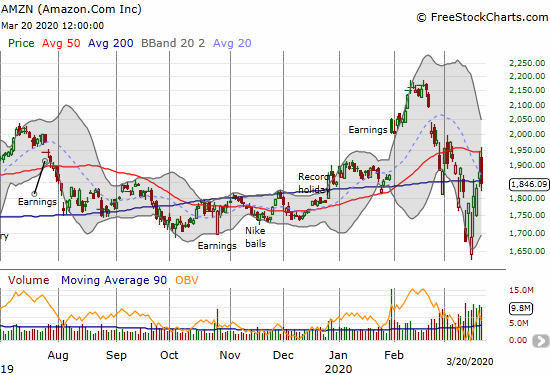
Amazon.com (AMZN)
Amazon.com (AMZN) gets an honorary position in the over 200DMA block of stock charts. The stock lost 1.9% on Friday and marginally closed below its 200DMA. I am impressed by AMZN’s levitation during this Culture of Collapse. AMZN is “only” down 6.7% for this oversold period. At its intraday high on Friday, AMZN actually finished closing its entire loss for the oversold period. AMZN is trading like a big winner on the other side of this coronavirus crisis.
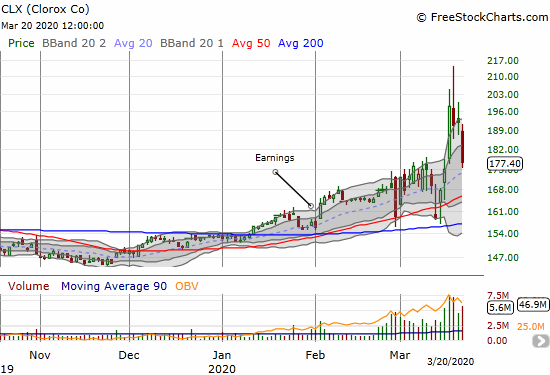
Clorox (CLX)
I was wrong about Clorox (CLX) when I claimed the stock looked topped out despite the nationwide stories of hoarding of Clorox’s cleaning products. Still, the stock looks topped out again. Three days after breaking out to a new all-time high on the heels of an impressive 13.3% gain, CLX ended the week with a complete reversal of the breakout. CLX traded as high as $214. I will be interested in seeing whether CLX can hold 50DMA support again.
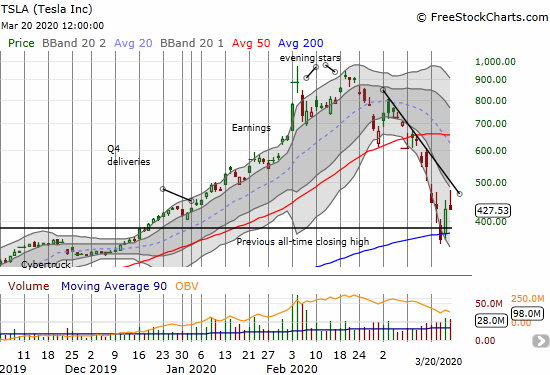
Tesla (TSLA)
Tesla (TSLA) managed to hold converged support at its 200DMA and the breakout point from December. The stock closed flat on Friday after trading as high as +11.5%. That fade from the downtrend line is a fresh red flag for the stock. I opened a new trade on TSLA with a 400/350 put spread expiring in the coming week and a weekly calendar spread at the $500 strike. I mapped out breaking at least even as long as TSLA makes another extreme move in the coming week.
— – —
FOLLOW Dr. Duru’s commentary on financial markets via email, StockTwits, Twitter, and even Instagram!
“Above the 40” uses the percentage of stocks trading above their respective 40-day moving averages (DMAs) to assess the technical health of the stock market and to identify extremes in market sentiment that are likely to reverse. Abbreviated as AT40, Above the 40 is an alternative label for “T2108” which was created by Worden. Learn more about T2108 on my T2108 Resource Page. AT200, or T2107, measures the percentage of stocks trading above their respective 200DMAs.
Active AT40 (T2108) periods: Day #18 under 20% (oversold day #18), Day #19 under 30%, Day #30 under 40%, Day #21 under 50%, Day #40 under 60%, Day #44 under 70%
Daily AT40 (T2108)
")
Black line: AT40 (T2108) (% measured on the right)
Red line: Overbought threshold (70%); Blue line: Oversold threshold (20%)
Weekly AT40 (T2108)

*All charts created using FreeStockCharts unless otherwise stated
The T2108 charts above are my LATEST updates independent of the date of this given AT40 post. For my latest AT40 post click here.
Be careful out there!
Full disclosure: long QQQ, long SSO, short UVXY shares and long call spread, long AAPL calendar call spread, long TSLA put spread and call calendar spread, short JPM put spread
*Charting notes: FreeStockCharts stock prices are not adjusted for dividends. TradingView.com charts for currencies use Tokyo time as the start of the forex trading day. FreeStockCharts currency charts are based on Eastern U.S. time to define the trading day.