
AT40 = 58.7% of stocks are trading above their respective 40-day moving averages (DMAs)
AT200 = 59.0% of stocks are trading above their respective 200DMAs
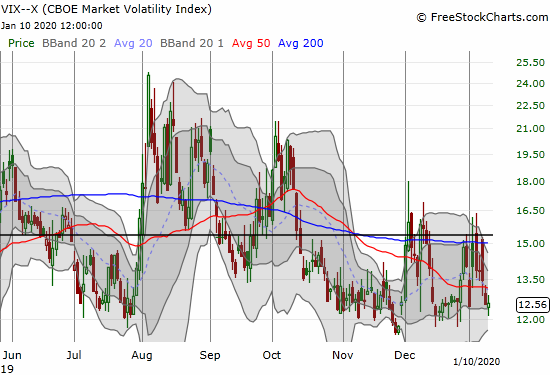
VIX = 12.6
Short-term Trading Call: neutral
Stock Market Commentary
The bearish signals are growing, but they are still not impeding this resilient stock market. The ever so shallow selling acts like a quick refresher for the buyers. The periodic bearish divergences come and go with a whisper.
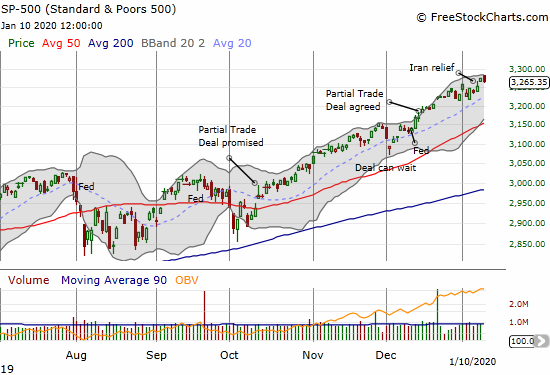
The bearish divergence between the S&P 500 (SPY) and AT40 (T2108) grew last week. On Monday, AT40, the percentage of stocks trading above their respective 40-day moving averages (DMAs), gapped down alongside the S&P 500. Both AT40 and the S&P 500 rallied back to notch marginal gains on the day. On Tuesday, AT40 returned to Monday’s low while the S&P 500 barely budged. On Friday, AT40 hit a new 1-month closing low; the S&P 500 closed just a fraction off its all-time high from Thursday.
The NASDAQ (COMPQX) followed alongside the S&P 500.
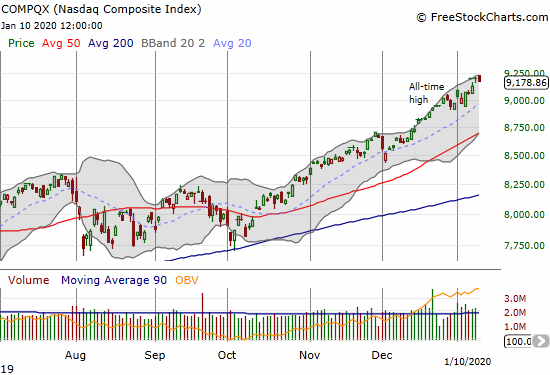
Both indices quickly invalidated the island reversal patterns I pointed out in my last Above the 40 post. This invalidation in turn erased a potentially troubling, albeit minor, bearish issue for the stock market. Even more impressive that this invalidation occurred as part of a quick recovery from angst over the escalating tensions between the U.S. and Iran.
Volatility
A familiar story for the volatility index (VIX): the faders drove the VIX off every intraday high during the week. Friday’s minimal gain looks like an effort to hold 12 as support. I will likely buy fresh long volatility call options as play on an eventual bounce. One of these days, I will just change my focus to fading volatility surges in the middle of periods of deep complacency.
The Short-Term Trading Call
I was correct in noting in my last Above the 40 post that the overbought threshold would hold. However, while the index is more vulnerable to a pullback, the stock market continues to show off its overall resilience in the face of bad news. My line in the sand remains at $320 for SPY (3211 on the S&P 500). Below that threshold, I am willing to buy puts. I made a tactical error on December 31st in buying puts as SPY approached $320; I decided that the momentum favored a break of the threshold. The index promptly bounced from $320 support that day. A week later, SPY gapped down to $320 and again promptly bounced. That behavior proves the short-term importance of $320 support….not to mention it is a hard reminder of the importance waiting out technical signals rather than assuming they are coming.
Stock Chart Reviews – Below the 50DMA
Walgreens Boots Alliance (WBA)
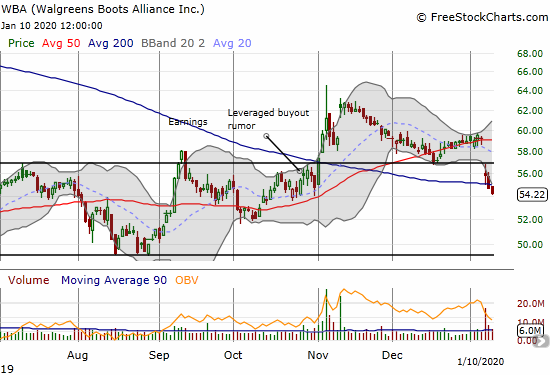
Walgreens Boots Alliance (WBA) has failed to deliver. Last week, the company disappointed on earnings and confirmed a 200DMA breakdown. With WBA completely reversing the gains from the rumors of a leveraged buyout, I am almost tempted to get back to my bearish positioning!
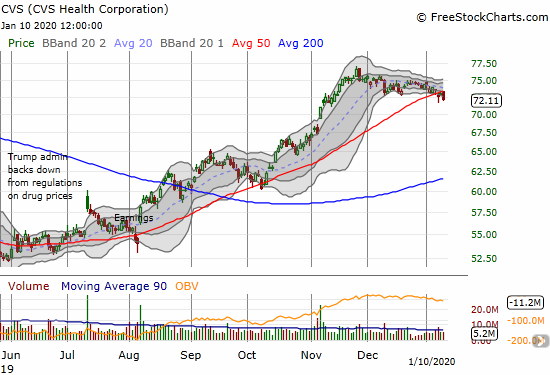
CVS Health Corporation (CVS)
On the flip side of WBA, CVS Health Corporation (CVS) has logged a strong 6-7 months. The stock is now struggling to hold 50DMA support. The short opportunity is much better with CVS than WBA given the amount of room below for a test of 200DMA support. A new closing low will get me on the short side.
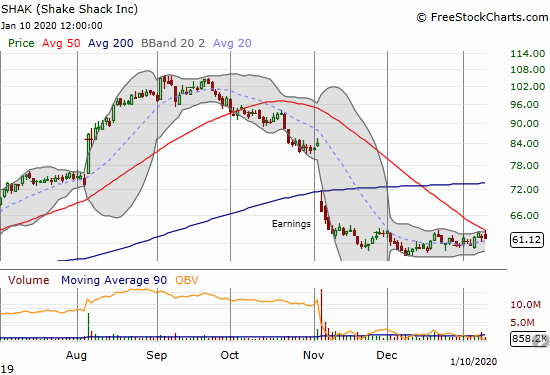
Shake Shack (SHAK)
After reading news of the acquisition of Habit Restaurants (HABT) by Yum! Brands (YUM), I checked out burger joint Shake Shack (SHAK) for a buying opportunity. I was taken aback by the roller coaster on the chart. SHAK is back to where it traded in late May and early June. In between the points looks like a bubble (which would make sense to me given my impression that burger joints are in over-supply and reaching faddish levels). The stock is consolidating below its declining 50DMA. If it confirms a 50DMA breakout, I am a buyer. Otherwise, the stock is likely a short below the congestion area. I still prefer my chicken-based trades, including El Pollo Loco Holdings (LOCO).
Stock Chart Reviews – Above the 50DMA
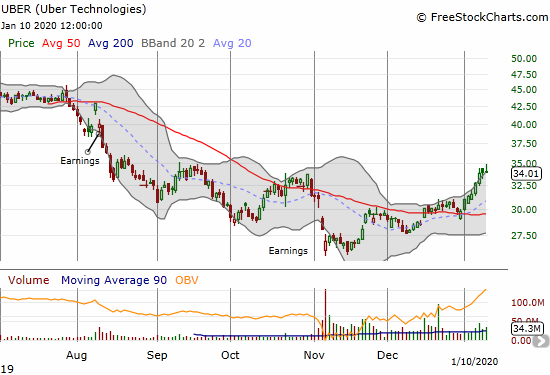
Uber Technologies (UBER)
Uber Technologies (UBER) is finally following through on a 50DMA breakout. UBER is riding the momentum of good news flow including the excitement over the company’s announcement at the Consumer Electronics Show (CES) about its upcoming air share service in major urban areas. UBER is a buy on the dips with a stop below the 50DMA.
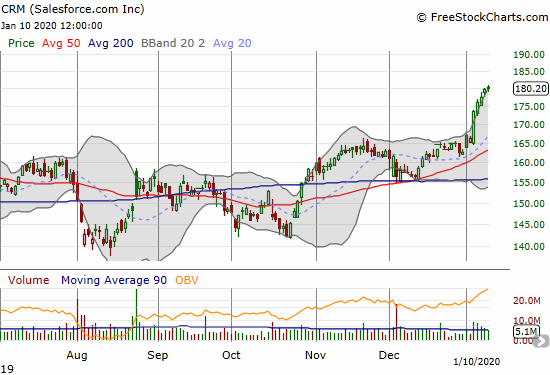
Salesforce.com (CRM)
Cloud software stocks are back in vogue. Salesforce.com (CRM) is the most interesting of the group for this latest cycle of enthusiasm. CRM was stuck trading below a triple top set from February to April, 2019. An RBC upgrade from outperform to top pick last Monday touched off the current breakout with a 4.4% gain. RBC increased its price target from $200 to $215. CRM is a buy on the dip. I like buying call spreads in lieu of or in addition to buyable dips.
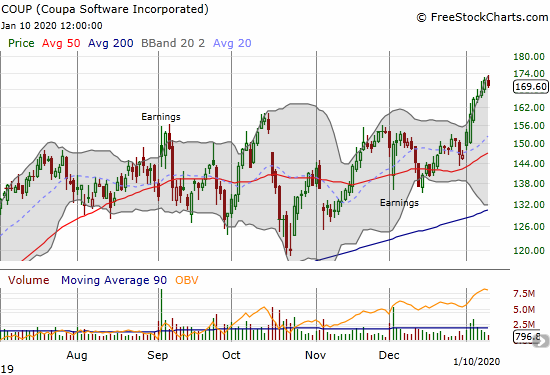
Coupa Software (COUP)
The Salesforce.com upgrade touched off rallies across a swath of cloud stocks. Coupa Software (COUP) was one of many beneficiaries. COUP broke out last week to a new all-time high, leaving its last two periods of post-earnings angst well behind in the rearview mirror.
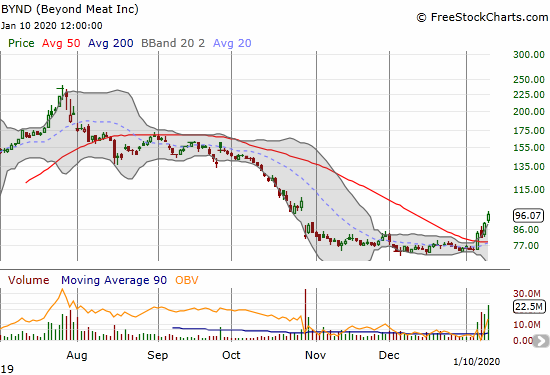
Beyond Meat (BYND)
Beyond Meat (BYND) has new favor with the momentum crowd. BYND broke out above its 50DMA last week on high volume with a 12.5% gain. That alone was a buy signal even with the stock above its upper Bollinger Band (BB). The news that McDonalds (MCD) is expanding its trial in Canada was enough of a positive. I am now of course watching to see what BYND does around $100 before deciding on a move.
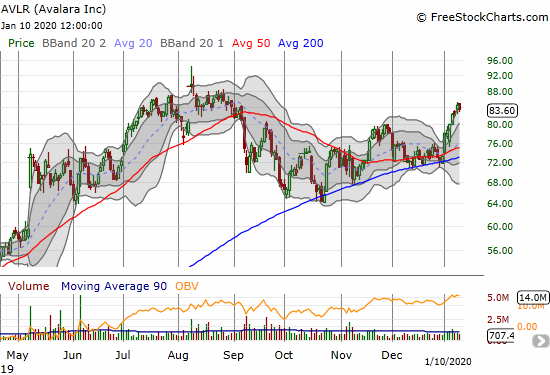
Avalara (AVLR)
Speaking of the power of $100, a friend reminded me about Avalara (AVLR). Tax time approacheth once again, and apparently AVLR is powering up the advertising for its tax services to e-commerce companies. The stock chart is choppy, but its consistent ability to successfully hold 200DMA support is a powerful buy signal. Last summer, the stock came up short in its run to $100. I have to imagine a fresh run is underway…and this time it will succeed.
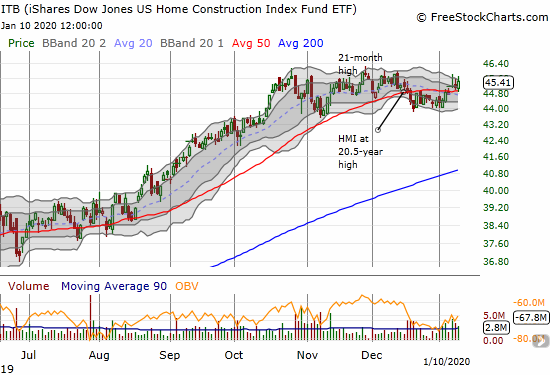
iShares Dow Jones US Home Construction Index Fund ETF (ITB)
The iShares Dow Jones US Home Construction Index Fund ETF (ITB) looks like it is already healing from its 50DMA breakdown. ITB looked like it was rolling over at the time. Now, ITB has confirmed a 50DMA breakout and is finally trading above the point where the Housing Market Index (HMI) hit a 20 1/2 year high. Home builders delivered contrasting responses to earnings reports last week. Lennar (LEN) gapped and crapped before closing the week on a positive note. KB Home (KBH) experienced a strong run-up into earnings and promptly gapped down 3.2% after climbing over 2019’s high.
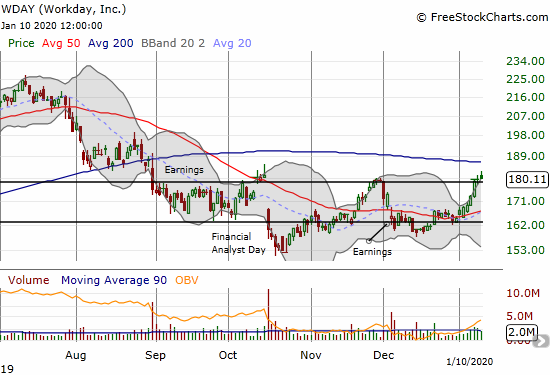
Workday (WDAY)
I have eyed Workday (WDAY) for trades ever since the Financial Analyst Day that brought out the sellers. I was a little late in chasing the latest burst of buying (liekly also motivated by the Salesforce.com upgrade) that took WDAY above its 50DMA. I was also too conservative in choosing a small number of shares and a calendar call spread with a $175 strike price. I took profits on the shares on Friday to pay for the loss on the calendar call spread. I also allowed assignment on the short side of the calendar spread. If I get the dip that I want, I will reposition more bullishly.
— – —
FOLLOW Dr. Duru’s commentary on financial markets via email, StockTwits, Twitter, and even Instagram!
“Above the 40” uses the percentage of stocks trading above their respective 40-day moving averages (DMAs) to assess the technical health of the stock market and to identify extremes in market sentiment that are likely to reverse. Abbreviated as AT40, Above the 40 is an alternative label for “T2108” which was created by Worden. Learn more about T2108 on my T2108 Resource Page. AT200, or T2107, measures the percentage of stocks trading above their respective 200DMAs.
Active AT40 (T2108) periods: Day #245 over 20%, Day #84 over 30%, Day #59 over 40%, Day #26 over 50% (overperiod), Day #1 under 60% (underperiod ending 17 days above 60%), Day #72 under 70%
Daily AT40 (T2108)
")
Black line: AT40 (T2108) (% measured on the right)
Red line: Overbought threshold (70%); Blue line: Oversold threshold (20%)
Weekly AT40 (T2108)

*All charts created using FreeStockCharts unless otherwise stated
The T2108 charts above are my LATEST updates independent of the date of this given AT40 post. For my latest AT40 post click here.
Be careful out there!
Full disclosure: long VIXY calls, long UVXY calls, long RRGB, long QSR, long BIDU call spread, long IQ, short NFLX shares and long NFLX calls, long NLSN calls
*Charting notes: FreeStockCharts stock prices are not adjusted for dividends. TradingView.com charts for currencies use Tokyo time as the start of the forex trading day. FreeStockCharts currency charts are based on Eastern U.S. time to define the trading day.