
AT40 = 49.4% of stocks are trading above their respective 40-day moving averages (DMAs)
AT200 = 49.9% of stocks are trading above their respective 200DMAs
VIX = 16.0
Short-term Trading Call: neutral
Stock Market Commentary
The stock market’s coordinated yet precarious dance around 50-day moving averages (DMAs) continued on Friday. The latest round of technical battles played out in even more dramatic form as various government officials and megaphones stoked market reactions. The best attribution to market gyrations was the following tweet from the Editor-in-chief of the Chinese and English editions of the Global Times; he claims to have an inside track to Chinese government officials.
Treasury Secretary Steven Mnuchin also called the talks constructive despite no announced progress or future meetings scheduled.
We have heard “constructive” so much in reference to the U.S. – China trade negotiations, I am starting to think the main point of all this drama is construction.
Amazingly, these shreds of positivity have proved sufficient to keep the market hopeful and optimistic. I stand by my claims from a year ago that these trade talks will not conclude anytime soon or at least will not achieve U.S. goals any time soon. The grievances from the U.S. run so deep and are so serious that Chinese concessions involve unpalatable changes (to the Chinese), the kind of changes that typically require dramatic force. This deadlock is at least as paralyzing as the madness that is Brexit.
To wit, here is a Saturday tweet from Hu Xijin re-establishing the Chinese determination NOT to give in to U.S. demands…
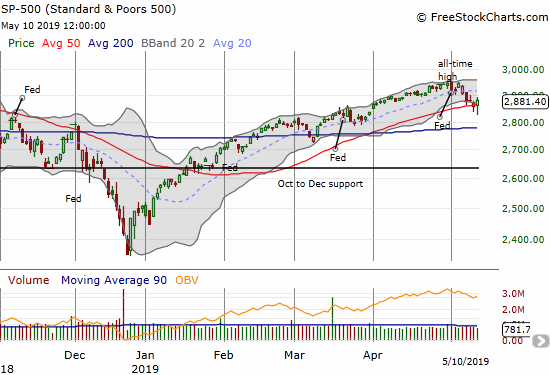
The resulting spectacle in financial markets generated wild intraday swings in the market that ended about as good as it could for bulls and buyers. The S&P 500 (SPY) created a second hammer-like pattern with buyers lifting the index well off its intraday low and out of bearish 50DMA breakdown conditions.
The NASDAQ (NDX) also rebounded sharply from an earlier 50DMA breakdown.
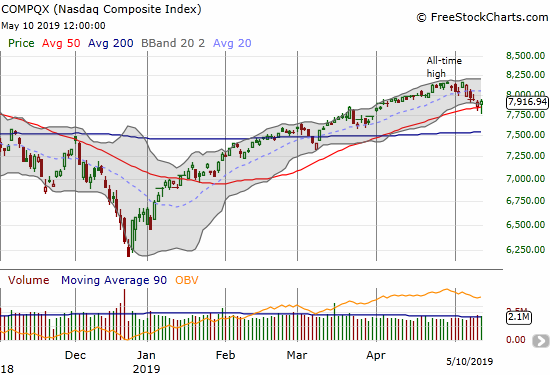
All the market needs is follow-through buying early in the coming week to confirm a successful test of 50DMA support that would setup a fresh run at all-time highs – a very constructive setup for bulls and buyers.
The volatility index, the VIX, completely imploded to close the week although it somehow managed to stay above its 15.35 pivot. A close below the pivot would likely seal the deal for the bulls – firming the foundation of this latest construction.
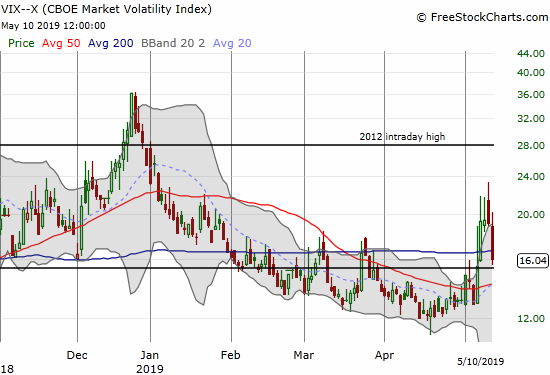
I used the VIX implosion to take profits on my Ultra VIX Short-Term Futures ETF (UVXY) put options. I was never able to take profits on my UVXY call spread given the wide bid/ask gap on both sides of the spread. I resigned myself to just keeping it rather than giving up on it for a steep discount. In the coming week, I will stay focused on fading additional bounces in the VIX and trying to unload the UVXY call spread at a good price (perhaps I need to leg out of it by first unloading the short side…).
AT40 (T2108), the percentage of stocks trading above their respective 40DMAs, dropped as low as 38.1% on Thursday (a 4-month low) and dropped again as low as 38.3% on Friday. AT40 closed Friday at 49.4%. As I mentioned before, during a strong bull market, a steep drop for AT40 into the 30s is typically “good enough” to deliver a buy signal. It just needs confirmation with follow-on buying. AT200 (T2107), the percentage of stocks trading above their respective 200DMAs, only dropped a 1-month low during the week’s drama and finished the week at 49.9%. In other words, the long-term technicals are better than the short-term ones for now.
The Hedges
The Australian dollar versus the Japanese yen (AUD/JPY) was key in reminding me that the bearish divergence was alive and well (for a refresher on the importance of AUD/JPY read “Why the Australian Dollar and Japanese Yen Matter for Stock Traders“). AUD/JPY confirmed the buying efforts the last two days, but it remains stuck in a downtrending lower Bollinger Band (BB) channel. AUD/JPY needs to breakout of that band to support a bullish swing. I am still long this currency pair as a partial hedge against my shorts.
I am also still long iShares Russell 2000 Index Fund ETF (IWM) call options. I was overly aggressive in targeting a first tranche for Friday expiration. I expect to take profits on the second tranche either Monday or Tuesday.
Stock Chart Reviews – Bearish
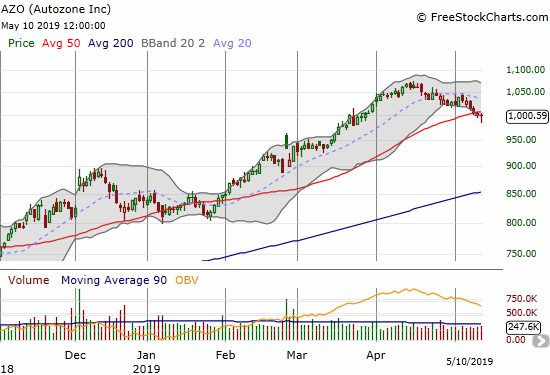
Autozone (AZO)
Autozone (AZO) is on “watch.” Last week it slipped under 50DMA support for the first time since January. I am a buyer if and when it climbs back above its 50DMA. For now however the stock is in a bearish position.
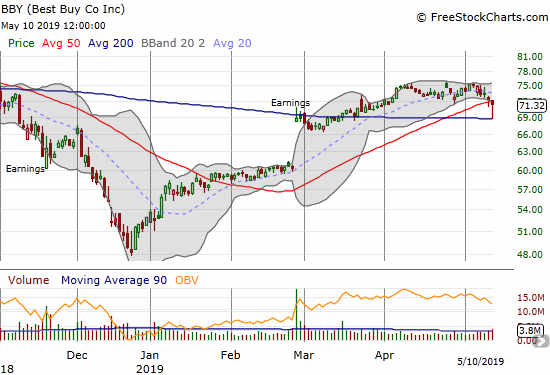
Best Buy (BBY)
Best Buy (BBY) took a steep tumble on Friday at the intraday lows. The stock made a picture-perfect tap on 200DMA support before rebounding. I decided to buy puts into that rebound as the stock looks very “heavy.” The puts expire this Friday and earnings are the following week on the 23rd.
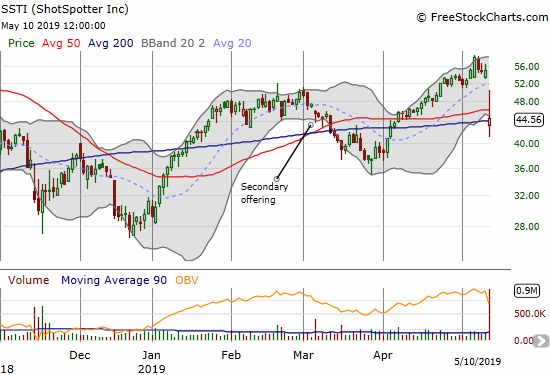
ShotSpotter (SSTI)
I listened to the ShotSpotter (SSTI) earnings call, so I understand the poor market response. However, I also think the selling is overdone. I see this drop as a buying opportunity, but I will be patient in finding a new entry point. I will write more details on my earnings impressions in a separate post.
I put SSTI in the bearish section because it broke 50DMA support on a 19% gap down. I am encouraged by 200DMA support, but not confident it will hold for long. A test of the March lows seems likely.
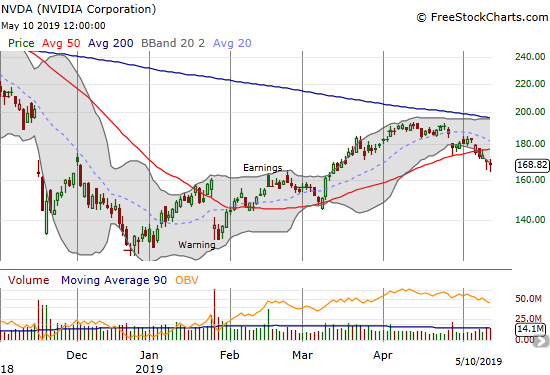
NVIDIA (NVDA)
NVIDIA (NVDA) broke 50DMA support to start the week, closed below its 50DMA on Tuesday, and confirmed the breakdown with follow-on selling. I am guessing the stock is primed to rally back to its 50DMA, but I doubt it will get past that resistance without a strong catalyst (like earnings).
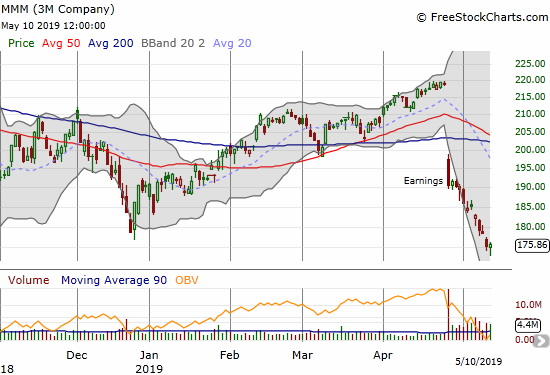
3M Company (MMM)
The post-earnings selling in the 3M Company (MMM) has yet to stop. The drop in the stock is persistent yet orderly. The stock is near a 2 1/2 year low.
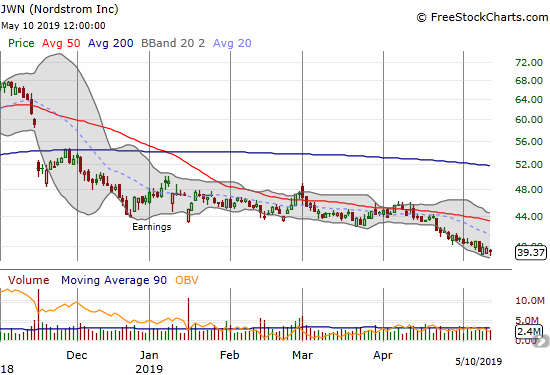
Nordstrom (JWN)
I have started eyeing Nordstrom (JWN) for a new buy. For now, the stock is quite bearish and shows little sign of interest from buyers, so I have a dilemma on my hands. A rebound to 50DMA resistance is now about a 10% move away and such a move might be the best to expect out of JWN at this point. A lot of mall-based department stores are trading poorly right now.
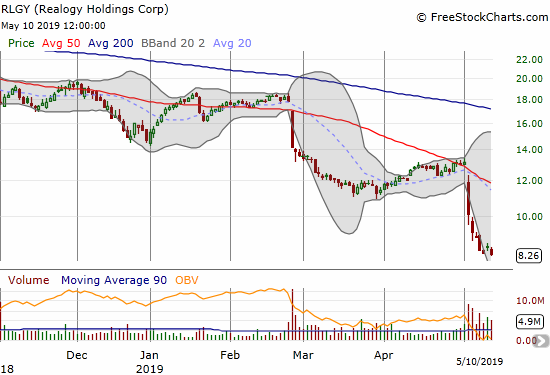
Realogy Holdings (RLGY)
Realogy Holdings (RLGY) includes a portfolio of real estate brokers. The stock has been hammered this year and thus caught my interest. I need to do some homework to understand the issues before I decide to make any moves. RLGY came public in October, 2013 in the $30s and quickly topped out over the next two years. Sellers have pushed the stock downward ever since. RLGY trades at an all-time low now.
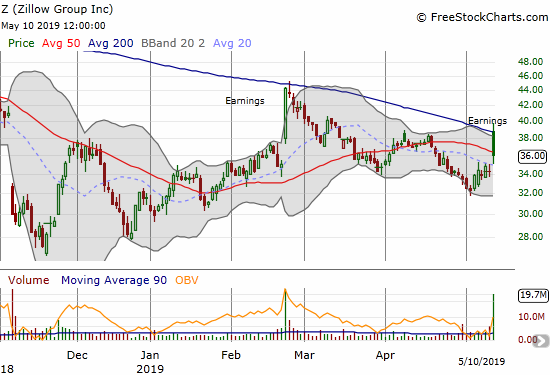
Zillow Group (Z)
In my last Housing Market Review, I explained why I took my remaining profits in Zillow Group (Z). I was surprised that the company turned around and reported strong results from its house-flipping business. The stock responded with an initial 13.2% gain and even a 200DMA breakout. However, sellers took over from there and almost erased all the post-earnings gains. The stock ended the day right back in a bearish position below its 50DMA and a fresh confirmation of 200DMA resistance.
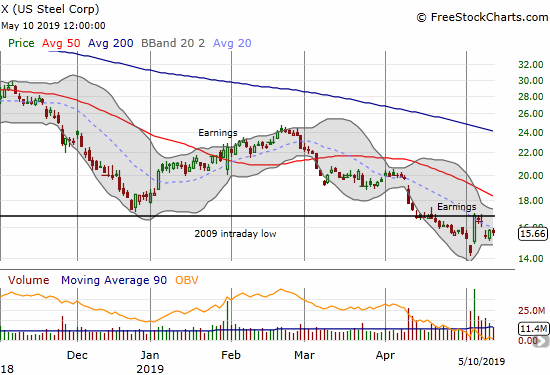
U.S. Steel (X)
U.S. Steel (X) rebounded with a strong response to earnings in early May. The stock has failed to make any further progress. The stock looks as bearish as ever even as the post-earnings response created an abandoned baby bottom as a prospective support level. Note the continued importance of X’s 2009 intraday low.
Stock Chart Reviews – Bullish
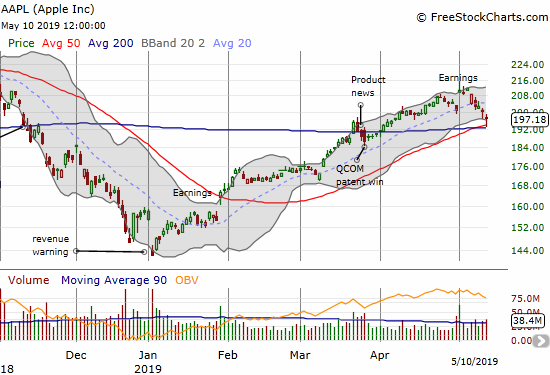
Apple (AAPL)
I am surprised the NASDAQ was able to close flat even with Apple (AAPL) losing 1.8% on the day. I bought into this dip aggressively for the weekly call option strategy as I like the bounce off converged 50 and 200DMA support. AAPL should be a prime beneficiary of a market relief rally.
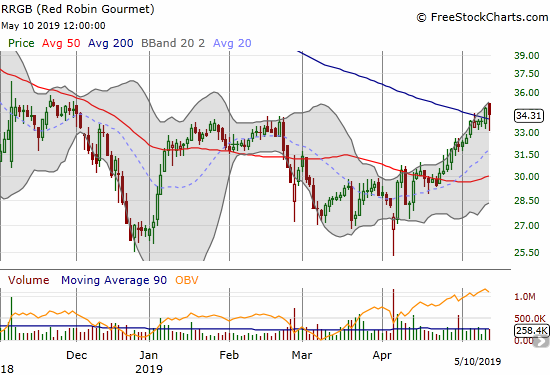
Red Robin Gourmet (RRGB)
I love the turkey burgers at Red Robin Gourmet (RRGB), but I was dismayed after a nearby location closed a few years ago. Now those turkey burgers are an even more special treat. The stock peaked in 2015 and has yet to create a good risk/reward buying point since then. Last week’s 200DMA breakout may finally be my signal to buy for a long-term hold. At its lows, RRGB traded at a 7-year low.
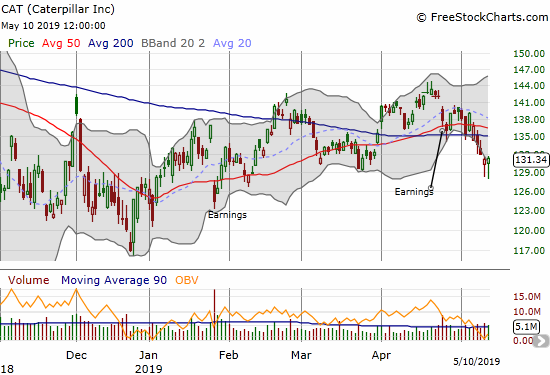
Caterpillar (CAT)
Caterpillar (CAT) confirmed a 200DMA breakdown, but it held support at the March lows. Like the general market, CAT printed a double hammer to end the week. I put CAT in the bullish section because I strongly suspect these hammers set up CAT for a rebound to resistance. I am ready to reload on put options at that point…
— – —
FOLLOW Dr. Duru’s commentary on financial markets via email, StockTwits, Twitter, and even Instagram!
“Above the 40” uses the percentage of stocks trading above their respective 40-day moving averages (DMAs) to assess the technical health of the stock market and to identify extremes in market sentiment that are likely to reverse. Abbreviated as AT40, Above the 40 is an alternative label for “T2108” which was created by Worden. Learn more about T2108 on my T2108 Resource Page. AT200, or T2107, measures the percentage of stocks trading above their respective 200DMAs.
Active AT40 (T2108) periods: Day #88 over 20%, Day #86 over 30%, Day #81 over 40% (overperiod), Day #4 under 50% (underperiod), Day #4 under 60%, Day #47 under 70%
Daily AT40 (T2108)
")
Black line: AT40 (T2108) (% measured on the right)
Red line: Overbought threshold (70%); Blue line: Oversold threshold (20%)
Weekly AT40 (T2108)

*All charts created using FreeStockCharts unless otherwise stated
The T2108 charts above are my LATEST updates independent of the date of this given AT40 post. For my latest AT40 post click here.
Related links:
The AT40 (T2108) Resource Page
You can follow real-time T2108 commentary on twitter using the #T2108 or #AT40 hashtags. T2108-related trades and other trades are occasionally posted on twitter using the #120trade hashtag.
Be careful out there!
Full disclosure: long UVXY call spread,long IWM calls, long AUD/JPY (as a hedge), long AAPL calls, long SSTI, long QQQ puts (5/13/19 correction)
*Charting notes: FreeStockCharts stock prices are not adjusted for dividends. TradingView.com charts for currencies use Tokyo time as the start of the forex trading day. FreeStockCharts currency charts are based on Eastern U.S. time to define the trading day.
Ole Friend, Kindly place ROKU on your radar. Should you be unaware, ROKU is a alternate cable TV proxy or cable cutters.
Definitely on my radar! I have actually been juggling a hedged position to small effect.