
AT40 = 52.9% of stocks are trading above their respective 40-day moving averages (DMAs) (4-month high)
AT200 = 22.4% of stocks are trading above their respective 200DMAs (4-week high)
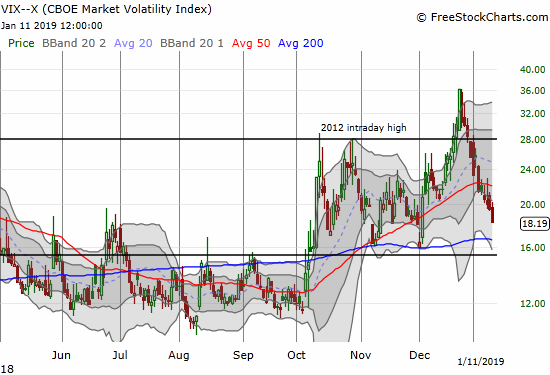
VIX = 18.2 (5-week low)
Short-term Trading Call: cautiously bullish
Commentary
The major indices are still showing signs of exhaustion, but the sellers have yet to wrest back control of the stock market. I am still finding a good number of individual stocks that are breaking above critical resistance levels and doing enough to keep boosting AT40 (T2108), the percentage of stocks trading above their respective 40-day moving averages (DMAs). AT40 closed the week at a 4-month high. AT200 (T2107), the percentage of stocks trading above their respective 200DMAs, continues to demonstrate the depth of the market’s technical damage by only nudging higher to 22.4%, a 4-week high.
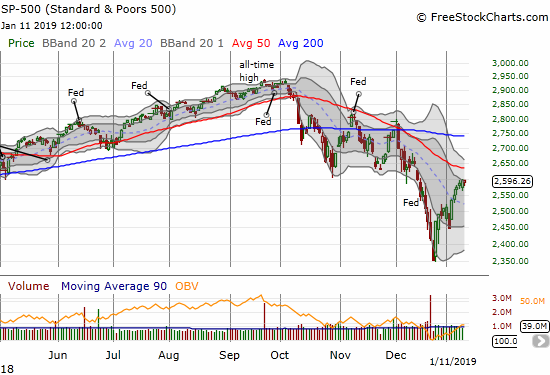
On Friday, the S&P 500 (SPY) dipped ever so slightly and recovered to flatline. The intraday ranges on the index are tightening, perhaps in anticipation of the next major (explosive) catalyst.
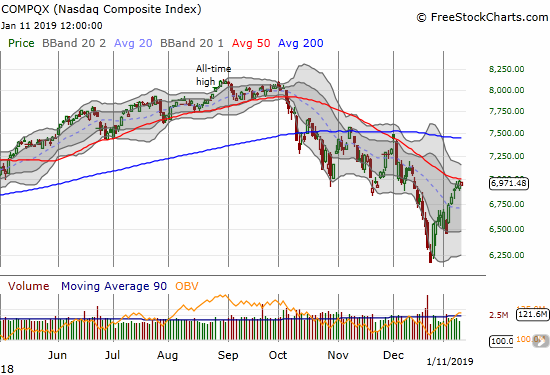
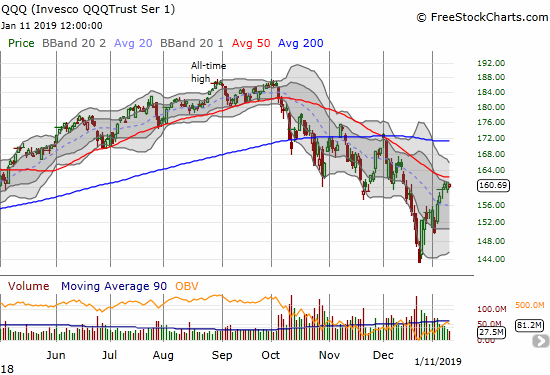
The NASDAQ and the Invesco QQQ Trust (QQQ) are also still exhibiting signs of exhaustion as their intraday ranges contract under critical resistance.
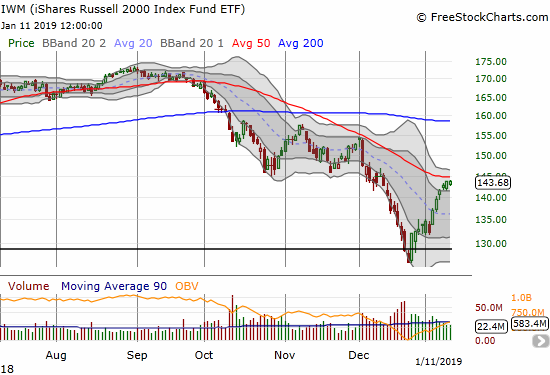
The iShares Russell 2000 ETF (IWM) is showing a bit more life than the other major indices, but it too is showing clear hesitance just below 50DMA resistance.
The increasing calm has taken its toll on the volatility index, the VIX. Still, I decided to use this drop as an opportunity to add another long volatility bet.
My trading call stays at cautiously bullish as I wait to see whether buyers can summon fresh strength to push the major indices over resistance. I am skeptical, but trying to stay open-minded. If the indices get soundly rejected, I will not flip bearish. Instead, I will significantly reduce short-term buys and add one more bearish position as hedge, likely QQQ put options. If the indices push forward above their 50DMAs, I will forget about bearish positions until the next critical juncture like AT40 stretching for overbought levels or a fresh 50DMA breakdown.
CHART REVIEWS
Netflix (NFLX)
The big drive upward continued for NFLX. While I noted earlier why I dropped NFLX from my list of stocks to short as a hedge, I am still amazed at the near relentless rise in the stock. Analysts have rushed to upgrade the stock ahead of earnings after hours on January, 17th. The optimism is swelling with the 200DMA breakout, so earnings should deliver plenty of fireworks….up or down.
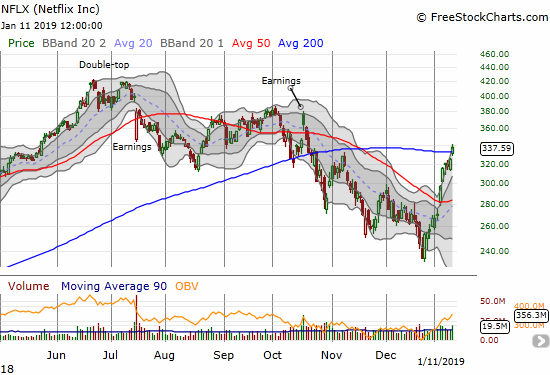
The tweet below covers the risk/reward set up for a recommended put spread play ahead of earnings: February $330/$270. I plan on trying a trade AFTER earnings.
Investors have been binging on Netflix heading into earnings, but @RiskReversal sees a downturn on the horizon $NFLX pic.twitter.com/pLlli9Kr8R
— Options Action (@OptionsAction) January 11, 2019
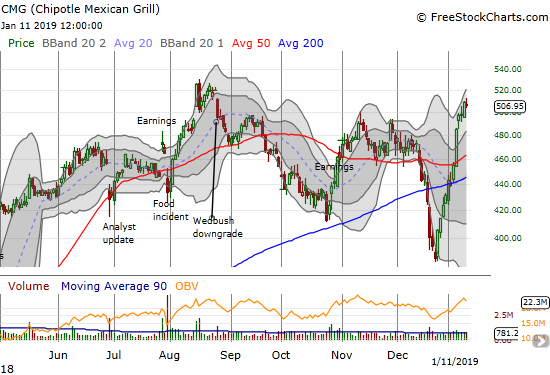
Chipotle Mexican Grill (CMG)
CMG is another stock whose near relentless buying is surprising me. CMG is already challenging its 2018 high.
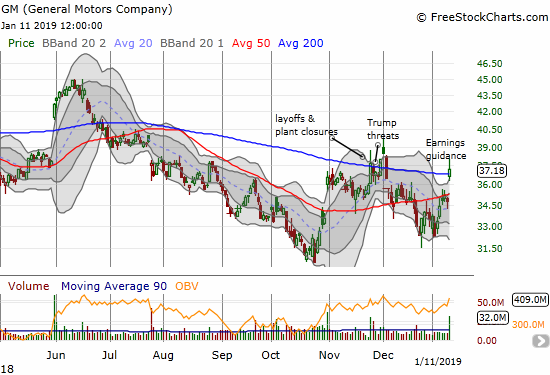
General Motors (GM)
GM rolled out guidance that reinvigorated the stock. It was enough to create a 200DMA breakout and help AT200 nudge higher.
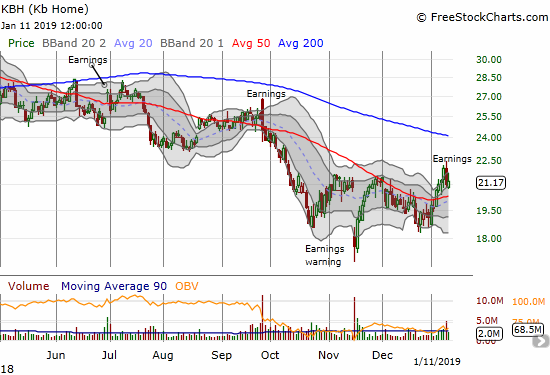
KB Home (KBH)
The pre-KBH earnings play did not work out as traders went back to their regularly scheduled programming of fading home builders post-earnings. I will have more details on earnings in another post.
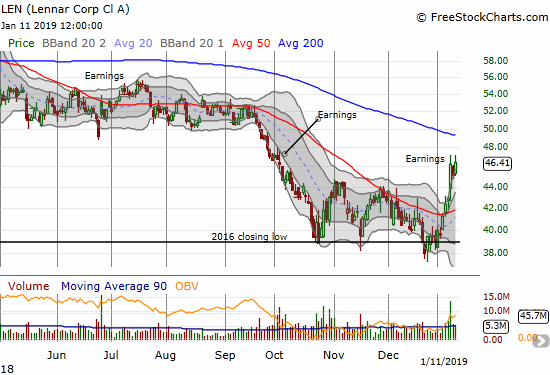
Lennar (LEN)
LEN faded in sympathy with the response to KBH earnings, but buyers returned to close the week out at a new post-earnings high. Although the stock is very stretched to the upside, LEN should soon complete a run at its declining 200DMA. The buying in LEN has been strong enough to turn the 50DMA upward which makes LEN a good buy-the-dip candidate.
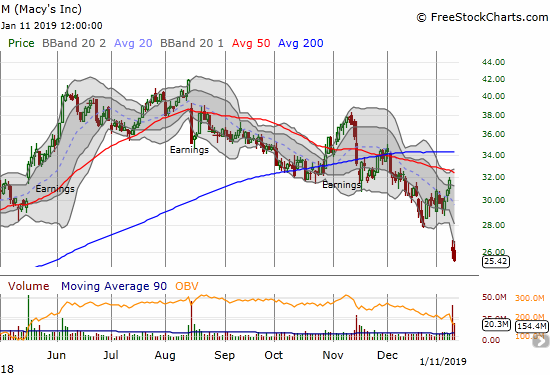
Macy’s (M)
Macy’s stunk up the joint last week with terrible earnings guidance based on a poorer than expected holiday season. I honestly thought the holidays were just fine for retailers. Now I am even more bearish on retail stocks as a whole with a few select exceptions (like auto parts retailers). Macy’s dropped 17.7% on Thursday and fell another 2.6% on Friday to confirm that investors are scrambling to exit. Macy’s now has an enticing 5.0% dividend yield, so I am keeping an eye on the stock again.
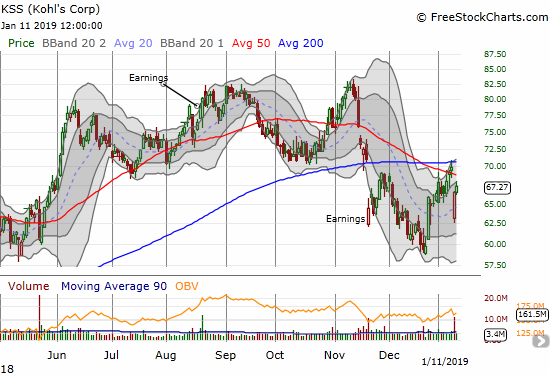
Kohl’s (KSS)
KSS gapped down in sympathy with Macy’s, but buyers immediately drove the stock upward into the gap. While resistance is essentially confirmed between the 50 and 200DMAs, the immediate buying interest means hope remains for the stock until/unless it closes below Thursday’s intraday low.
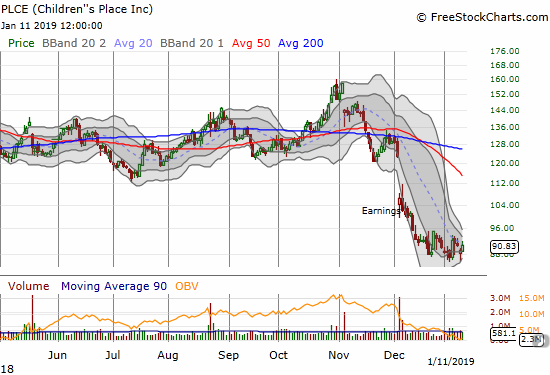
Children’s Place (PLCE)
I bought into a calendar call spread in PLCE in anticipation of the consolidation eventually breaking out to the upside. I was relieved to see that PLCE’s version of post-Macy’s sympathy selling failed to break below the consolidation range. PLCE took a beating in last month’s earnings, so this is a play targeting resistance from the rapidly declining 50DMA.
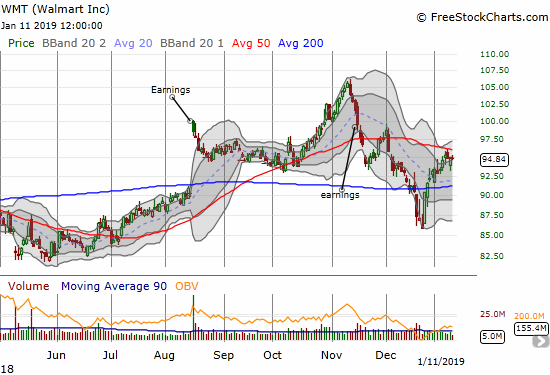
Walmart (WMT)
Even WMT dropped in sympathy with Macy’s. Buyers quickly stepped in and filled the gap down. Still, overhead 50DMA resistance looms large for the stock.
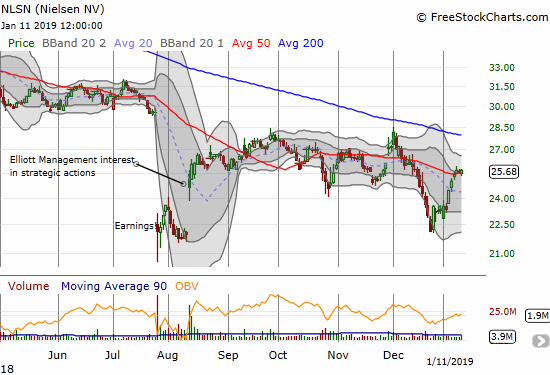
Nielsen (NLSN)
I still have a year left on my NLSN trade, but I feel negligent after failing to take advantage of the historic oversold period to double down on my position. NLSN even managed a picture-perfect fill of its gap in August.
— – —
FOLLOW Dr. Duru’s commentary on financial markets via email, StockTwits, Twitter, and even Instagram!
“Above the 40” uses the percentage of stocks trading above their respective 40-day moving averages (DMAs) to assess the technical health of the stock market and to identify extremes in market sentiment that are likely to reverse. Abbreviated as AT40, Above the 40 is an alternative label for “T2108” which was created by Worden. Learn more about T2108 on my T2108 Resource Page. AT200, or T2107, measures the percentage of stocks trading above their respective 200DMAs.
Active AT40 (T2108) periods: Day #6 over 20%, Day #4 over 30%, Day #3 over 40%, Day #2 over 50% (overperiod), Day #92 under 60% (underperiod), Day #147 under 70%
Daily AT40 (T2108)
")
Black line: AT40 (T2108) (% measured on the right)
Red line: Overbought threshold (70%); Blue line: Oversold threshold (20%)
Weekly AT40 (T2108)

*All charts created using freestockcharts.com unless otherwise stated
The T2108 charts above are my LATEST updates independent of the date of this given AT40 post. For my latest AT40 post click here.
Related links:
The AT40 (T2108) Resource Page
You can follow real-time T2108 commentary on twitter using the #T2108 or #AT40 hashtags. T2108-related trades and other trades are occasionally posted on twitter using the #120trade hashtag.
Be careful out there!
Full disclosure: long SSO, long KBH calls, long NLSN calls, long PLCE calendar call spread
*Charting notes: FreeStockCharts.com stock prices are not adjusted for dividends. TradingView.com charts for currencies use Tokyo time as the start of the forex trading day. FreeStockCharts.com currency charts are based on Eastern U.S. time to define the trading day.