
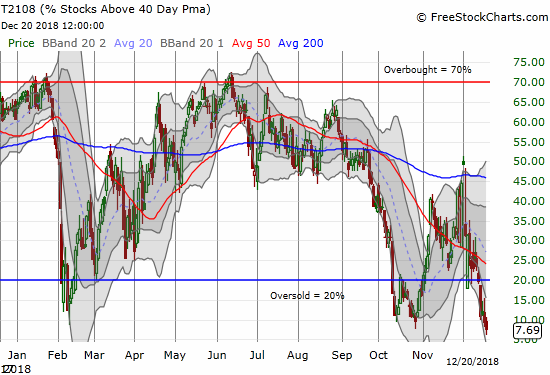
AT40 = 9.4% of stocks are trading above their respective 40-day moving averages (DMAs) (oversold day #5, 35-month low!)
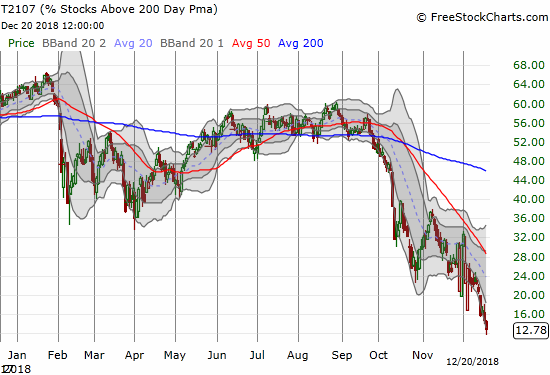
AT200 = 12.8% of stocks are trading above their respective 200DMAs (new 34-month low)
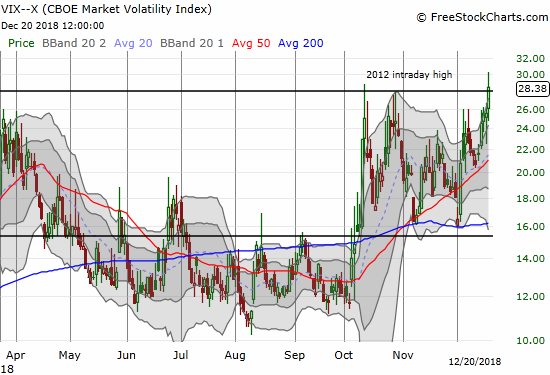
VIX = 28.4 (10-month high, intraday high at 30.3)
Short-term Trading Call: bullish (caveats below!)
Commentary
The plunge continues.
AT40 (T2108), the percentage of stocks trading above their respective 40DMAs, ended the day at a 35-month low. It finally cleared all the earlier oversold periods of 2018 and reached all the way back to the pain of late 2015. This oversold period is now 4 days old but it feels like it has lasted for weeks and weeks.
AT200 (T2107), the percentage of stocks trading above their respective 200DMAs, also continued its plunge but stayed out of single digits. At 12.8% it trades at a fresh 34-month low.
As a reminder, the level of these breadth indicators no longer matter. They are so low that they cannot go much lower. Moves lower do not even say anything about rates of change. The technical damage is so brutal that a vast swath of stocks are tumbling in short to medium term downtrends. I am bullish only in anticipation of the inevitable bounce, but the rally will likely serve as another opportunity for slower hands to dump their inventory of stocks and ETFs. (See “A Fed Undeterred Is A Stock Market Not Yet Low Enough” for a more expansive description).
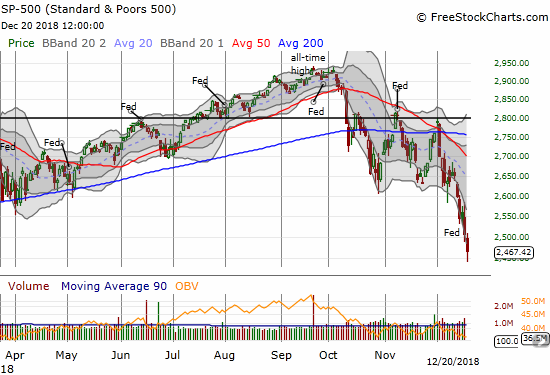
The S&P 500 (SPY) gapped down but rallied quickly to close the gap. The index was mostly downhill from there for a 15-month low.
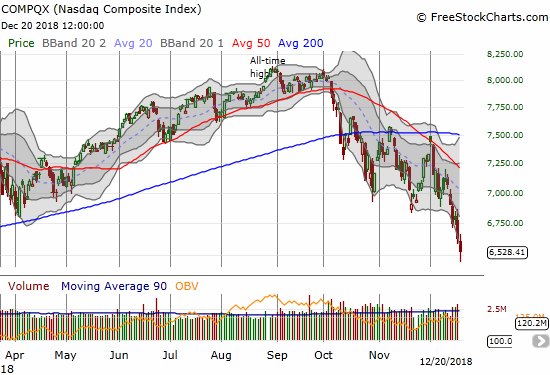
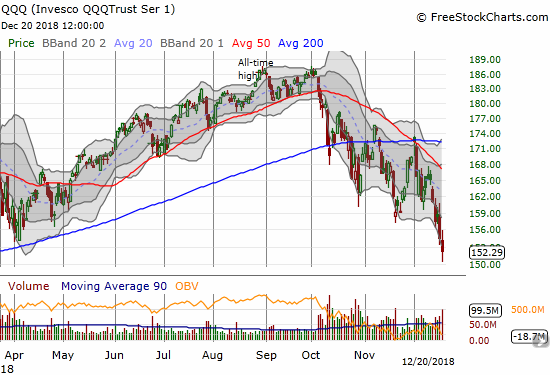
The NASDAQ and the Invesco QQQ Trust (QQQ) sold off for 1.6% and 1.5% losses and 14 and 15-month lows respectively.
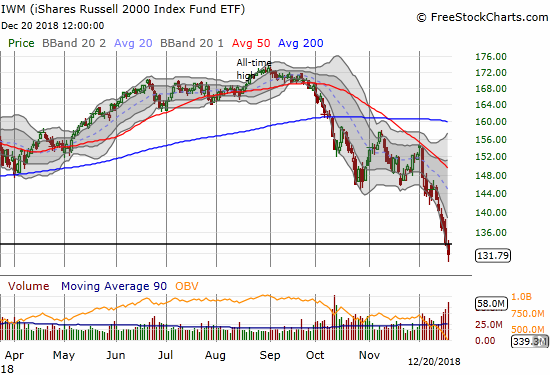
The iShares Russell 2000 ETF (IWM) reached a very important low. The 2-year low brings the index of small cap stocks within sniffing range of a complete reversal of its post-election gains. The day after the U.S. Presidential election IWM surged for a 3.8% gain and a close of 122.54. IWM has gone from an astounding 41.2% gain since that close at its last all-time high to a mere 7.5% gain. That plunged occurred in less than 4 months.
The volatility index, the VIX, provided one “bright” spot for the oversold period. It finally showed a relatively greater level of fear; it is the kind of higher volatility I would expect for a sell-off which is worse and more back-breaking than the other sell-offs of 2018. The VIX finally punched through 26 and even hit 30.
The small incremental spike in the VIX was my fresh signal to take profits on most of my remaining hedges (gulp!) and to do a little more nibbling on long positions. For example, I bought some puts in ProShares Ultra VIX Short-Term Futures (UVXY). I held on buying SPY call options because I already own ProShares Ultra S&P500 (SSO). I am thus in no rush. I might add more shares, but I will wait on the calls until I see some evidence of buying interest…or of course if the market delivers a truly outsized spike in the VIX, like a 20%+ 1-day gain.
CHART REVIEWS
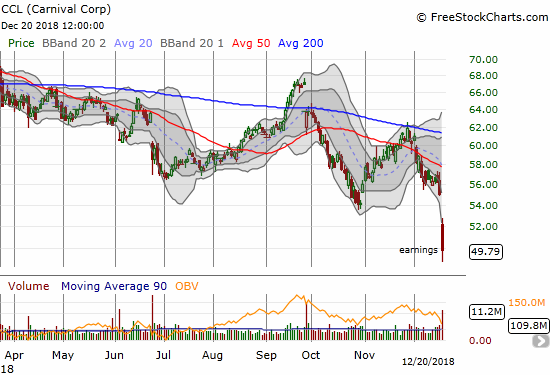
Carnival Cruise (CCL)
CCL reported earnings and delivered all sorts of bad news. This post-earnings plunge is a classic example of how a company can confidently report on the strength of its business and its accompanying business environment…until it is suddenly not so strong.
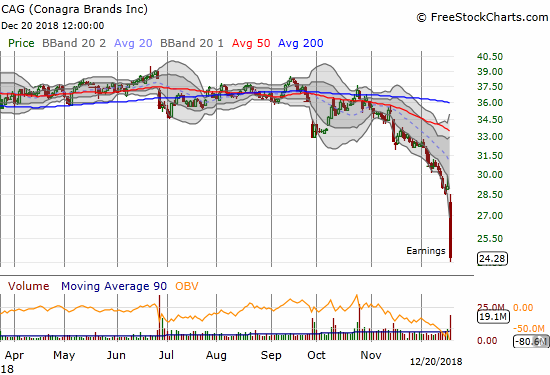
Conagra (CAG)
CAG was a shocker. The earnings report was full of pointers to hurricane-related impacts. If hurricanes and other one-off effects were truly at play here, then CAG just became a major buy. I am keeping my eye on this one (and I need to read the earnings report more closely soon).
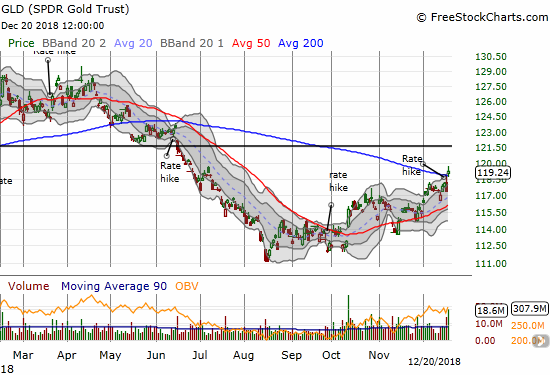
SPDR Gold Shares (GLD)
I was prepared to see GLD breakout above 200DMA resistance on the heels of a capitulated Fed. It took a day, but the breakout is finally here. I may have a tricky decision on Friday as my calendar call spread pivots on the $119 strike with the short side expiring now. I may just take profits and look next week to make a fresh (long) trade.
— – —
FOLLOW Dr. Duru’s commentary on financial markets via email, StockTwits, Twitter, and even Instagram!
“Above the 40” uses the percentage of stocks trading above their respective 40-day moving averages (DMAs) to assess the technical health of the stock market and to identify extremes in market sentiment that are likely to reverse. Abbreviated as AT40, Above the 40 is an alternative label for “T2108” which was created by Worden. Learn more about T2108 on my T2108 Resource Page. AT200, or T2107, measures the percentage of stocks trading above their respective 200DMAs.
Active AT40 (T2108) periods: Day #5 under 20% (5th oversold day), Day #10 under 30%, Day #12 under 40%, Day #62 under 50%, Day #78 under 60%, Day #133 under 70% {corrected 1/6/19}
Daily AT40 (T2108)
")
Black line: AT40 (T2108) (% measured on the right)
Red line: Overbought threshold (70%); Blue line: Oversold threshold (20%)
Weekly AT40 (T2108)

*All charts created using freestockcharts.com unless otherwise stated
The T2108 charts above are my LATEST updates independent of the date of this given AT40 post. For my latest AT40 post click here.
Related links:
The AT40 (T2108) Resource Page
You can follow real-time T2108 commentary on twitter using the #T2108 or #AT40 hashtags. T2108-related trades and other trades are occasionally posted on twitter using the #120trade hashtag.
Be careful out there!
Full disclosure: long SSO, long SPY call options, long GLD shares and calendar call spread
*Charting notes: FreeStockCharts.com stock prices are not adjusted for dividends. TradingView.com charts for currencies use Tokyo time as the start of the forex trading day. FreeStockCharts.com currency charts are based on Eastern U.S. time to define the trading day.
Wow.
The S&P closed at 2416 today. I suspected that it would close lower than yesterday, but not this low! It may even go lower, as hard as that is to imagine, before we get a bounce, as the VIX went up, but not to the extent I would have expected. That concerns me.
I don’t see any good fundamental reason (besides interest rates) for THIS much damage. Probably the government shutdown issue has something to do with it, but it’s hard to imagine it would have impact to this degree.
This feels more like the fall 2011 timeframe, where the market dropped precipitously, but then recovered nicely afterwards. Let’s hope it follows that path, and not…..something like 2008/2009…. But both were good buying opportunities. Baron Rothschild was of course right, if you can handle it. Few can.
In the meantime, can you smell the fear out there?
Your assessment matches mine. The continued reluctance of the VIX has to be a function of a lot of players simply stepping away. Just selling and not even bothering with the portfolio protection of puts. I am smelling hints of fear but nothing extreme. It’s hard to imagine, but I starting suspect we are heading for a complete reversal of the post election gains. I think this episode is more like 2008-2009. We should get a bounce before the “final” monster swoosh down.
I hate being this bearish when the breadth indicators are ridiculously oversold.
I don’t think it will go quite the way you are describing, but I would be happy if it did. That would create a fabulous buying opportunity. There isn’t enough economic weakness to support that kind of collapse. Not at this point, from the data that I’ve seen. Not unless there’s another serious ‘hidden’ problem, like the housing implosion that triggered the 2008-9 collapse, that hasn’t become more obvious yet.
Having said that, regardless of the real issues, the government shutdown along with recently reported news that Trump wants to ‘fire’ the Fed chair won’t help.
He can’t fire him, of course, but some people seem to think that there’s enough ambiguity in the law for Trump to replace him with another Fed governor, while allowing him to remain on the board. That wouldn’t change what the Board would do, but it would certainly push the market down, something it doesn’t really need any help with right now.
If so, and timed right, you could get the scenario you’re talking about.
I’ll be a much bigger buyer, should that happen.
I have a picture of the Baron on my office wall, standing in a bloody street.
If and when I need him to keep my nerve, he’ll be there.
It’ll be interesting either way. The extreme possibilities have been opened up like a floodgate, so I am trying to make sure I have a handle. The most extreme,I THINK, is a complete reversal of post election gains. Small caps are already closing in on that scenario. I don’t think we need awful fundamentals, we just need awful sentiment along with slower/slowing growth. The imagination of the market will then be wide open to the downside.