
AT40 = 35.5% of stocks are trading above their respective 40-day moving averages (DMAs)
AT200 = 31.6% of stocks are trading above their respective 200DMAs
VIX = 20.5
Short-term Trading Call: neutral
Commentary
via GIPHY
The bears took back complete control of the market. Friday, they sent up the warning signal with the screeching of the brakes. Today was full of body blows. The renewed technical damage was enough for me to downgrade my short-term trading call all the way to neutral even as I prepare to get bullish all over again for what looks like an imminent dance with yet another oversold period (AT40 (T2108) below 20%). I feel compelled to do so as November’s seasonally benign trading is under full assault.
The S&P 500 (SPY) went from Friday’s hope with the bounce off support at its 200-day moving average (DMA) to today’s slope with a definitive slice through support. The index lost a whopping 2.0% and closed in line with the low from October’s first oversold period. This 200DMA breakdown is as bearish as the first two and more ominous given the selling is a sharp reversal of almost all November’s gains…the same gains from the end of the second oversold period.
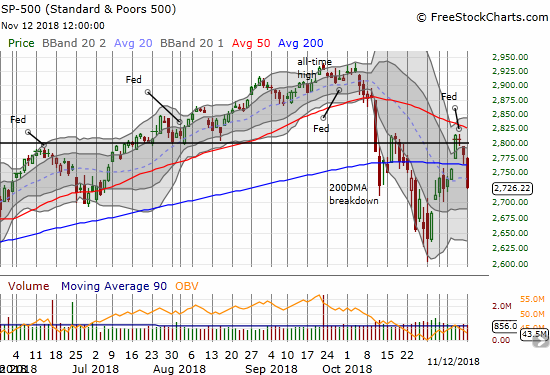
I am quite dismayed to note that the S&P 500 has sold off in the immediate wake of all but two of the Fed’s meetings this year….guess what I will be doing in preparation for December’s meeting!?
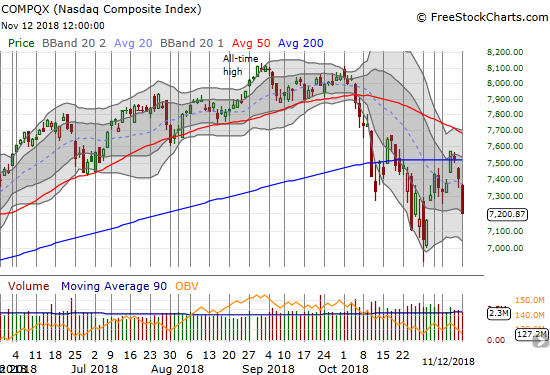
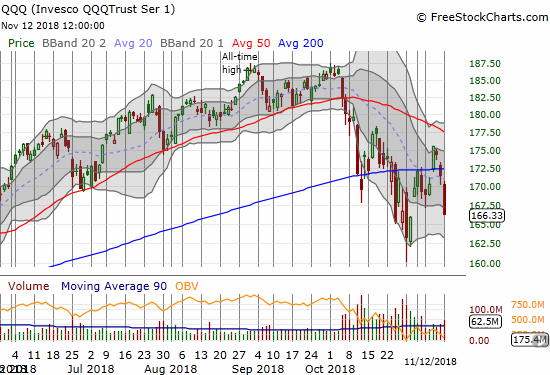
The tech-laden NASDAQ and the Invesco QQQ Trust (QQQ) looked bad on Friday with their 200DMA breakdowns. Monday was a loud confirmation of the selling pressure. The October lows are very much in play.
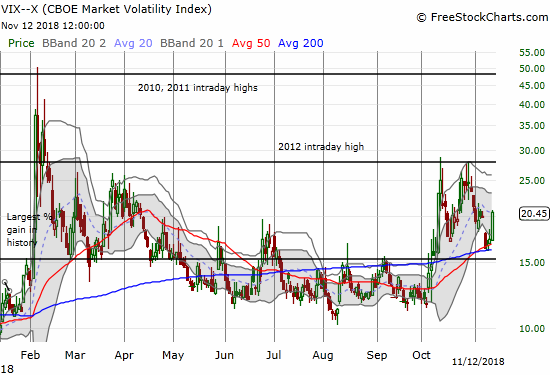
The volatility index, the VIX, added its own confirmation by surging 17.8% to 20.5.
The currency market roiled as well with the Australian dollar (FXA) versus the Japanese yen (JPY) plunging right through its own 200DMA support. (At the time of writing, the currency pair is trying to rebound).
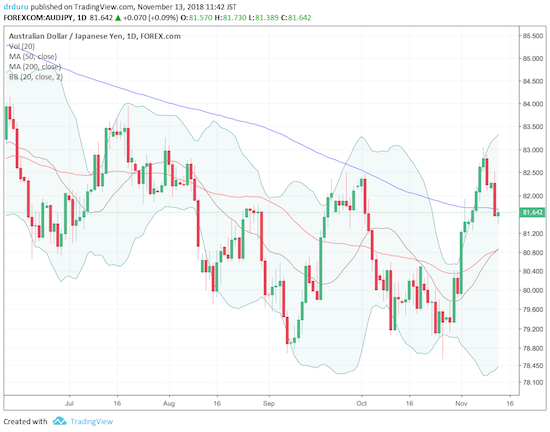
Source: Trading View
With all the extended technical damage, I was surprised to see that AT40 (T2108), the percentage of stocks trading above their respective 40DMAs, did not drop into oversold territory. AT40 closed at 30.3%, down from 35.5%. Even AT200 (T2107), the percentage of stocks trading above their respective 200DMAs, did not drop as much as I expected. This longer-term breadth indicator fell from 34.8% to 31.6%. Perhaps these smaller than expected losses on the breadth indicators provide shreds of residual bullishness. Still, these faint signs pale in comparison to the selling pressure that drove fresh 200DMA breakdowns.
Given my bullish positioning, Monday delivered quite the body blow. The selling was so fast, so deep, and so widespread, there was no amount of hedging that I could do to soften the blow given my bullish posture. I managed to flip some puts in QQQ, but it was small consolation. I also automatically executed my strategies for my (prior) bullish trading call: I bought back Intel (INTC) call options, Apple (AAPL) weekly calls, more SPY calls, and even more put options on ProShares Ultra VIX Short-Term Futures (UVXY). Needless to say, ALL these strategies are now on hold as I await oversold conditions and/or a fresh 200DMA breakout for the major indices. I had to take some smelling salts just to get my head back in the game and write this assessment of the action!
via GIPHY
CHART REVIEWS
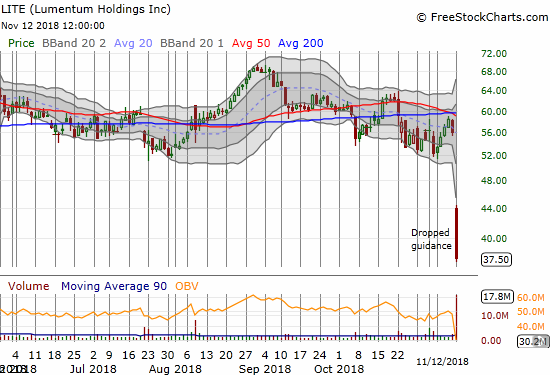
Lumentum Holdings (LITE)
LITE updated its guidance for Q2 2019, and it was ugly.
“We recently received a request from one of our largest Industrial and Consumer customers for laser diodes for 3D sensing to materially reduce shipments to them during our fiscal second quarter for previously placed orders that were originally scheduled for delivery during the quarter…”
The company tried in vain to reassure investors…
“With our proven ability to deliver high volumes, years of experience, hundreds of millions of devices in the field, and new product and customer funnel, we remain confident in our leadership position in the nascent market for laser diodes for 3D sensing.”
The end result was a 33.0% loss and a 21-month low.
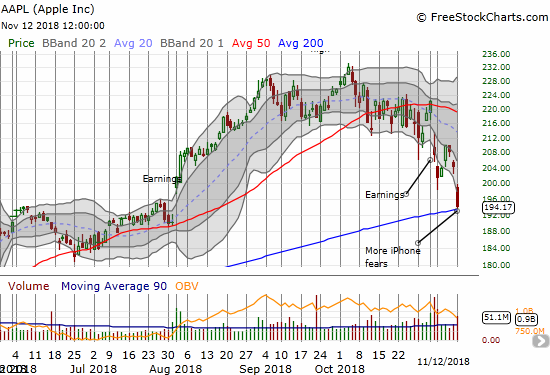
Apple (AAPL)
LITE’s bad news cascaded to AAPL in a big way. Sentiment was already hobbled on AAPL’s poor report on iPhone sales. LITE finished swiping the rug from under AAPL. Only tenuous 200DMA support remains. AAPL last broke this support in April.
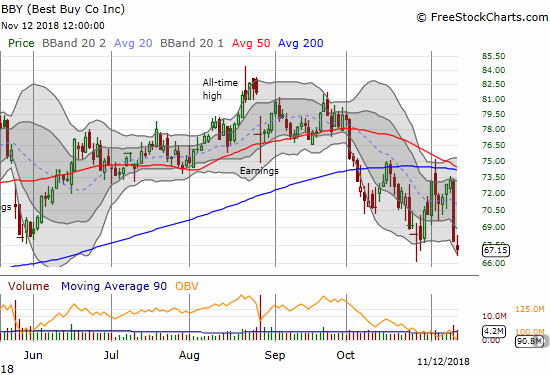
Best Buy (BBY)
I completely missed BBY’s plunge on Friday. Apparently, the stock dropped on news of a potential Amazon.com (AMZN) and AAPL partnership. Given Apple’s involvement, I am not treating this like a typical Amazon Panic buying moment. Moreover, BBY reports earnings next week the morning of November 20th.
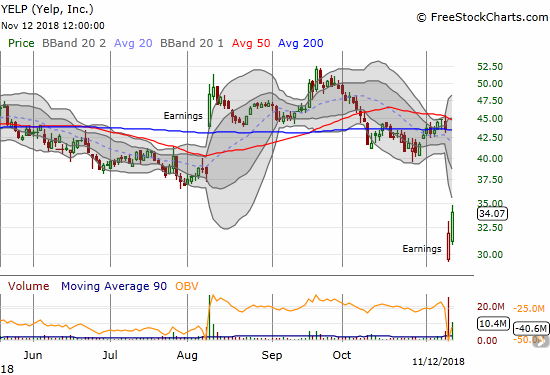
Yelp (YELP)
Looks like I may have been onto something buying YELP off the bottom. Too bad I flipped that position on Friday. Turns out options buyers are all over this stock. It gained 6.7% with the help of CNBC’s Halftime Report pointing out the buying. I daresay even amid the market sell-off, YELP looks like a buy on the dip.
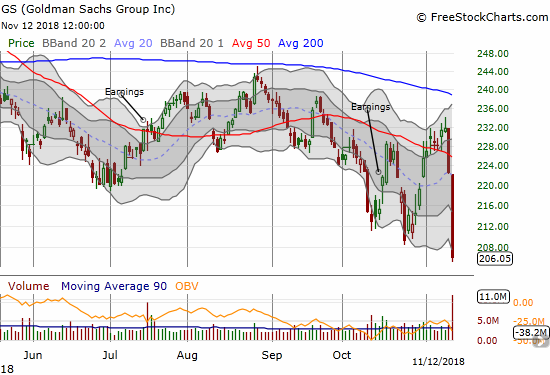
Goldman Sachs (GS)
GS has under-performed almost all year. It should not surprise me that the stock could drop 7.5% in one day, but it still did. GS closed at a 2-year low on more news from an expanding scandal in the Malaysian financial sector involving rogue Goldman bankers.
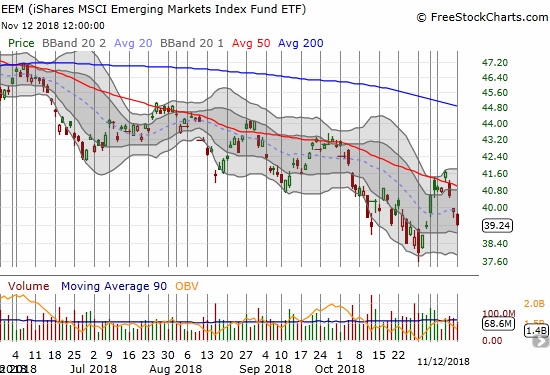
iShares MSCI Emerging Markets ETF (EEM)
EEM actually out-performed the major U.S. indices by “only” losing 1.4%. Still, the index on emerging market health confirmed it is trapped in a steep downtrend.
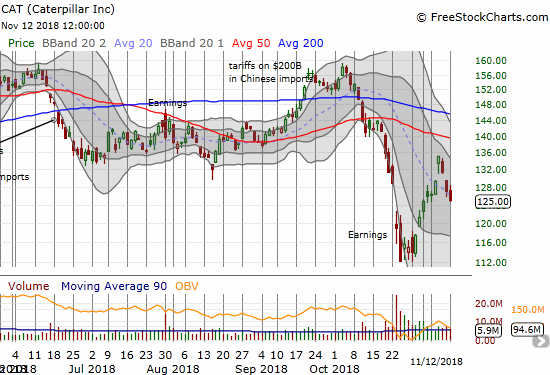
Caterpillar (CAT)
The selling in CAT triggered another purchase of put options. Something tells me I need a wheelbarrow full of them…
Euro (FXE) and the U.S. dollar (DXY)
The plunge in the euro caught my eye this morning. It added a lot more fuel to growing strength in the U.S. dollar. The U.S. dollar index broke out to a fresh 17-month high. I offer Marc Candler’s latest forex missive as at least a partial and plausible explanation of the currency action. This breakout in the dollar adds yet more pressure to U.S. multi-nationals, including the likes of AAPL and INTC.
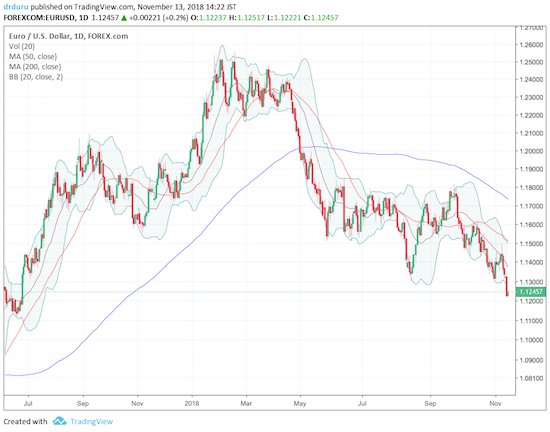
Source: Trading View
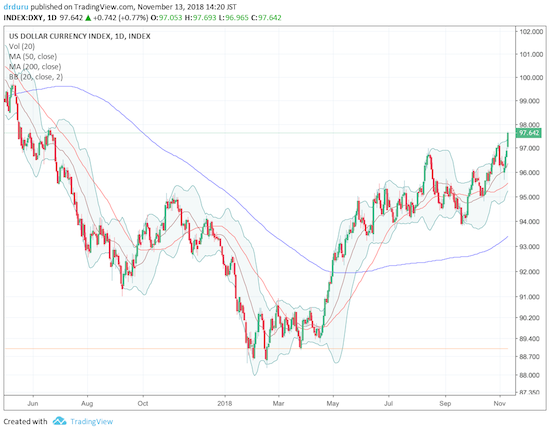
Source: Trading View
— – —
FOLLOW Dr. Duru’s commentary on financial markets via email, StockTwits, Twitter, and even Instagram!
“Above the 40” uses the percentage of stocks trading above their respective 40-day moving averages (DMAs) to assess the technical health of the stock market and to identify extremes in market sentiment that are likely to reverse. Abbreviated as AT40, Above the 40 is an alternative label for “T2108” which was created by Worden. Learn more about T2108 on my T2108 Resource Page. AT200, or T2107, measures the percentage of stocks trading above their respective 200DMAs.
Active AT40 (T2108) periods: Day #8 over 20%, Day #5 over 30% (overperiod), Day #2 under 40% (underperiod ending 2 days above 40%), Day #36 under 50%, Day #52 under 60%, Day #105 under 70%
Daily AT40 (T2108)
")
Black line: AT40 (T2108) (% measured on the right)
Red line: Overbought threshold (70%); Blue line: Oversold threshold (20%)
Weekly AT40 (T2108)

*All charts created using freestockcharts.com unless otherwise stated
The charts above are my LATEST updates independent of the date of this given AT40 post. For my latest AT40 post click here.
Related links:
The AT40 (T2108) Resource Page
You can follow real-time T2108 commentary on twitter using the #T2108 or #AT40 hashtags. T2108-related trades and other trades are occasionally posted on twitter using the #120trade hashtag.
Be careful out there!
Full disclosure: long SSO, long AAPL calls, long AUD/JPY, long CAT put, long AMZN calls, others mentioned above
*Charting notes: FreeStockCharts.com stock prices are not adjusted for dividends. TradingView.com charts for currencies use Tokyo time as the start of the forex trading day. FreeStockCharts.com currency charts are based on Eastern U.S. time to define the trading day.