
AT40 = 57.1% of stocks are trading above their respective 40-day moving averages (DMAs)
AT200 = 57.5% of stocks are trading above their respective 200DMAs
VIX = 12.9
Short-term Trading Call: neutral
Commentary
The momentum for FOMO (fear-of-missing-out) on the major indices effectively fizzled out with the start of post-summer trading.
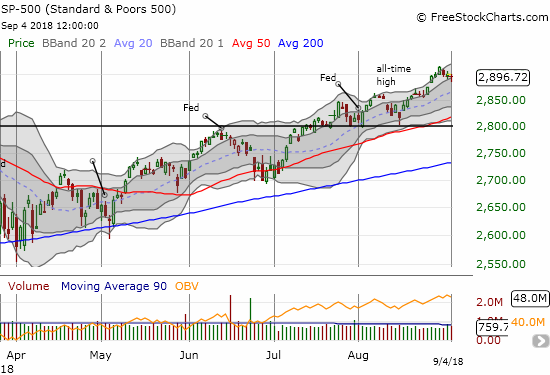
At one point, the S&P 500 (SPY) traded through the bottom of its upper Bollinger Band (BB) channel. Buyers were able to neatly bounce the index off its intraday low for a close that looks like it is part of a very orderly and benign pullback.
The tech-laden indices are idling away.
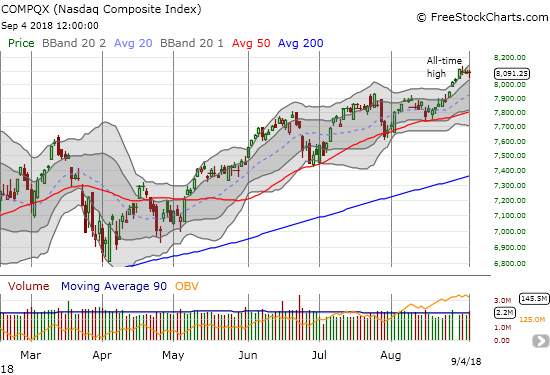
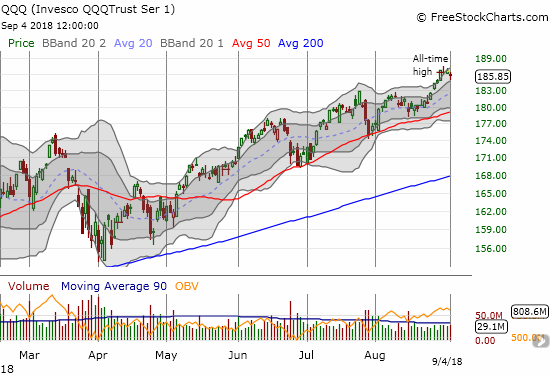
This lackluster moves are of course hardly the signatures of a market warming up for FOMO. So I more and more turn toward a read of the contrary signals.
The real story is AT40 (T2108), the percentage of stocks trading above their respective 40-day moving averages (DMAs). AT40 fell all the way to 52.9% and erased its August breakout. AT40 is exposing underlying weakness in the market that is being masked by the few stocks attracting a large portion of the market’s buying power. The trading action is a borderline bearish divergence. AT200 (T2107), the percentage of stocks trading above their respective 200-day moving averages (DMAs), tumbled in similar fashion to AT40.
The Australian dollar (FXA) added its own confirmation of wariness as fresh selling pressure in emerging markets invaded what I saw as bullish talking points from the Reserve Bank of Australia (RBA). At the time of typing, the Australian dollar finished reversing all its post-RBA gains against the Japanese yen (FXY). I am staying long AUD/JPY for now as my trading thesis remains intact despite the setback. Still, this pressure makes me incrementally less convinced that the U.S. stock market is on the edge of going FOMO.
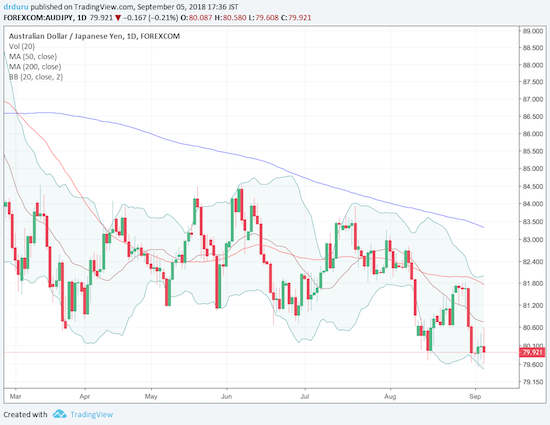
Source: Trading View
CHART REVIEWS
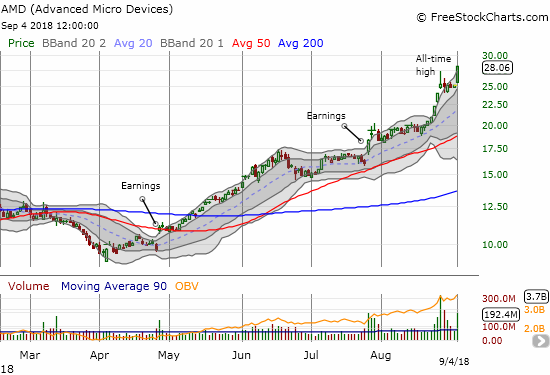
Advanced Micro Devices (AMD)
The AMD march higher looks far from over all over again. Analysts upgraded AMD and saved the day from a confirmation of a blow-off top. I was forced to flip from bearish to bullish by adding a calendar spread to my mix. Much to my surprise, my sell target, a near double, was hit within 90 minutes. I calculated the upside target of the calendar spread when AMD traded at $26.5; I concluded that the options market was anticipating a $28 close by the end of the week. I pinned my calendar call spread there. The stock hit that target by the close of the day and another all-time high.
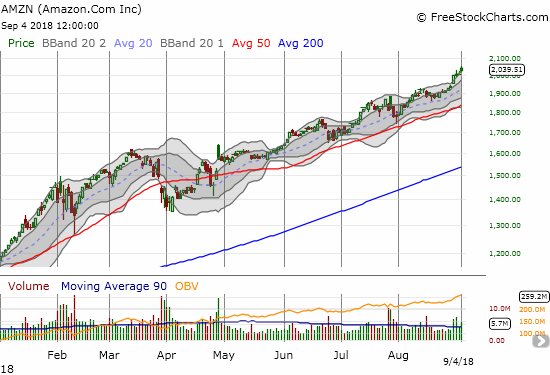
Amazon.com (AMZN)
A chart review for today has to include Amazon.com which celebrated hitting the $1 trillion mark. With my expectations for FOMO (fear of missing out) launching in earnest in September, I intended to be positioned for today’s latest AMZN surge. However, the calendar call spreads I put in place last week actually closed out at my first sell targets. I actually wanted at least one of them to experience the expiration of the short side leaving me with an unhedged call option to start this week.
I am not interested in chasing further, especially without enough of the market in FOMO mode. Fast Money’s resident technician Carter Worth anticipates an imminent pullback…the case makes plenty of sense to me.
Will $AMZN's amazing run come to an end? Chart Master Carter Worth takes a look at its technical picture. pic.twitter.com/E0fLKKydn3
— CNBC's Fast Money (@CNBCFastMoney) September 4, 2018
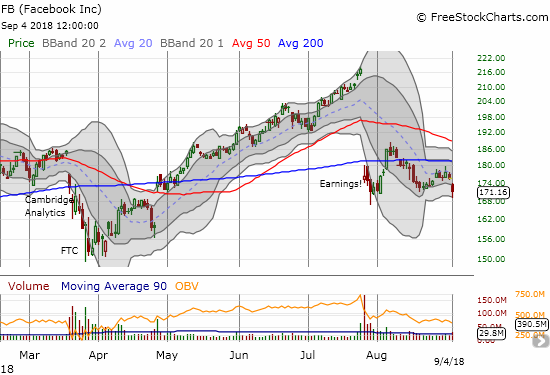
Facebook (FB)
In the above video, Worth also covered the bearish technicals in FB. The stock gapped down for a 2.6% loss that reconfirmed the growing bearishness in the stock. I faded the first intraday bounce to get a single put option (Sept 21 $165). If it gets cheaper, I will buy more. I am anticipating taking profits well ahead of expiration. This is my third trip going bearish on FB that started with a pre-earnings trade.
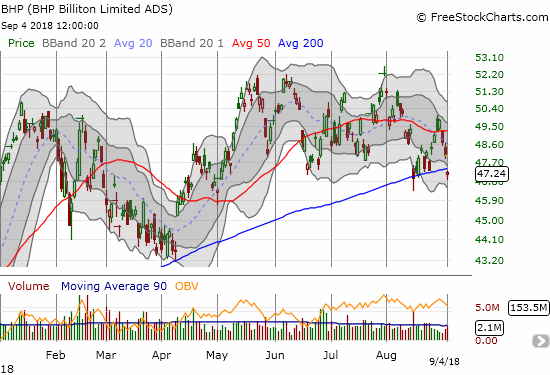
BHP Billiton (BHP)
Commodities were a large part of the day’s contrary story. The stock lost 1.7% and gapped down one more time below its 200DMA. I promptly took profits on my put options. Needless to say the long side of the pairs trade went worthless some time ago (Rio Tinto (RIO)).
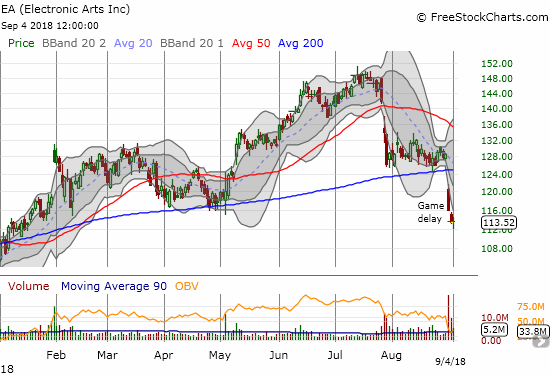
Electronic Arts (EA)
EA had been a good story this year and represented a strong play on the gaming culture. However, after a post-earnings gap down and a gap down following news of a game delay, EA is suddenly a broken stock. This is a definitive bearish pattern, but hope springs eternal given the bullish story was just around the last corner. The folks at CNBC’s Options Action discussed the merits of making a bullish play with a “risk reversal” options setup with November expirations after the October earnings report: sell the $100 put to help pay for a $120 call. Since I am not particularly interested in taking the risk of being put the stock under $100, I am considering selling a put spread instead. Like Guy Adami in the clip below, I would prefer to do this trade after the stock makes one more push downward.
Video game stocks just got slammed, but @RiskReversal has a trade to make money on $EA. pic.twitter.com/dI1gQyCZAf
— Options Action (@OptionsAction) August 31, 2018
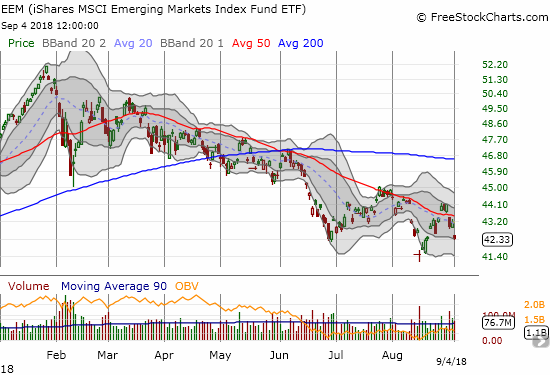
iShares MSCI Emerging Markets ETF (EEM)
EEM is a handy reminder that the synchronized global growth story ended earlier this year and has yet to revive itself. EEM is also a stark contrast to the U.S. price action.
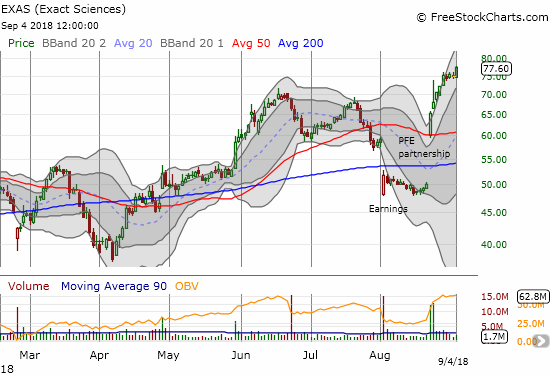
Exact Sciences (EXAS)
I have wanted to participate in EXAS for a long time. I took it off my radar when it broke down in the Spring. I eyed an entry when it pulled back from a run-up in June and July, but the post-earnings gap down discouraged me again. Last month’s surge and recovery of course caught me completely off-guard. I waited each day for some cooling off that never arrived. I finally jumped in on today’s breakout with a “no regret” call spread. I was surprised at the low trading volume on the call options which also did not seem priced for much for upside. I stop out if the breakout reverses (below $72.50 for some buffer).
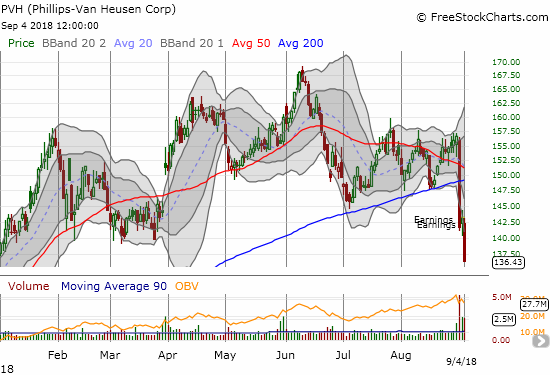
PVH Corp. (PVH)
PVH was a good retail story until its last earnings report. The post-earnings breakdown makes PVH a broken stock with an ominous topping pattern.
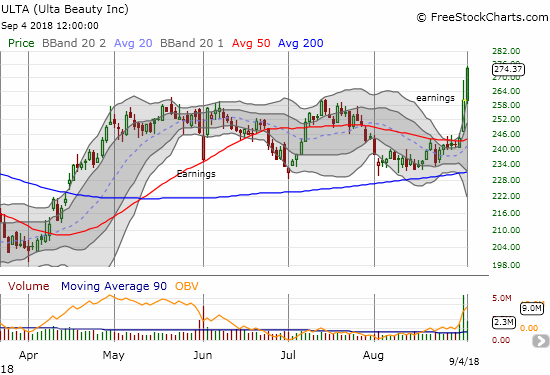
Ulta Beauty (ULTA)
Do not lament retail just yet. There is always a great story around the corner. ULTA caught me completely off-guard. I am pretty sure the stock was trading down in after hours post-earnings. It opened Friday with a gap up and an impressive 6.4% despite a large fade off the intraday high. Buyers went right back to work on Tuesday and sent the stock up another 5.5%. THIS is what FOMO looks like. Needless to say, this breakout flips me right back to bullish on ULTA.
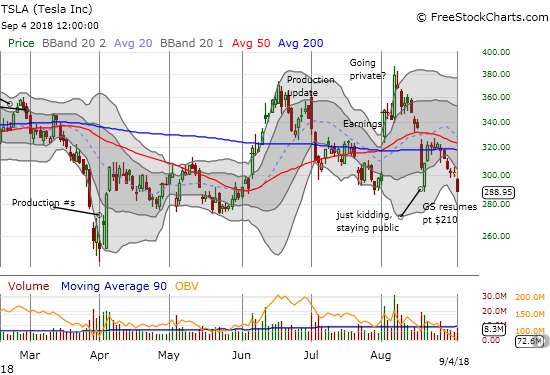
Tesla (TSLA)
As I feared after CEO Elon Musk essentially admitted he never had funding secured for going private, the stock is becoming less and less attractive. No doubt disappointed it will not earn any banking fees from a massive TSLA going private deal, Goldman (GS) reiterated its bearish positioning on the stock. TSLA gapped down and closed at its intraday low for a 4.2% loss. The $280 support level looks like it is back in play. I am itching to dump my shares here, but I will hold for now as I ride another put spread through this selling.
— – —
FOLLOW Dr. Duru’s commentary on financial markets via email, StockTwits, Twitter, and even Instagram!
“Above the 40” uses the percentage of stocks trading above their respective 40-day moving averages (DMAs) to assess the technical health of the stock market and to identify extremes in market sentiment that are likely to reverse. Abbreviated as AT40, Above the 40 is an alternative label for “T2108” which was created by Worden. Learn more about T2108 on my T2108 Resource Page. AT200, or T2107, measures the percentage of stocks trading above their respective 200DMAs.
Active AT40 (T2108) periods: Day #136 over 20%, Day #105 over 30%, Day #100 over 40%, Day #13 over 50% (overperiod), Day #3 under 60% (underperiod), Day #56 under 70%
Daily AT40 (T2108)
")
Black line: AT40 (T2108) (% measured on the right)
Red line: Overbought threshold (70%); Blue line: Oversold threshold (20%)
Weekly AT40 (T2108)

*All charts created using freestockcharts.com unless otherwise stated
The charts above are my LATEST updates independent of the date of this given AT40 post. For my latest AT40 post click here.
Related links:
The AT40 (T2108) Resource Page
You can follow real-time T2108 commentary on twitter using the #T2108 or #AT40 hashtags. T2108-related trades and other trades are occasionally posted on twitter using the #120trade hashtag.
Be careful out there!
Full disclosure: long SPY puts, long AMD puts, long AUD/JPY, long FB puts, long EXAS call spread; long TSLA shares, call spread, and put spread
*Charting notes: FreeStockCharts.com stock prices are not adjusted for dividends. TradingView.com charts for currencies use Tokyo time as the start of the forex trading day. FreeStockCharts.com currency charts are based on Eastern U.S. time to define the trading day.