
AT40 = 65.8% of stocks are trading above their respective 40-day moving averages (DMAs)
AT200 = 55.5% of stocks are trading above their respective 200DMAs (a 4-month high)
VIX = 12.8
Short-term Trading Call: bearish
Commentary
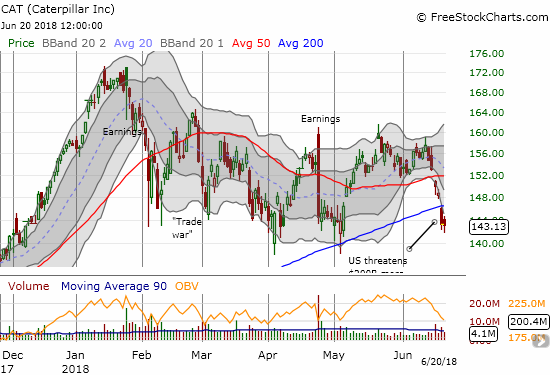
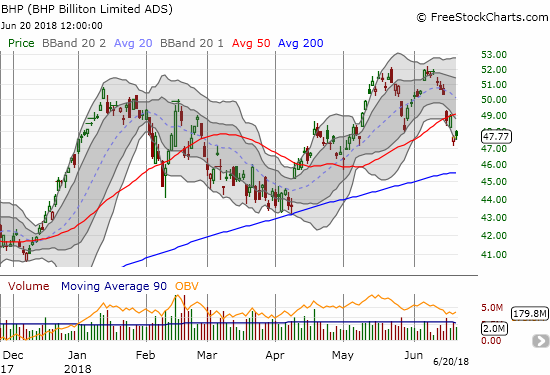
The stock market is oozing with divergences as a result of global trade wars, especially the escalating spat between the U.S. and China. One part of the market is too connected to China to move higher. Some stocks like Caterpillar (CAT) and a whole basket of commodity-related plays are falling hard as investors brace for a weaker Chinese economy.
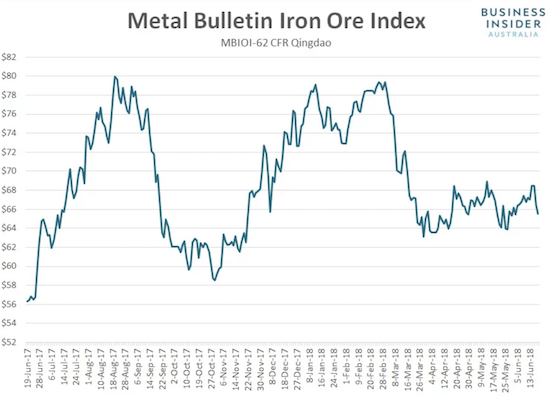
Source: Business Insider
(Per my strategy, I faded Monday’s comeback in BHP and turned right around and took profits on Tuesday’s subsequent gap down. I only WISH I had stayed consistent in holding puts on CAT!).
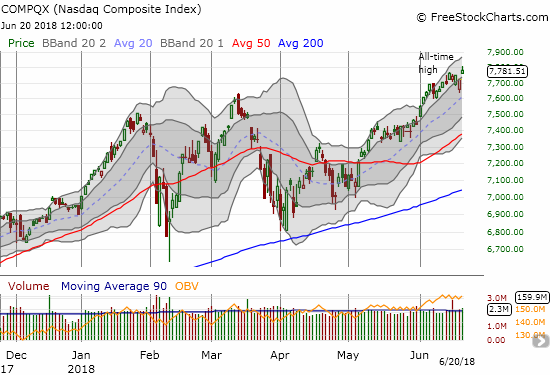
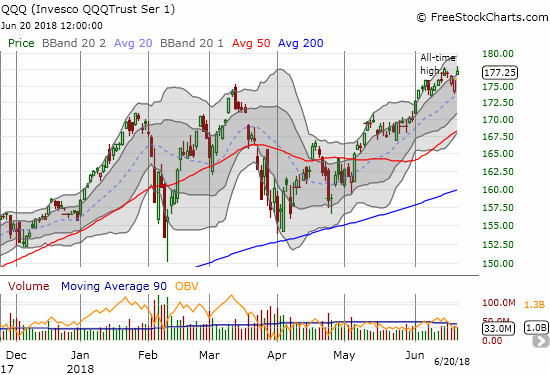
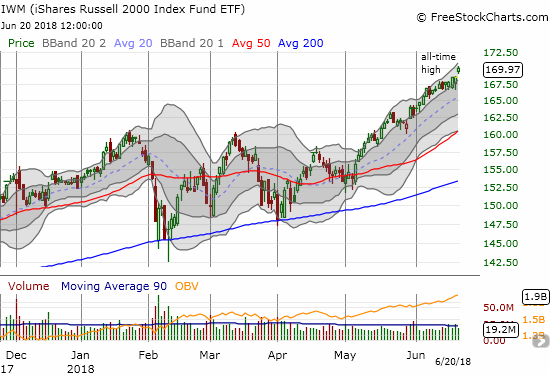
Another segment of the market could not care less about macro-economic calamities and is collectively racing higher in what looks like an effective “safety” trade. Today, it was clear tech stocks and smaller U.S. domestic stocks are the anointed safety plays. The NASDAQ and the iShares Russell 2000 ETF (IWM) summarized this statement quite nicely by gapping up today to new all-time highs.
The S&P 500 (SPY) is caught in the middle. The index that I use to form my short-term trading gapped up to end a streak of three straight losing days. Each of those days, buyers took the index sharply off its lows. Yet, the S&P 500 is caught in an important struggle with its March peak. Until it can push past this line of resistance, I will keep my short-term trading call at bearish. Accordingly, I have accumulated SPY put options expiring next Friday.
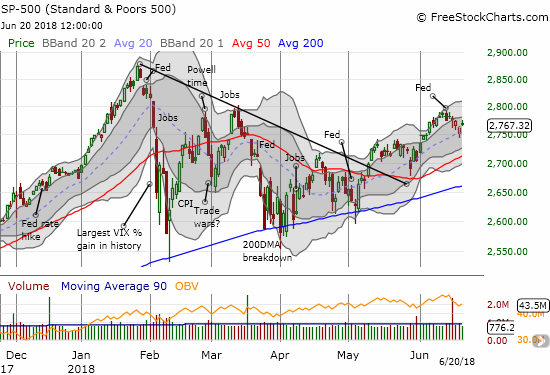
AT40 (T2108), the percentage of stocks trading above their respective 40-day moving averages (DMAs), continues to confirm my bearish stance by trading below the 70% overbought threshold after having fallen from overbought conditions last week. Today AT40 closed at 65.8%. I find it quite telling that tech and small caps have been unable to lift my favorite technical indicator back into a bullish position above 70%.
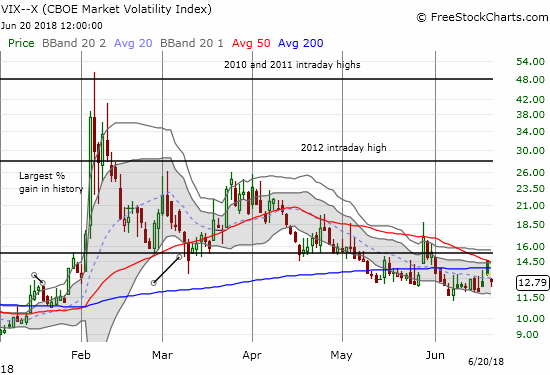
Finally, there is the volatility index, the VIX. The VIX soared on Tuesday as much as 19.3%. I resisted the urge to close out my call options on ProShares Ultra VIX Short-Term Futures (UVXY) for a minimal loss: I am holding them for their hedge value. As long as I am in short-term bearish mode, I will keep rolling into fresh tranches. Just as I suspected, the VIX faders went right to work. Today, those faders closed what little remained of Tuesday’s gap up.
This mix of bearish and bullish trading action makes the market overall look manic and fickle. Underneath it all is a method to the madness. So if you are bearish, like me right now, you focus on the trade-impacted parts of the market. If you are bullish, a significant swath of the market is giving you permission to completely ignore the chaos closing in on financial markets. I choose my words purposely. The sentimental logic of a divergent market includes an impenetrable wall where bears and bulls safely play separate from each other. I believe that at some point, the Trump administration’s focused determination to drive the U.S. trade balance toward zero will cause enough economic disruption to cascade out into the broader economy. I am hoping to be properly positioned whenever the market fully processes that reality.
Mad Money’s Jim Cramer, the master at creating market narratives, provides a great case study on the divided mood of the market and on the mental challenges of sorting through the true market risks of a trade war with China. From Friday to Tuesday, Jim Cramer flipped from caution, to derision, and back to caution when trying to help his audience sort through the trade-impacted market. Cramer has one mind to warn his audience of the risks. His skepticism over the eventual impact of a trade war encourages him to tell the audience to press on buying dips in trade-impacted plays and catching the uptrends elsewhere in the market.
On Friday, June 15th, Cramer recommended that his audience “curb its enthusiasm” over the stock market because of the sentiment-killing impact of the trade war. He went so far as to call the whole episode a “debacle” that means being slower to pounce on dips and curbing enthusiasm over rallies.
And, perhaps just as feared, the stock market opened the week with a small gap down on the heels of more bad trade headlines. Even though the much of the trading action seemed to validate Cramer’s apparent caution on Friday, Cramer chose to scoff at the entire notion that the U.S. and China are even engaged in a trade war. For emphasis, he even sarcastically came up with an idea for a new ETF: GLUM. He started off his show by declaring “Don’t be gloomy! You see, every day the sense of gloom seems to become more palpable.” I would not blame you for experiencing some mental disconnect from this observation on a day when the markets closed on the heels of a comeback with the S&P 500 only losing 0.2% and the NASDAQ closing flat. This is the stuff of divergence.
Here are some other choice quotes I pulled from the show (emphasis mine):
“I don’t want to dismiss the worries about tariffs or rising rates; that would be foolish. But at some point we have to remember we have a blazing hot economy here. And yet the negativity is so encompassing…I would create a GLOOM index…
It’s out of control people…People are afraid that Trump has WRECKED the world economy…
So here’s the bottom-line: GLUM’s the word. It is all pervasive as investors freak out about President Trump’s tough trade policies. That’s why we gotta have this ETF…Trump got you down? You know what I’m saying? GLUM!
As for me though, I think these stocks are buys into weakness…the negativity has gotten completely out of hand….I think these stocks are buys on any weakness…
So stick with GLUM if you think Trump is WRECKING world trade.”
Recall that it was just one trading day ago when investors were instructed to be SLOW to buy the dips.
Cramer even challenged his viewers to find a SINGLE business that was impacted. At the end of the show: “Yes, I thought things are too gloomy. I am surprised to see the gloom lifted around 3 o’clock. But do not forget that the gloomsters will be back tomorrow with endless articles about how the economy is being wrecked by the Trump tariffs. Find me a CEO who agrees! OK? Find me one.”
Given CEOs are eternal optimists, we would of course be hard-pressed to find a leader of a company gloomy enough to wail about an economic calamity at this juncture. However, we CAN find plenty of CEOs complaining about the impact of the trade war on their businesses. Marketplace has done an excellent job of featuring real-life losers and winners from the trade war.
Shortly after that show aired, President Trump officially escalated the trade war by threatening tariffs on an additional $200B of Chinese imports. China quickly retaliated this time. Global financial markets took dives with the currency markets once again confirming the negative impact of the trade warring.
U.S. indices opened lower in sympathy with global angst. Yet, buyers once again lifted the major indices off their lows of the day. This time, the NASDAQ was not able to avoid a losing day. Cramer opened his show with a classic line that his audience should keep bookmarked, especially since Cramer tells us he kept this conclusion ready on the shelf:
“Do not say I didn’t warn you. I’ve been telling you for months that President Trump wants this trade war with China. And the stock market will not like it. It will be the principal risk to 2018’s returns.”
So is it OK to be cautious and curb our enthusiasm now? Or should we still be buying every trade-related dip? I think the answer is “it depends…” Cramer went on to lay out the case for the path to victory for the U.S. in its trade war with China including a list of casualties and survivors. (Yes, Cramer’s list of casualties overlapped with the GLUM index he created just the day before). Here are some choice quotes:
“China needs us more than we need them…BUT stocks could go down anyway…Here’s the bottom-line: I think we may find out that China is the paper tiger…It’s possible that this may go on for a long time and get very painful. But I wouldn’t be surprised if China ends up folding much faster than anyone expects. Still you need to take some real pain, particularly in so-called China stocks before you can get a potentially bountiful gain.”
I think this assessment covers a full circle of possibilities!
Cramer even went so far as to dare China to sell its holdings of U.S. Treasury bills as part of its retaliation plan.
Cramer Remix: Go ahead, China—sell your U.S. Treasurys! from CNBC.
These volatile narratives – the roller coasters of sentiment and posturing – are a natural result of the President’s negotiating style. Trump makes extreme demands in order to get as big a concession as possible. Sometimes he walks back those demands and positions himself as the friendly neighbor and good friend. Traders and investors can then cycle from fear to optimism to relief and back to fear. Cramer’s skill at creating narratives is grasping firmly to Trump’s wildly flapping coattails!
I think this case study is good context for my own difficulty in maintaining a clean short-term trading call. It helped me clarify the source of that challenge but also to be reassured in my focus on AT40 and the S&P 500. The trick is to apply the short-term trading call to the part of the market that is driving the sentiment. In this case, Cramer’s GLUM index is a great confirmation of my main two targets: CAT and Boeing (BA). I have added Goldman Sachs (GS) as well. Other stocks in the GLUM index are: 3M (MMM), General Electric (GE), Johnson & Johnson (JNJ) – a strange choice to me, Citigroup (C), Lennar (LEN), Walmart (WMT), and Ford (F).
Staying focused is important because, at the end of the day, Trump is determined to drive the U.S. trade deficit as close to zero as possible. This cannot happen without some substantial economic disruptions. To the extent the market refuses to price in these risks, I think I see opportunities for hedging and in some cases benefiting from potentially substantial downside. My conviction on the seriousness of the Trump administration was confirmed after digging into a report the White House released on Tuesday titled “How China’s Economic AggressionThreatens the Technologies and Intellectual Property of the United States and the World.” It is a well-written report that lays out the case for economic grievances against China and while focusing on two key areas: “1) Acquire Key Technologies and Intellectual Property From Other Countries, Including the United States, 2) Capture the Emerging High-Technology Industries That Will Drive Future Economic Growth and Many Advancements in the Defense Industry.” The U.S. versus China trade war really IS an economic WAR. Wars always produce casualties and collateral damage…
CHART REVIEWS
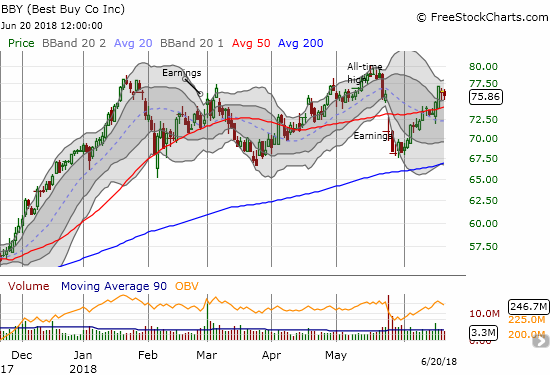
Best Buy (BBY)
I could not resist. With retailers doing so well, I took a swing at call options on BBY after it dipped from last week’s bullish breakout.
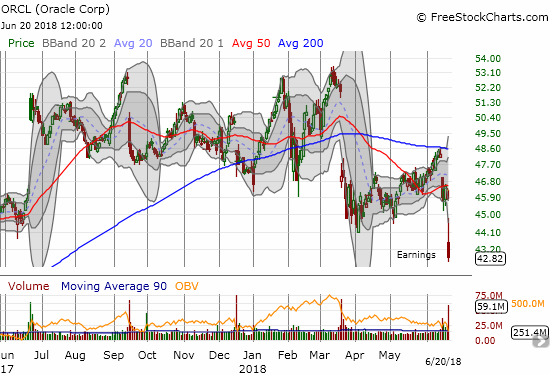
Oracle (ORCL)
ORCL is one of the few big cap tech stocks performing poorly. Its last earnings call buried results from its cloud business in what looks like a concession to competitor Salesforce (CRM). ORCL is now a broken stock with its 7.5% post-earnings loss and a 50DMA breakdown that confirmed 200DMA resistance.
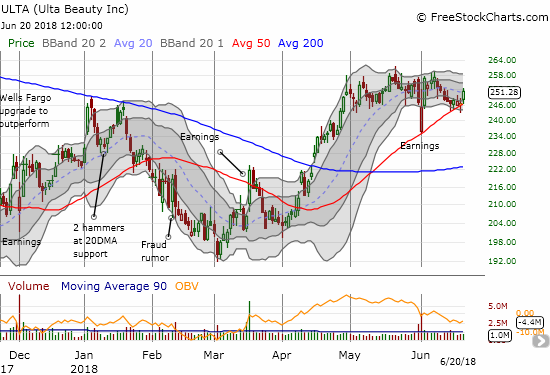
Ulta Beauty (ULTA)
I couldn’t help it again. ULTA bounced nearly perfectly off 50DMA support, and it triggered a bullish trade for me. I started with a calendar call spread in anticipation of churn to end the week before momentum resumes next week.
Other trades: ADDED to Alcoa (AA) after stock bounced back from test of resistance and confirmed a hammer, initiated pairs trade long SLV calls and long GLD puts.
— – —
FOLLOW Dr. Duru’s commentary on financial markets via email, StockTwits, Twitter, and even Instagram!
“Above the 40” uses the percentage of stocks trading above their respective 40-day moving averages (DMAs) to assess the technical health of the stock market and to identify extremes in market sentiment that are likely to reverse. Abbreviated as AT40, Above the 40 is an alternative label for “T2108” which was created by Worden. Learn more about T2108 on my T2108 Resource Page. AT200, or T2107, measures the percentage of stocks trading above their respective 200DMAs.
Active AT40 (T2108) periods: Day #86 over 20%, Day #55 over 30%, Day #50 over 40%, Day #32 over 50%, Day #15 over 60% (overperiod), Day #6 under 70% (underperiod)
Daily AT40 (T2108)
")
Black line: AT40 (T2108) (% measured on the right)
Red line: Overbought threshold (70%); Blue line: Oversold threshold (20%)
Weekly AT40 (T2108)

*All charts created using freestockcharts.com unless otherwise stated
The charts above are my LATEST updates independent of the date of this given AT40 post. For my latest AT40 post click here.
Related links:
The AT40 (T2108) Resource Page
You can follow real-time T2108 commentary on twitter using the #T2108 or #AT40 hashtags. T2108-related trades and other trades are occasionally posted on twitter using the #120trade hashtag.
Be careful out there!
Full disclosure: long UVXY calls, long SPY puts, long BBY calls, long ULTA calendar call spread
*Charting notes: FreeStockCharts.com stock prices are not adjusted for dividends. TradingView.com charts for currencies use Tokyo time as the start of the forex trading day. FreeStockCharts.com currency charts are based on Eastern U.S. time to define the trading day.