

Stock Market Analysis Summary
|
Stock Market Commentary
For the week ending December 5, 2025, I mainly watched how the market would respond after a strong last week of November with rate cut tailwinds. That final week delivered a massive recovery from a near month-long sell-off. After strong gains to end November—S&P 500 +3.7%, NASDAQ +4.9%, and IWM +5.6%—the indices held their momentum with modest follow-through last week with 0.3%, 0.9%, and 0.8% gains respectively. I consider these weekly performances healthy given the big moves to end November. Buyers easily could have taken profits, but instead it seems clear that rate cut tailwinds are keeping bulls in control. The market is expecting a rate cut from the Federal Reserve on December 10th, and if the Fed also delivers a dovish tone, a year-end rally and bullish year-end positioning should be a lock. The market topped out after the Fed’s last rate cut when policymakers signaled hesitation about further easing.
The Stock Market Indices
S&P 500 (SPY)
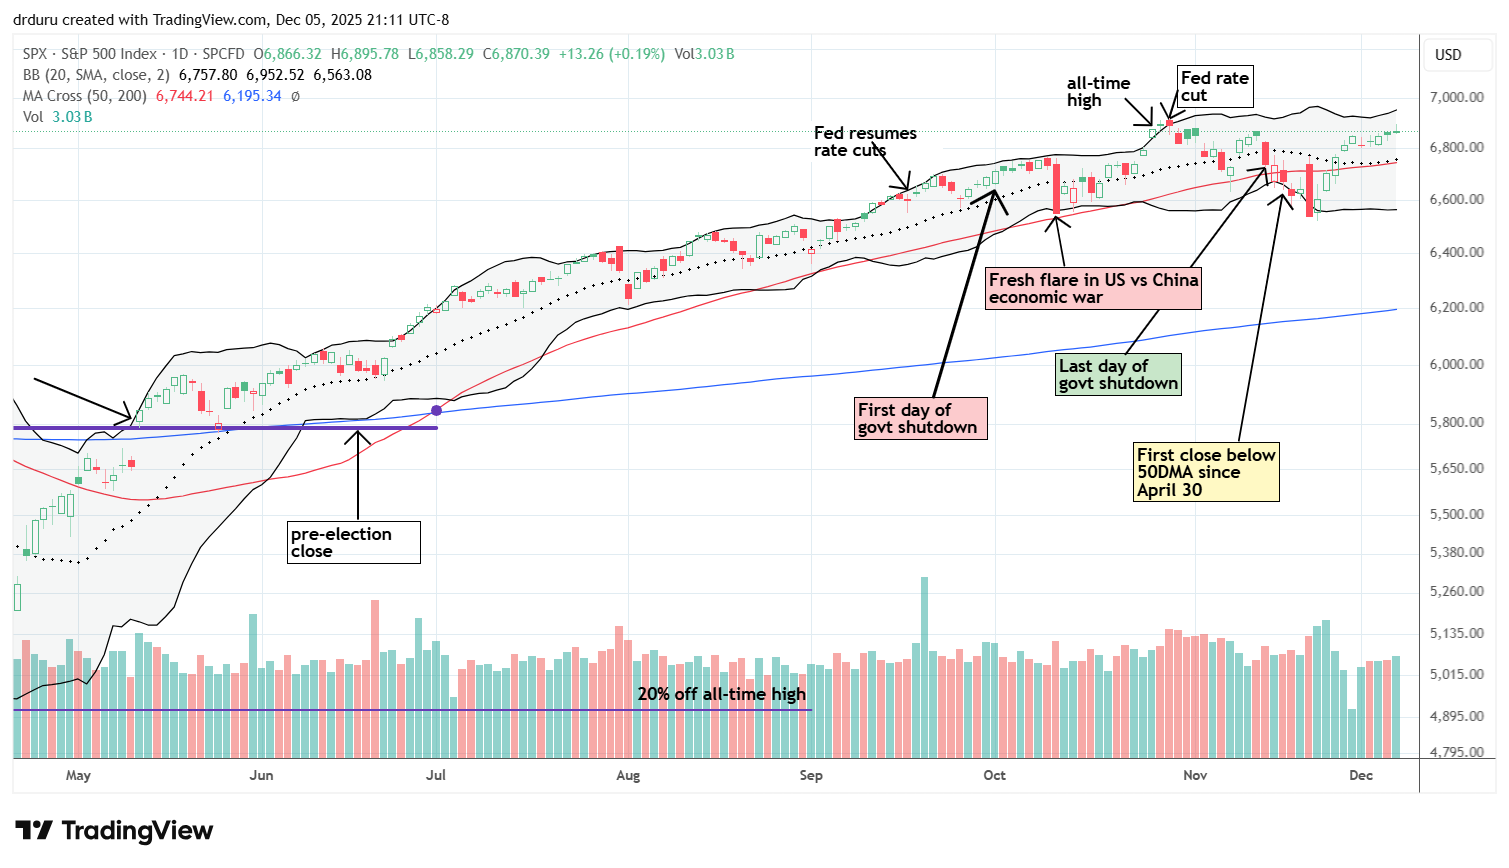
The S&P 500 held on to the previous week’s gains and managed to build on those gains last week. The lack of any giveback confirms that the index is back in bullish form. The rebound approaching the all-time high is just in time for a likely rate cut from the Fed on Wednesday of the coming week. Note the last rate cut preceded a near month-long pullback (albeit shallow). This time should be different with rate cut tailwinds keeping the bulls in control for this unfolding year-end rally.
NASDAQ (COMPQX)
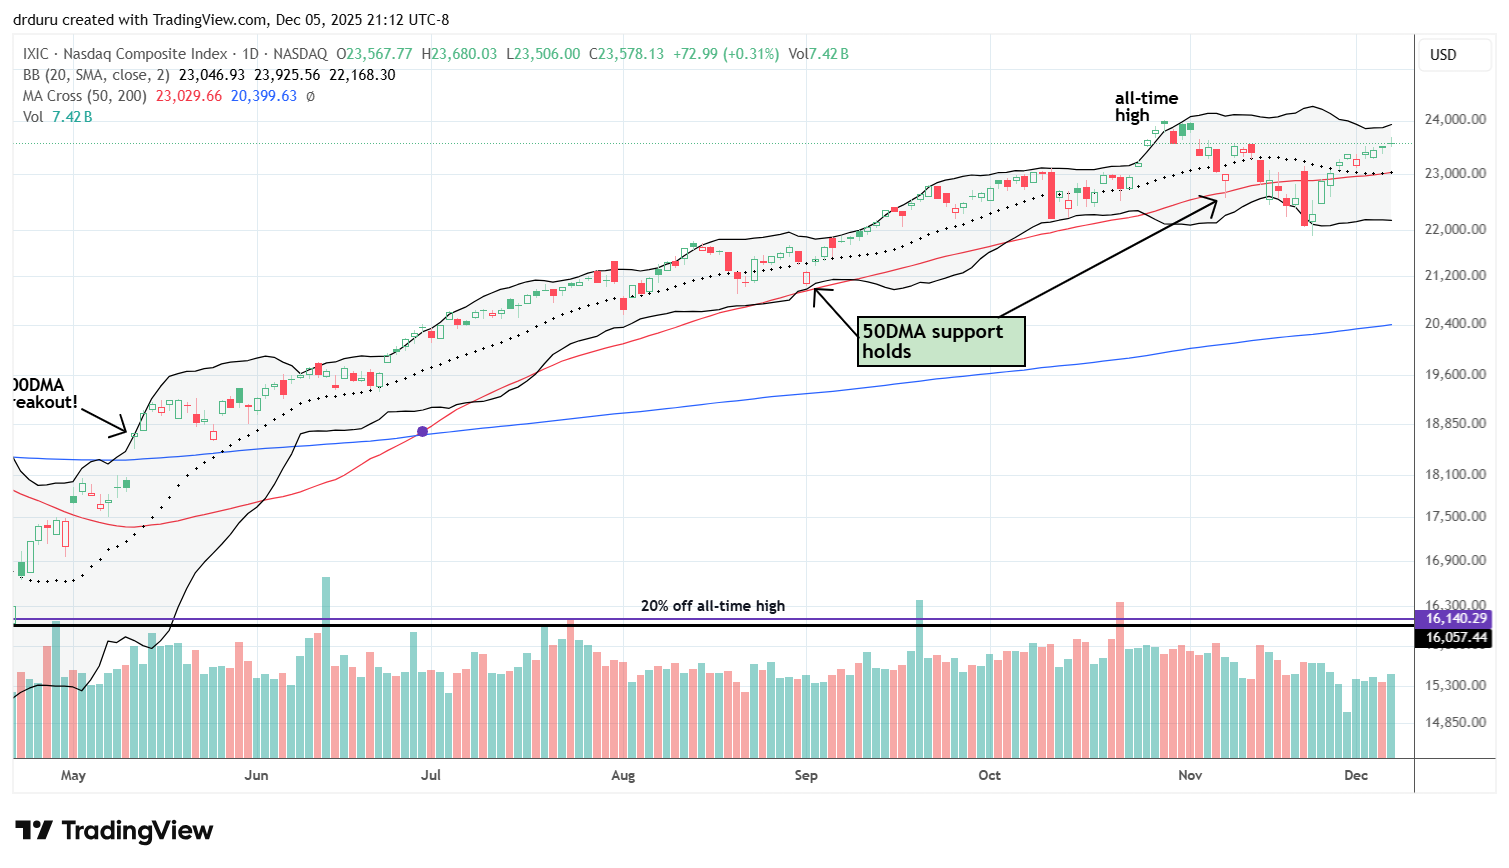
The NASDAQ did not come as close to its all-time high as the S&P 500, but it held its strong gains from the previous week and continues to trade in bullish position.
iShares Russell 2000 ETF (IWM)
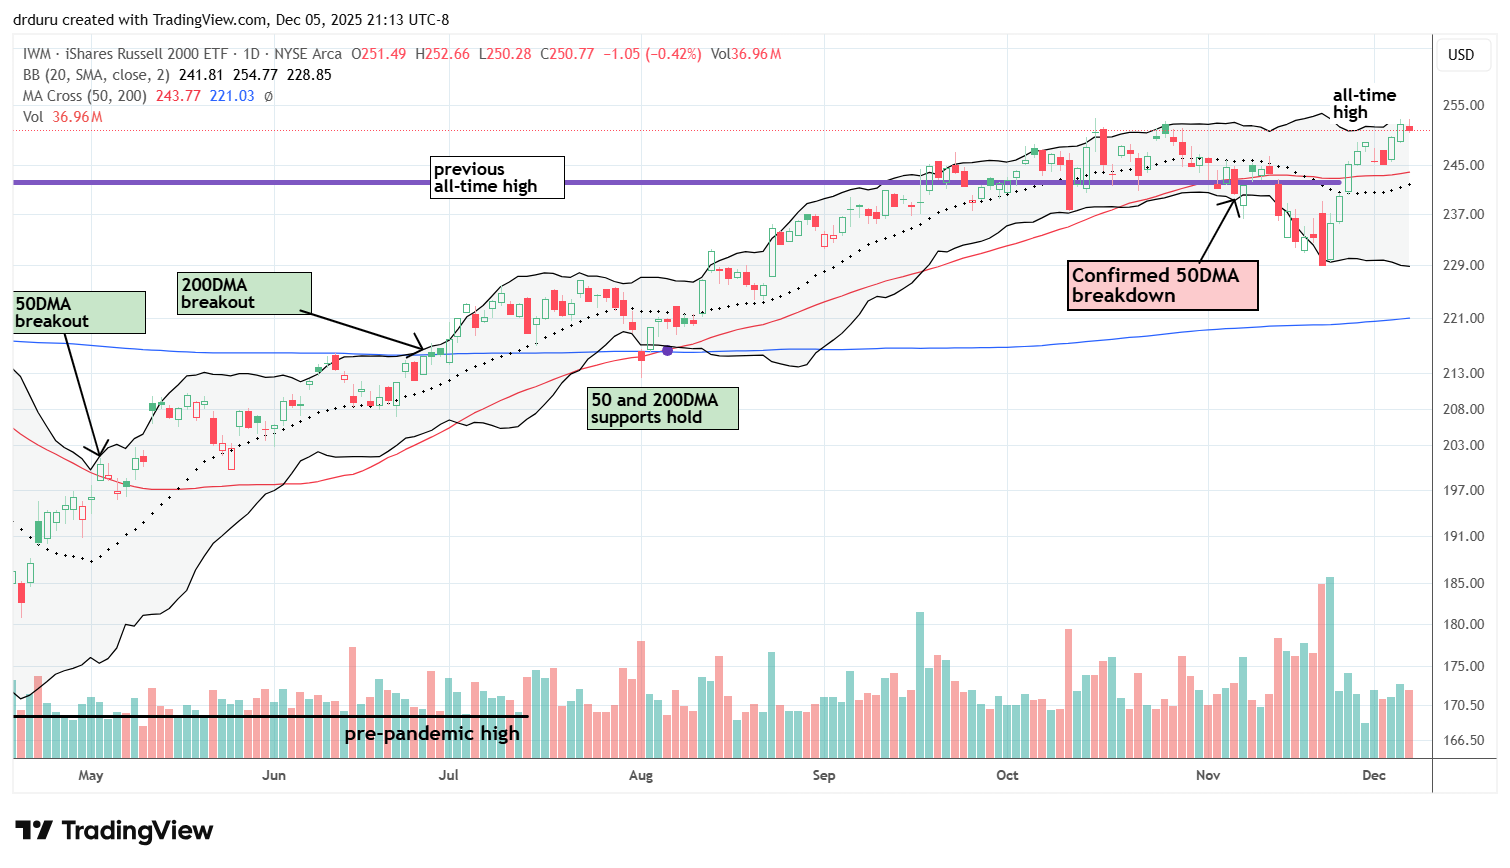
IWM made a new all-time high on Thursday with an all-time closing high, followed by only a small pullback. I am not concerned about the pullback except to note that small caps were a driver of market breadth failing to break through its downtrend. Even so, IWM looks great and continues to outperform on a relative basis with the rate cut tailwinds boosting the ETF of small caps. I love this performance because IWM has been my core position during this extended recovery. However, my last call option trade on IWM was far too conservative as a calendar call position.
The Short-Term Trading Call with Rate Cute Tailwinds
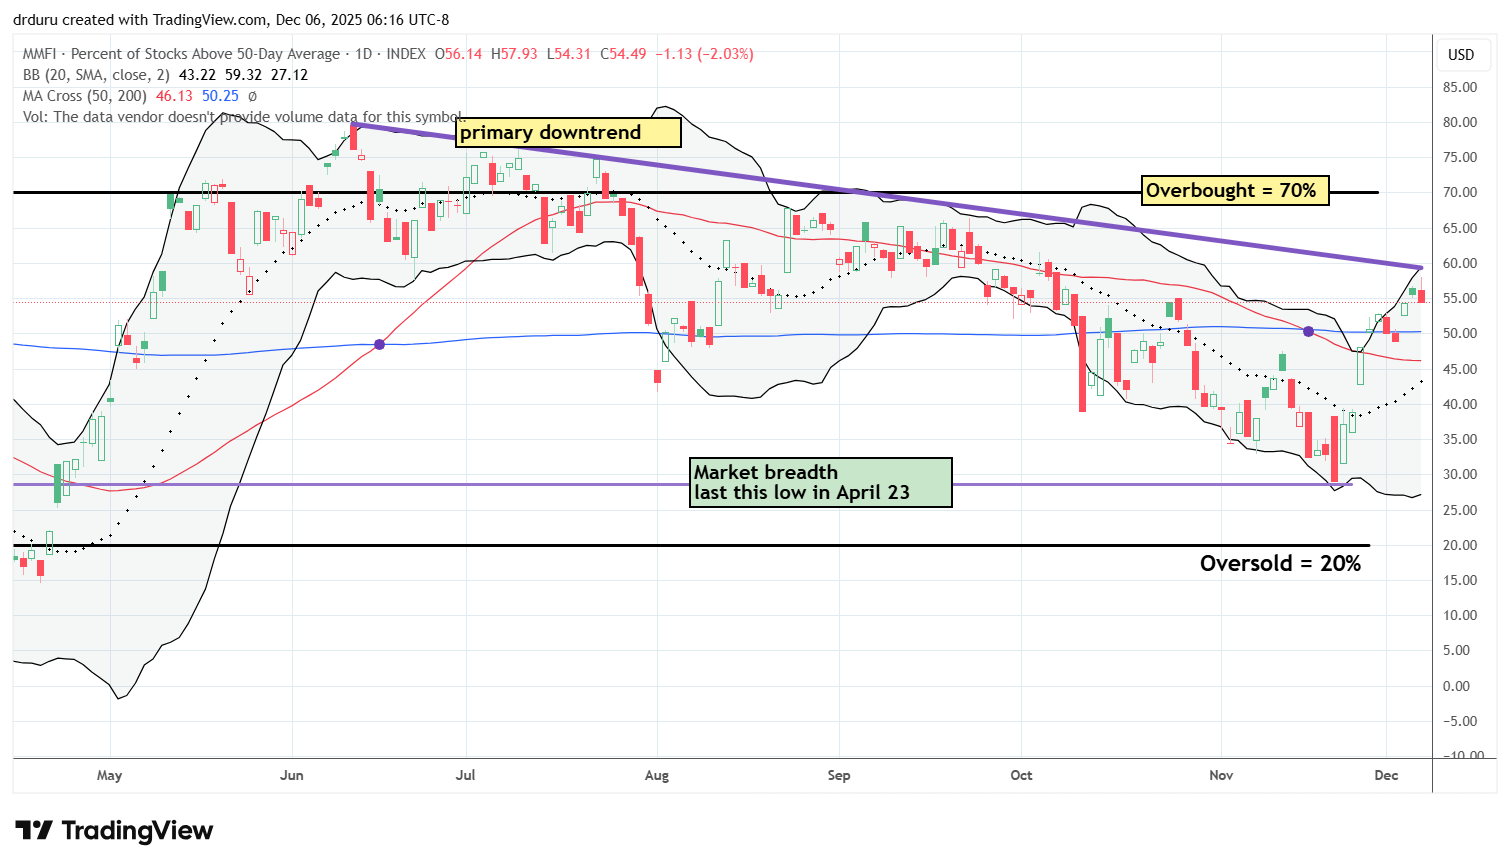
- AT50 (MMFI) = 54.5% of stocks are trading above their respective 50-day moving averages
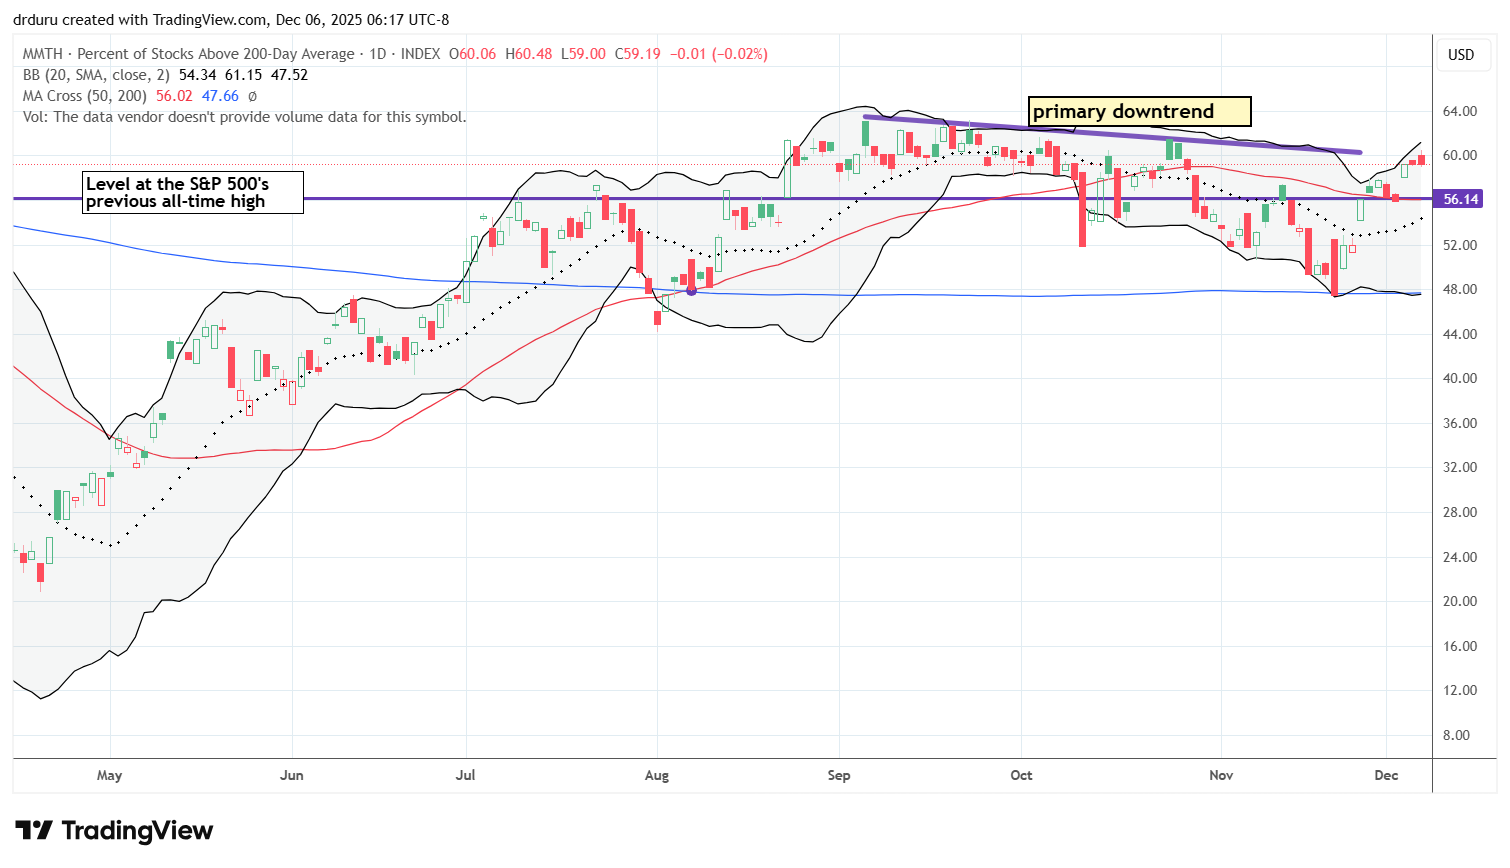
- AT200 (MMTH) = 59.2% of stocks are trading above their respective 200-day moving averages
- Short-term Trading Call: neutral
AT50 (MMFI), the percentage of stocks trading above their respective 50DMAs, closed the week at 54.5%. I have been watching the persistent downtrend for months. I thought the rate cut tailwinds would finally end the overall downtrend and send my favorite technical indicator barreling into overbought conditions, but such a milestone will have to wait at least another week or so. AT50 approached but failed to break its downtrend line before pulling back (chart at the end of this post).
AT200 (MMTH), the percentage of stocks trading above their respective 200DMAs, closed the week at 59.2% and, like AT50, stalled at resistance from its primary downtrend.
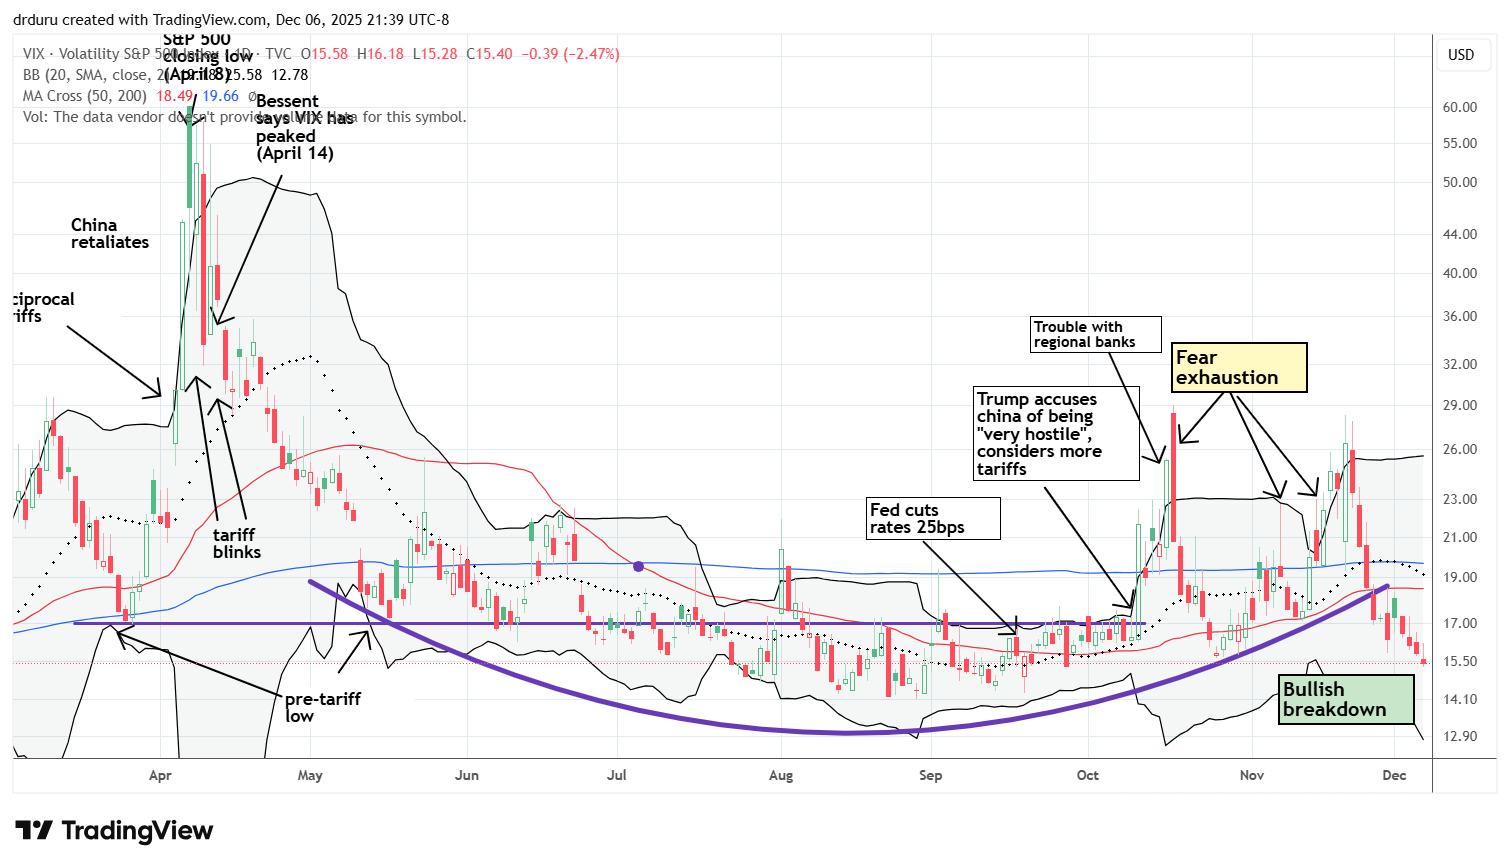
The sharp turn-around in sentiment (largely thanks to rate cut tailwinds) represents a sharp contrast to the November plunge. AT50 seemed headed toward oversold conditions until renewed expectations for a December rate cut sparked a sharp rebound.
The Equities: Rate Cut Tailwinds
Netflix (NFLX)
Description:
Netflix (NFLX) provides online streaming video content and related entertainment services.
Technical status:
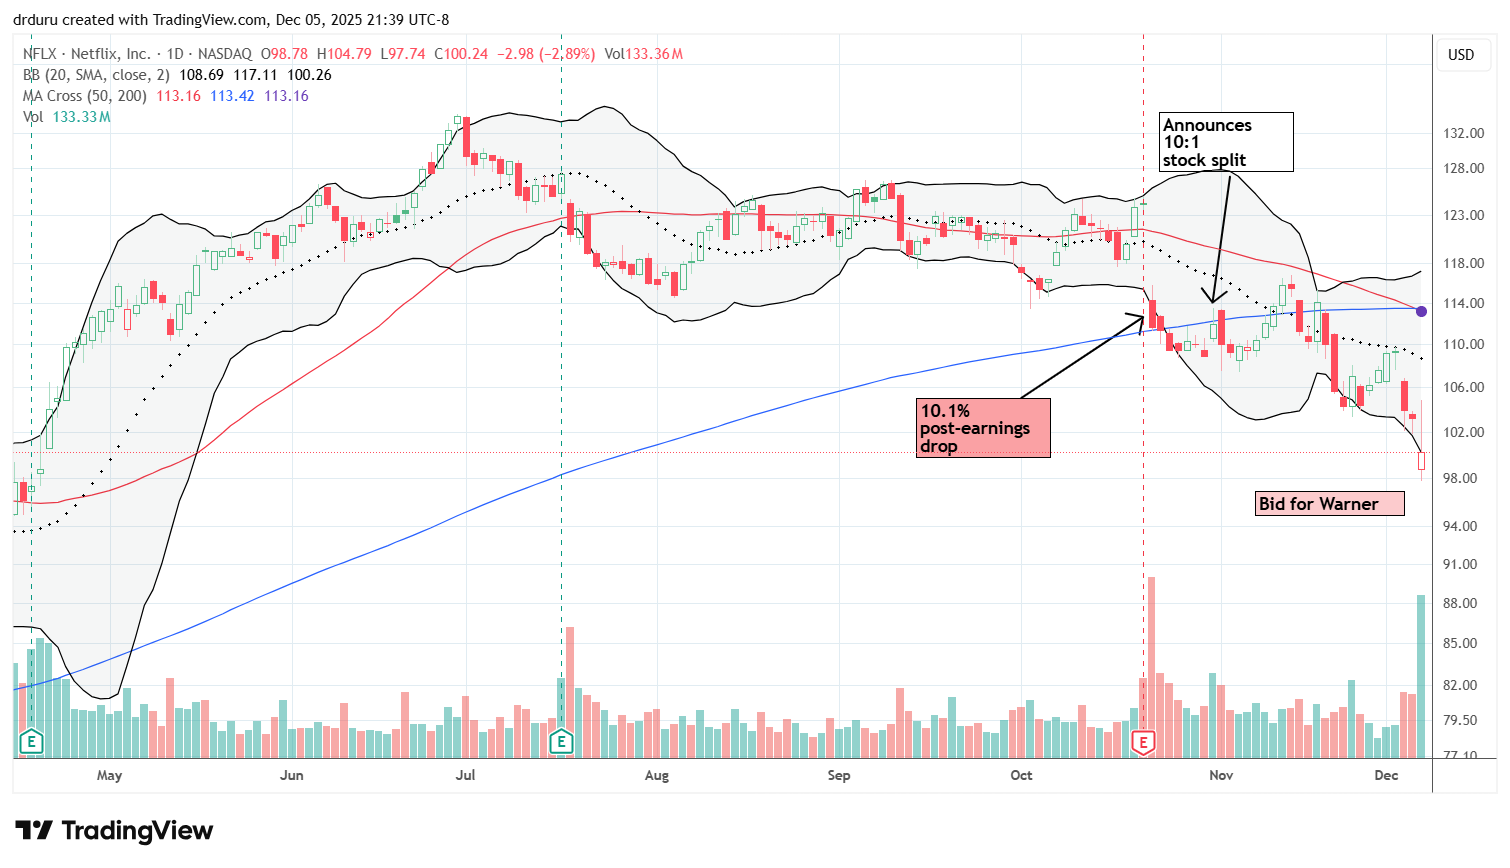
Netflix (NFLX) confirmed a fresh bearish breakdown as sellers rejected intraday strength in the wake of a confirmed bid for Warner.
Trade commentary:
Netflix confirmed a breakdown, and I consider the stock in bearish position primarily because the bid for Warner weighed heavily on sentiment. That bid was around $27 a share and reportedly all cash. Investors were clearly not happy. Netflix ended up closing down almost 3% on the news. The stock gapped down at the open, buyers briefly stepped in and pushed the stock into a gain, and then sellers immediately used that strength to sell again. Netflix did not break below the intraday low, so a trader could assume a bottom for NFLX and stop out if the stock continues lower. However, I do not want to trade Netflix here. I really wanted to stay short after earnings, but now I prefer to wait and see whether this attempted bottom holds or fails.
Spotify Technology (SPOT)
Description:
Spotify Technology (SPOT) provides streaming audio services including music and podcasts.
Technical status:
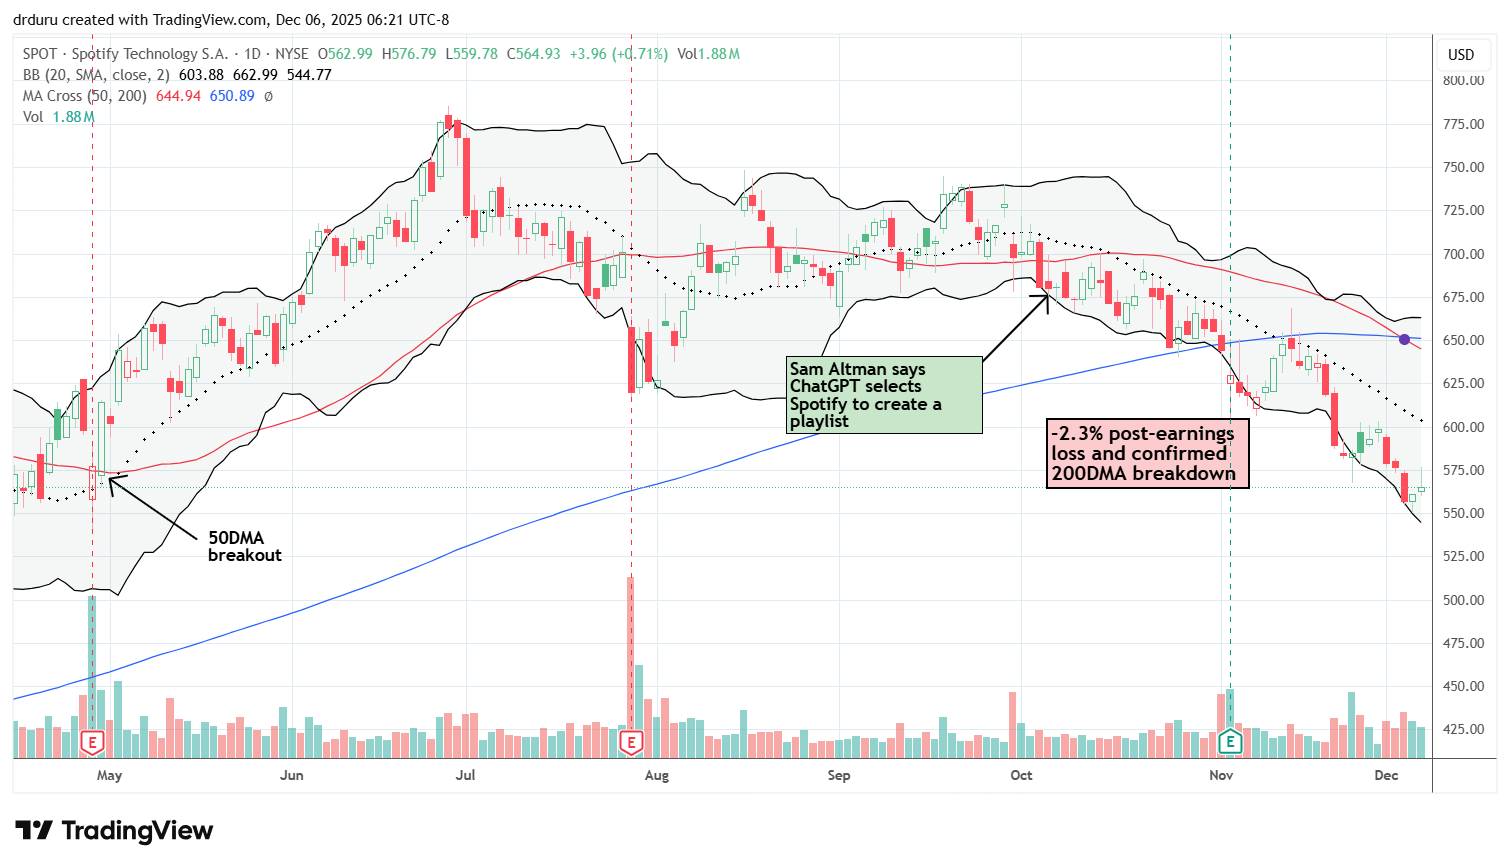
Spotify Technology (SPOT) continued its downtrend after failing at converging resistance from its 20DMA and 200DMA, reinforcing its bearish technical posture.
Trade commentary:
As Spotify continues to break down, I feel relief that I respected the technical signals and took a small loss on my position almost a month ago. I entered SPOT earlier in the year planning a long-term hold, but I did not like its breakdown below its 200DMA (the blue line). I tolerated the break of the 50DMA (the red line), but the 200DMA failure confirmed bearishness. The 20DMA next acted as stiff downtrending resistance, and SPOT failed right at the convergence with the 200DMA.
Sellers have taken SPOT down steadily. I do not know of a specific catalyst for the sudden loss of favor. The stock is expensive, so it can fall without much reason if investors want a more reasonable valuation. If SPOT tests its April lows again, I might take a risk and try a long-term buy one more time.
Microsoft (MSFT)
Description:
Microsoft (MSFT) develops software, cloud services, personal computing devices, and enterprise technologies.
Technical status:
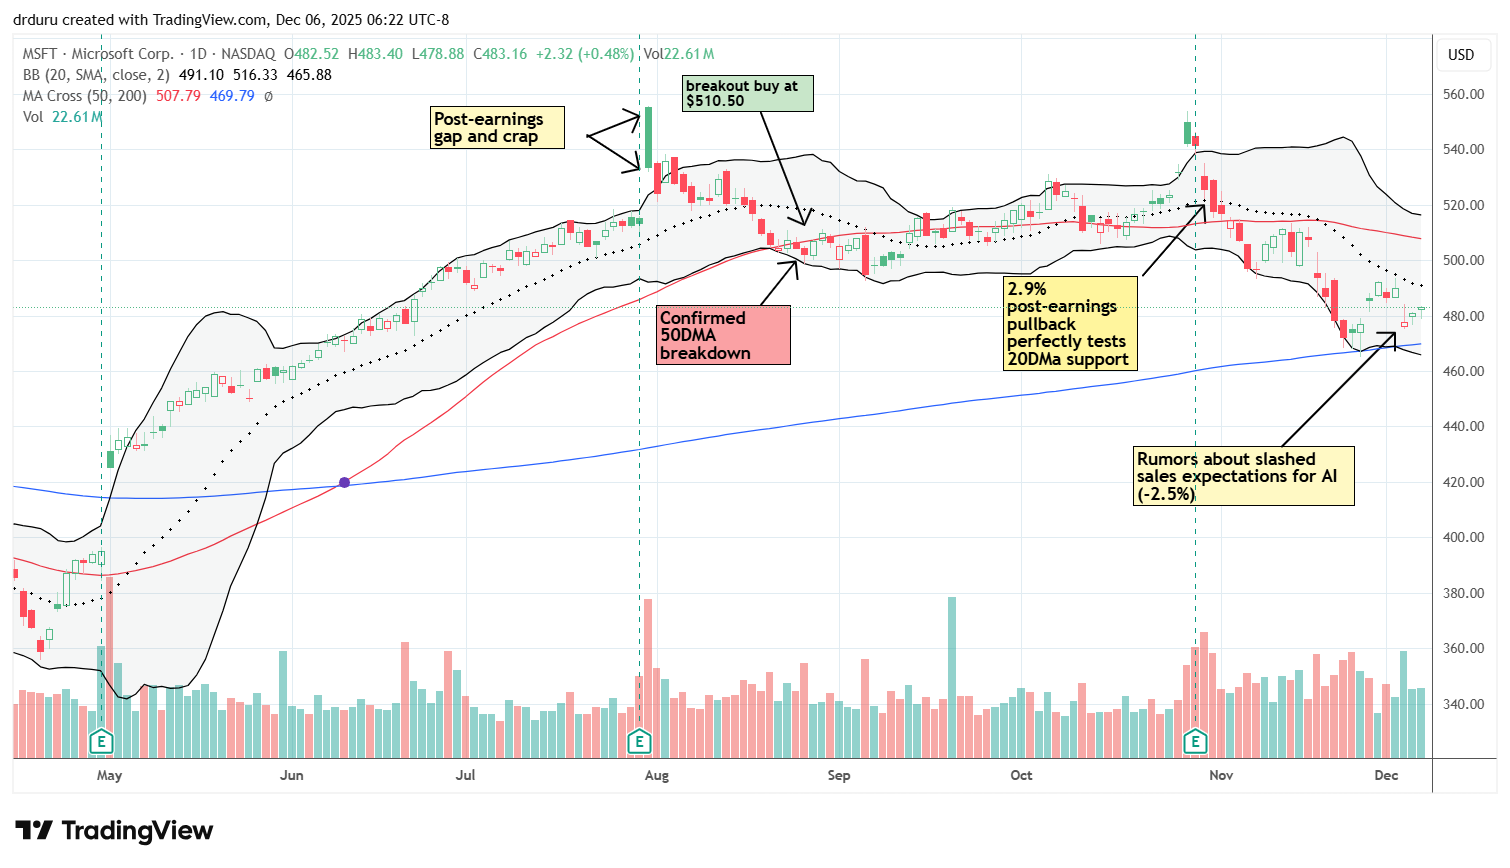
Microsoft (MSFT) avoided a retest of 200DMA support after AI-related rumors gapped the stock down. Downtrending 20DMA resistance remains in place.
Trade commentary:
Rumors spread that Microsoft slashed AI sales expectations, and the stock fell 2.5% on Wednesday. Buyers treated that decline as a buying opportunity and pushed the stock higher after the company denied the rumors.
At the end of November, I added to my position as MSFT held 200DMA support. If MSFT breaks below that low, like Spotify, I will have top stop out at a loss. I cannot continue to hold the stock after a 200DMA breakdown in an otherwise bullish market. Moreover, such a breakdown would confirm a double top in MSFT with the post-earnings peak in July and the pre-earnings peak in October.
Meta Platforms (META)
Description:
Meta Platforms (META) operates social networking applications, virtual reality products, and digital advertising services.
Technical status:
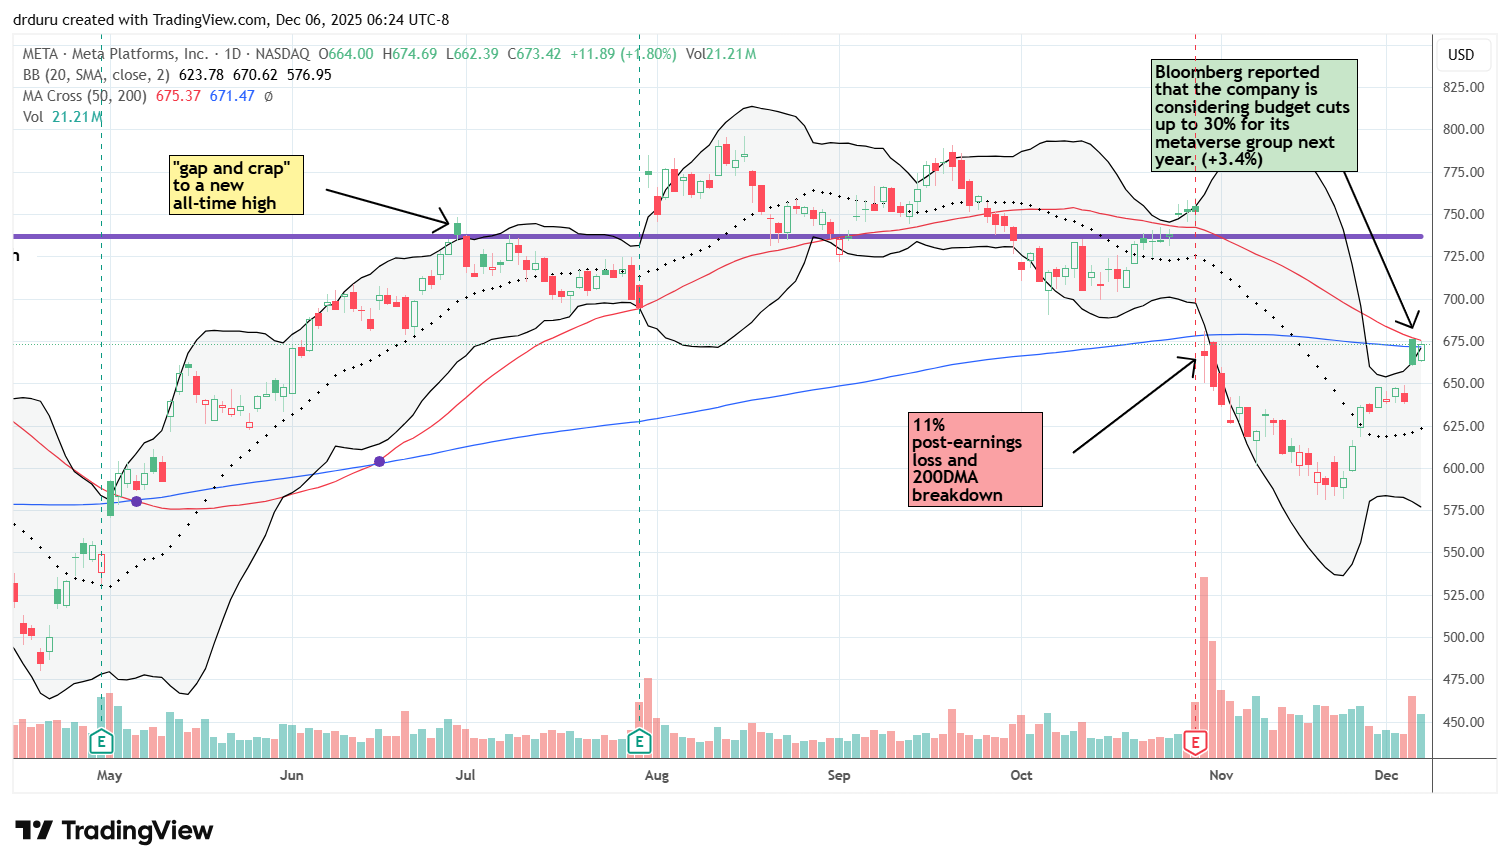
Meta Platforms (META) stalled at converging resistance from its 50DMA and 200DMA after gapping higher on reports of deep cuts in metaverse spending.
Trade commentary:
META had reverse news compared to Microsoft. The stock had been bearish since its 11% post-earnings loss in October. The first warning appeared in June with a gap and crap to a new all-time high. Meta then crept upward ahead of news that the company was considering budget cuts of up to 30% for its Metaverse group. Investors celebrated with a gap up and 3.4% gain. However, META hit converging resistance at its 50DMA and 200DMA. If META breaks above that resistance, the stock returns to bullishness. If Meta closes below recent candles, I will assume bearish positioning has resumed and trade accordingly.
Credo Technology Group (CRDO)
Description:
Credo Technology Group (CRDO) designs and sells connectivity and serializer-deserializer solutions for data infrastructure.
Technical status:
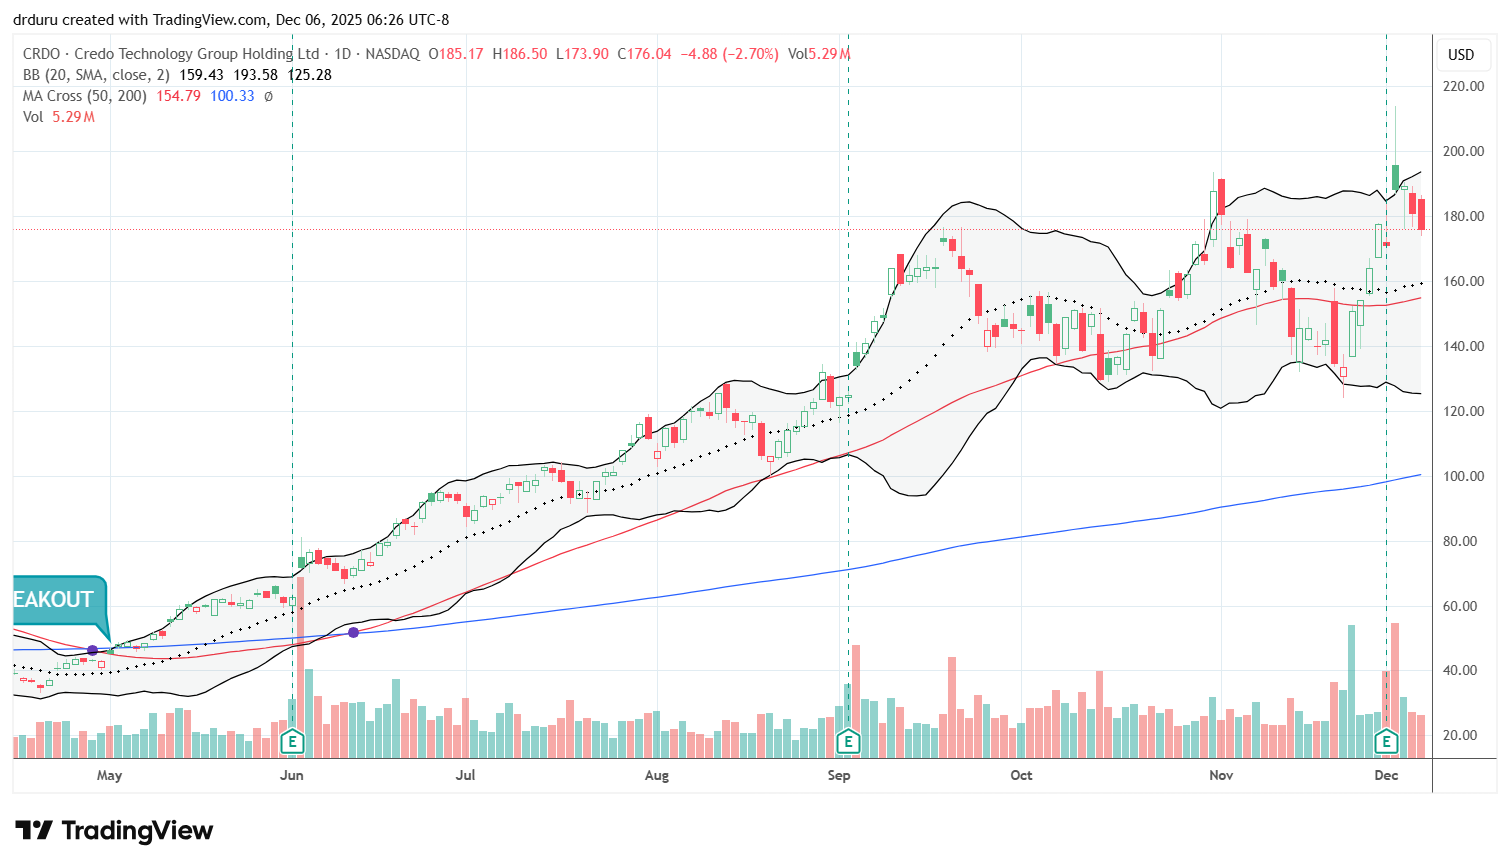
Credo Technology Group (CRDO) pulled back sharply after an earnings-driven surge and approached a full gap fill.
Trade commentary:
CRDO survived earnings and gained 10.1%, but sellers quickly took over from the all-time intraday high at 21.3. The stock has been fading since and has almost filled that gap, making CRDO look toppy. If CRDO rebounds from here, I want to buy. If the stock continues downward, I will assume CRDO has topped and will watch for a 50DMA breakdown, then a break of the recent low, and potentially a test of the 200DMA.
Snowflake (SNOW)
Description:
Snowflake (SNOW) provides cloud-based data warehousing and analytics services.
Technical status:
Snowflake (SNOW) turned bearish after an 11.4% post-earnings decline and 50DMA breakdown followed by additional selling.
Trade commentary:
SNOW is an expensive stock that can fall for almost any reason. Last week SNOW fell 11.4% post-earnings after the company disappointed investors. Follow-through selling of 2.6% confirmed the bearish turn. I do not want to short SNOW because expensive stocks can also soar at any random time. The stock remains a highly favored tech stock despite remaining far below its all-time highs from the double top in 2021–2022. I could get interested in buying SNOW for a trade after a successful test of 200DMA support.

MongoDB (MDB)
Description:
MongoDB (MDB) provides cloud database software and related developer tools.
Technical status:
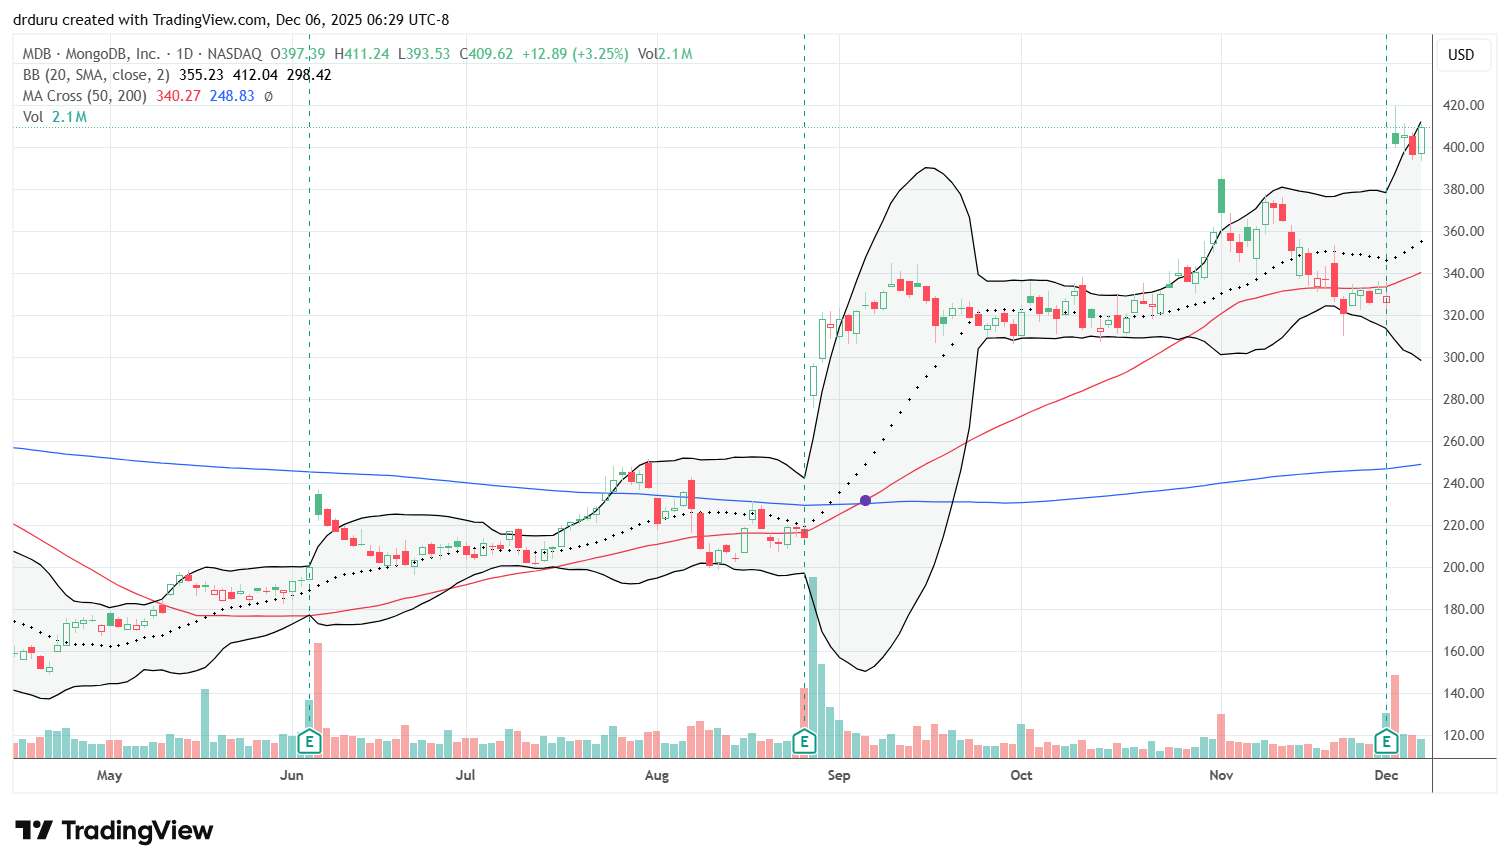
MongoDB (MDB) held its 22.2% post-earnings gains and resisted sellers as the stock hovers near 2-year highs.
Trade commentary:
MDB had the reverse experience of SNOW with a 22.2% post-earnings surge. Perhaps that strength helped set short-term expectations too high for SNOW. MDB is still well off its all-time highs, and the stock has been mostly dead money going back to 2020. However, the stock looks like it is slowly but surely regaining strength. If not for the risk of upcoming earnings, I would have bought the bounce off 50DMA support. I will keep an eye on MDB for a good risk-reward entry.
Pure Storage (PSTG)
Description:
Pure Storage (PSTG) develops data storage hardware and software solutions.
Technical status:
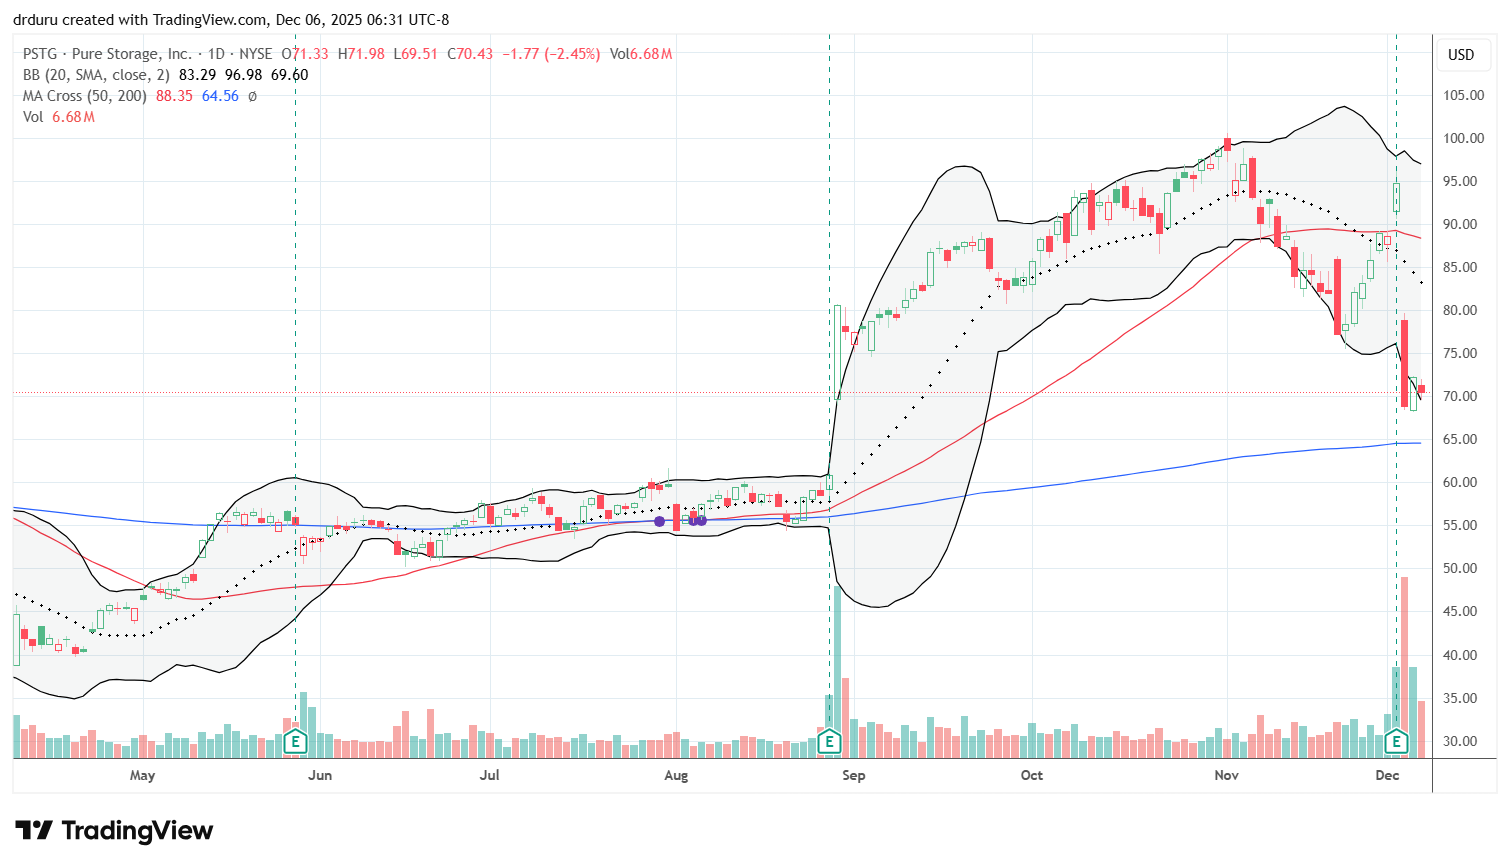
Pure Storage (PSTG) plunged 27.3% post-earnings and approached 200DMA support and is close to filling the gap up from its previous earnings report.
Trade commentary:
PSTG dropped 27.3% while MDB surged, a stark contrast to PSTG’s 32.3% post-earnings gain in August. I suspect a test of 200DMA support is coming. Sellers could also drive PSTG into a fill of the August earnings gap. PSTG remains in a long-term uptrend but very choppy. I will buy PSTG if the stock can hold 200DMA support and particularly if it can hold support after a full gap fill.
Domo (DOMO)
Description:
Domo (DOMO) provides cloud-based data analytics and business intelligence software.
Technical status:
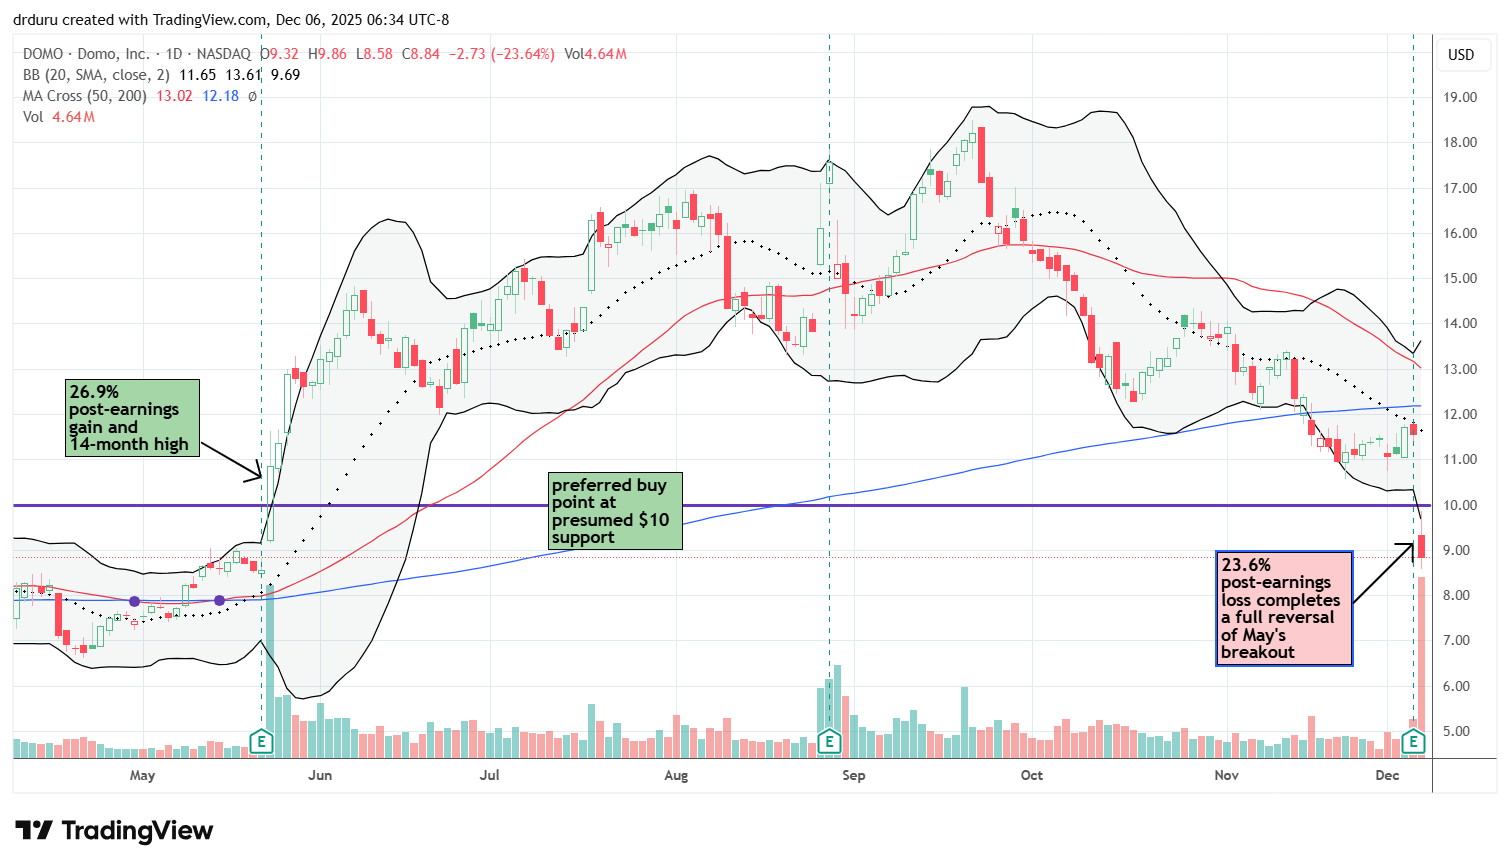
Domo (DOMO) suffered a 23.6% post-earnings loss and completed a full reversal of May’s breakout.
Trade commentary:
DOMO was my biggest disappointment of the week. The stock soared 26.9% after its May earnings report. After worrying that I missed the move, I bought dips, took profits, and gradually reaccumulated shares on the sell-off going into earnings. Given I was pressing my luck, I sold a call option against part of my position. Earnings caused a 23.6% drop that completely reversed DOMO’s breakout, and the short call option only partially alleviated the pain.
The stock is now back in the middle of a long consolidation range and could remain stuck for many months to come. I am holding my position because I like the software and think the company can eventually turn things around. The stock is cheap enough that it could even attract an acquirer someday, but I am not counting on such an exit. In the meantime, I DOMO now trades below my original $10 buy target, so I will wait for the stock to close above that level to add to my position.
SPDR S&P Retail ETF (XRT)
Description:
The SPDR S&P Retail ETF (XRT) tracks an equal-weighted index of U.S. retail companies.
Technical status:
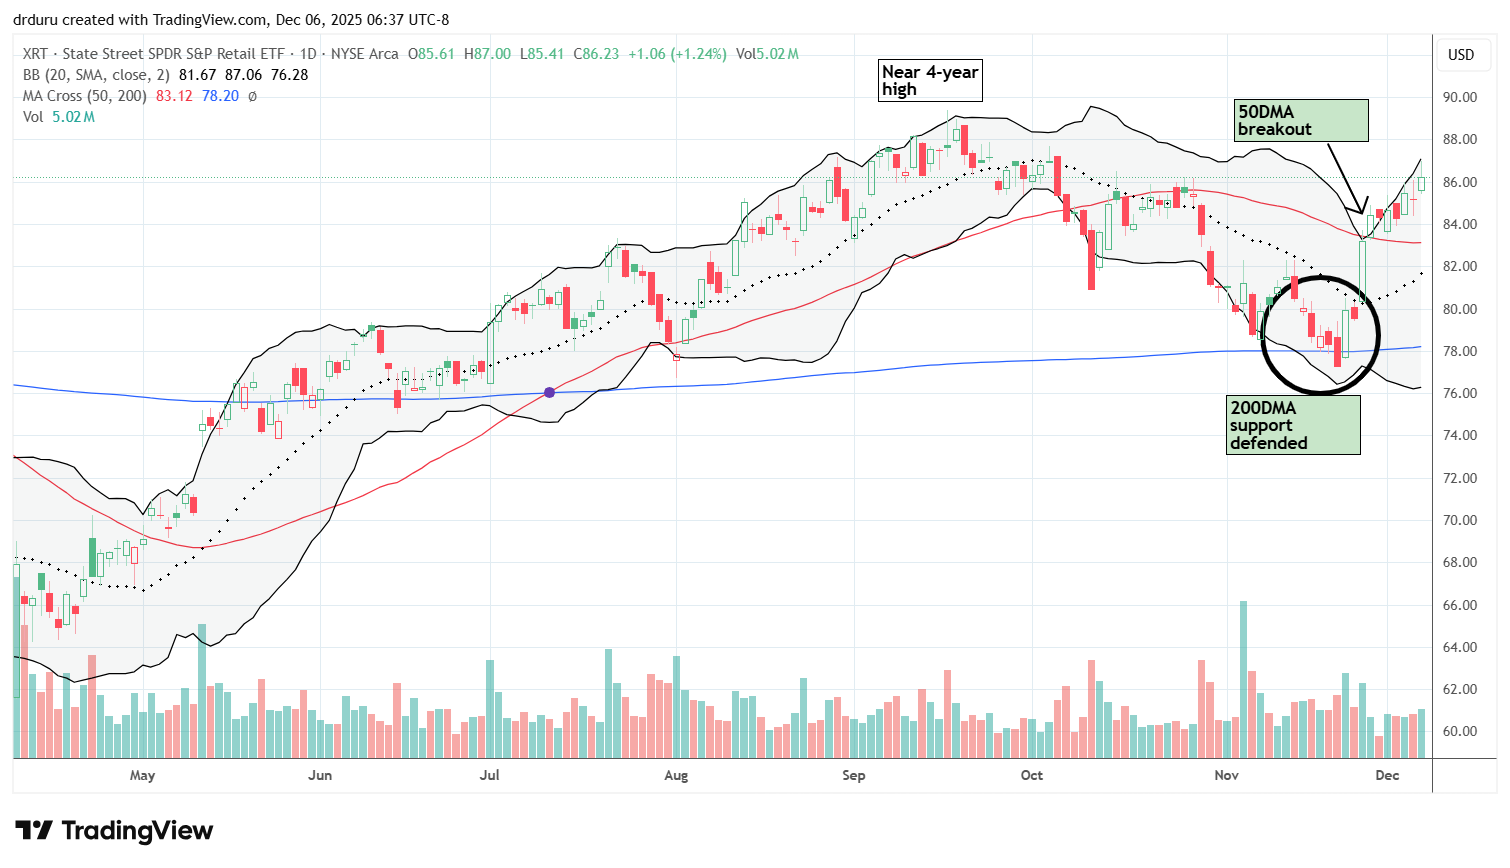
The SPDR S&P Retail ETF (XRT) broke out above its 50DMA and continued higher toward its 4-year high.
Trade commentary:
XRT held 200DMA support in November and then staged a bullish breakout above its 50DMA. Buyers have not looked back since. Even on a day when market breadth weakened, XRT gained 1.2%. Clearly, investors are betting on the consumer despite weak sentiment and worries about the job market and the economy. XRT is now in my buy-the-dips category with a clear runway to retest its near four-year high.
Etsy (ETSY)
Description:
Etsy (ETSY) operates an online marketplace for handmade, vintage, and craft goods.
Technical status:
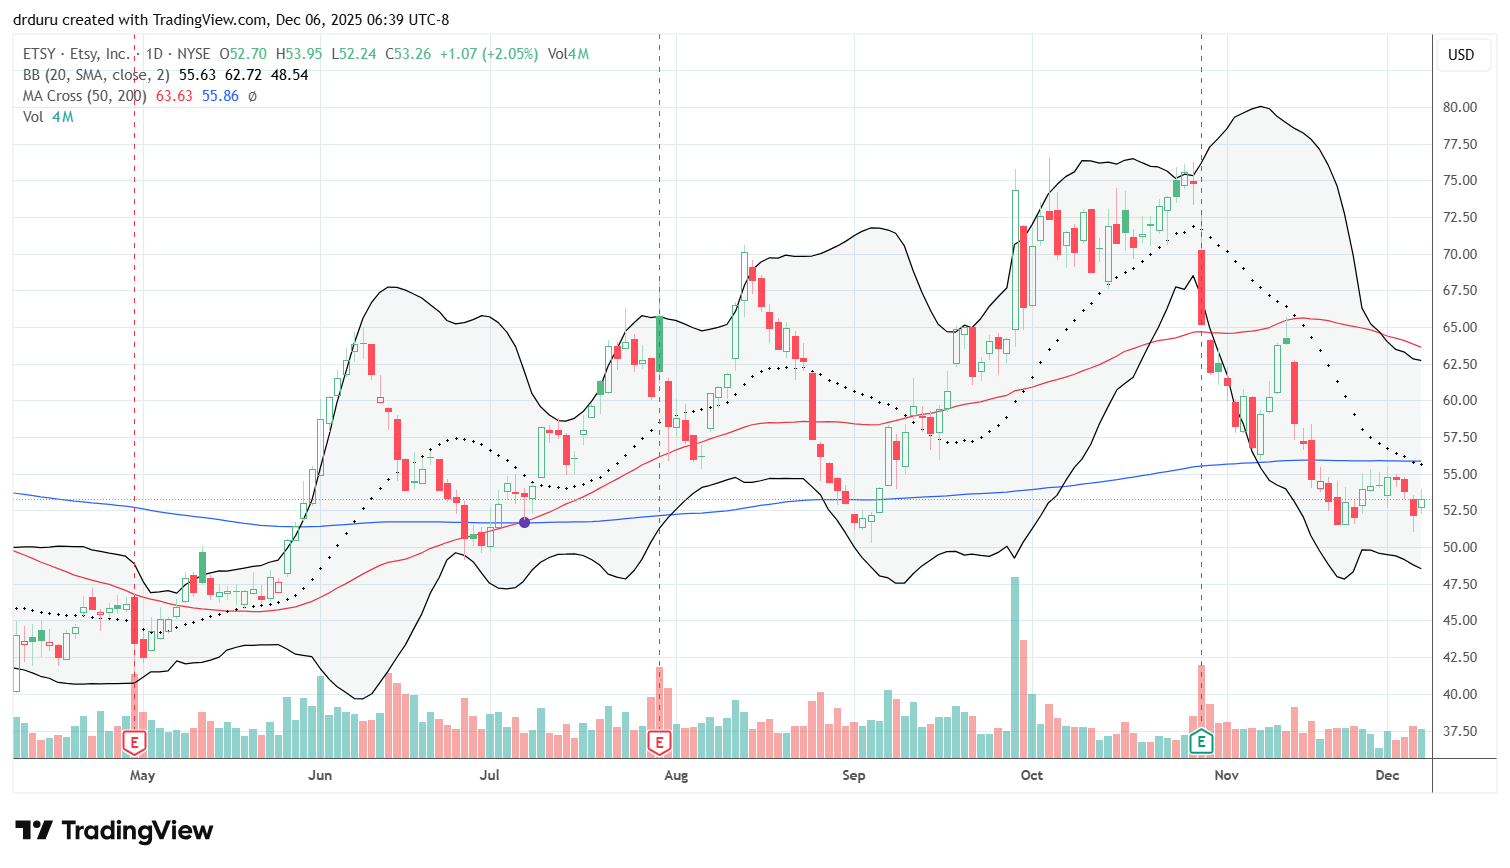
Etsy (ETSY) remains in bearish position after failing at 200DMA resistance.
Trade commentary:
ETSY has produced wild trading action offering both bull and bear opportunities. Right now the stock is in bearish position below its 200DMA. ETSY failed right at that resistance. If ETSY breaks to a new low, the stock becomes extremely bearish. I do not want to short ETSY. Instead, I have been watching for a buying opportunity.
Abercrombie & Fitch (ANF)
Description:
Abercrombie & Fitch (ANF) sells apparel and accessories through retail stores and online channels.
Technical status:
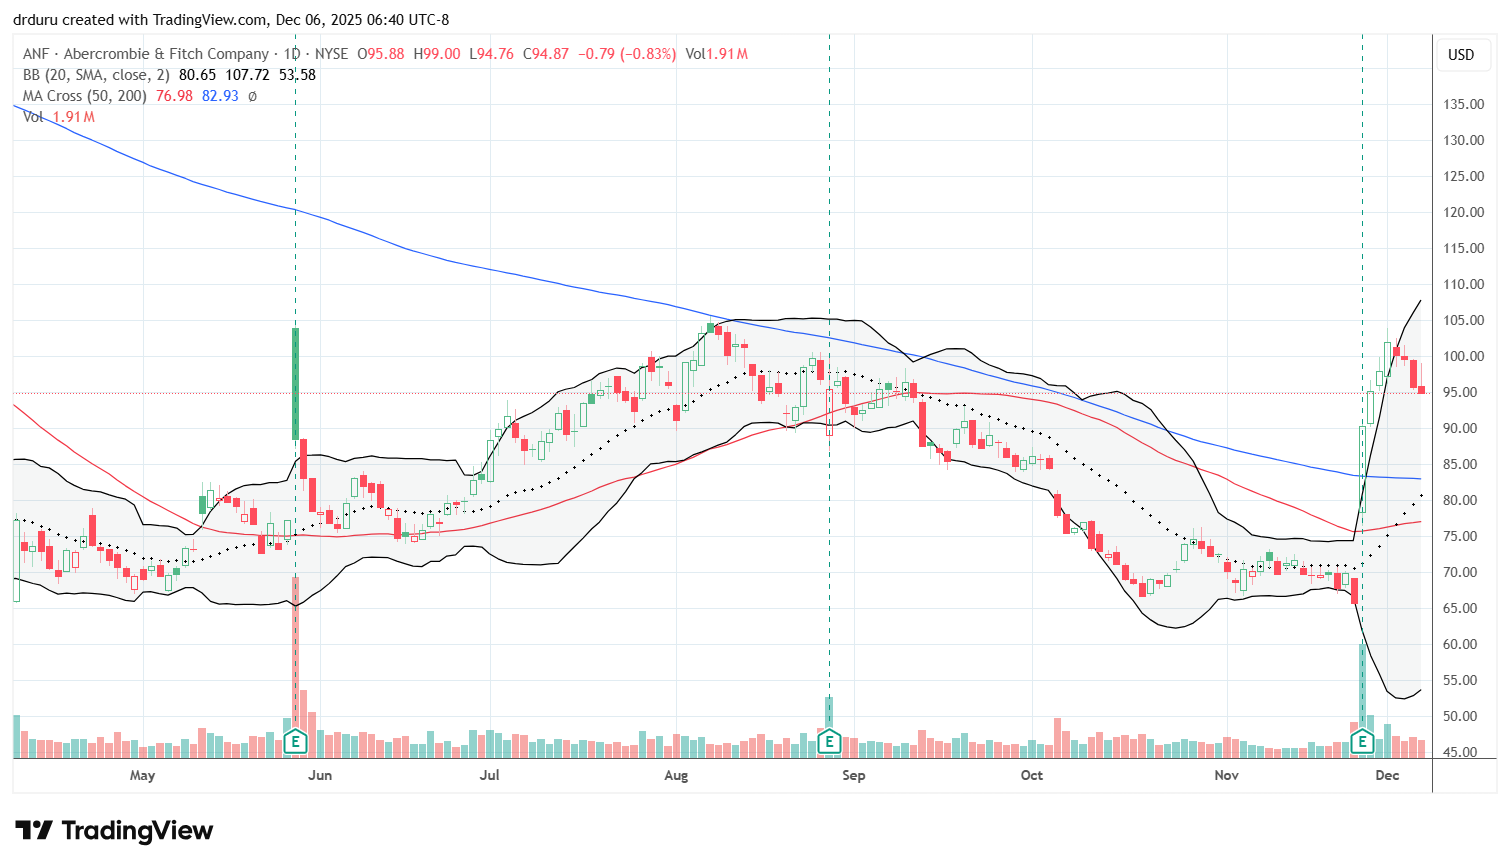
Abercrombie & Fitch (ANF) surged past its upper Bollinger Band (BB) after a 37.5% post-earnings gain before cooling off near prior resistance.
Trade commentary:
I have been watching ANF because I like the commercials I am seeing during football season. Unfortunately, the commercials did not erase the bearish setup. ANF sold off for a month before consolidating ahead of earnings. The stock dropped 6.1% ahead of earnings and then completely reversed with a 37.5% post-earnings surge. Price stayed above its upper Bollinger Band for four straight days. Now price action is cooling off. Ideally ANF tests and holds 200DMA support for a good risk/reward buying opportunity. Note well that ANF stalled at its previous high, but I suspect that after such a strong post-earnings move, buyers will eventually regroup and break through that level.
Dollar Tree (DLTR)
Description:
Dollar Tree (DLTR) operates discount retail stores selling low-priced household and consumer goods.
Technical status:
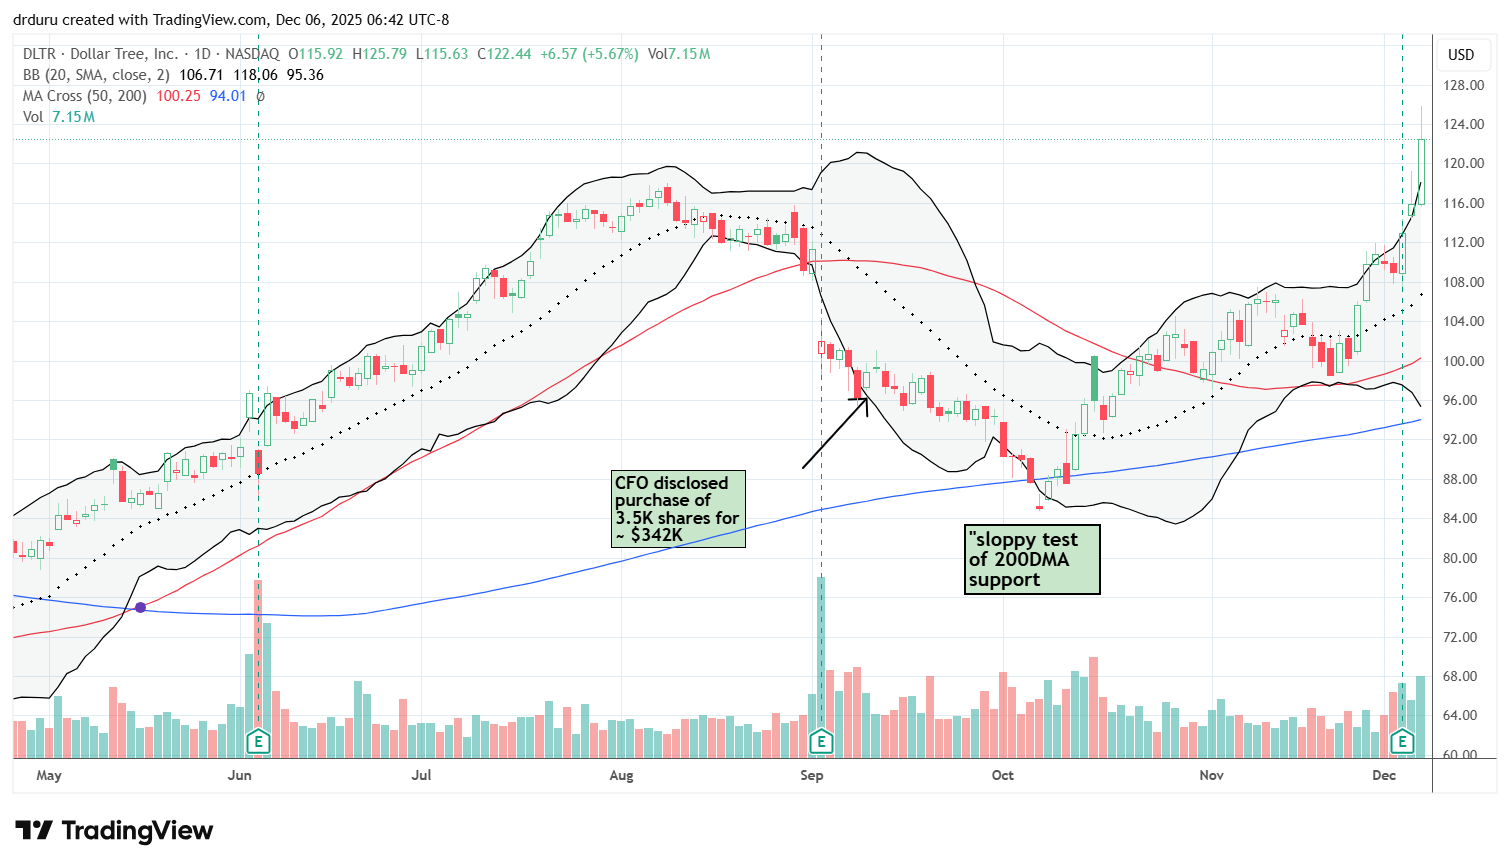
Dollar Tree (DLTR) broke out to an 18-month high following a 3.6% post-earnings gain and continued momentum to a 20-month high.
Trade commentary:
DLTR delivered a strong post-earnings move and continued higher into an 18-month high. Volume supported the breakout. However, DLTR is now overextended well above its upper BB in the short term, so I am waiting (again) to buy dips.
Dollar General (DG)
Description:
Dollar General (DG) operates retail discount stores offering household goods, food items, and consumer essentials.
Technical status:
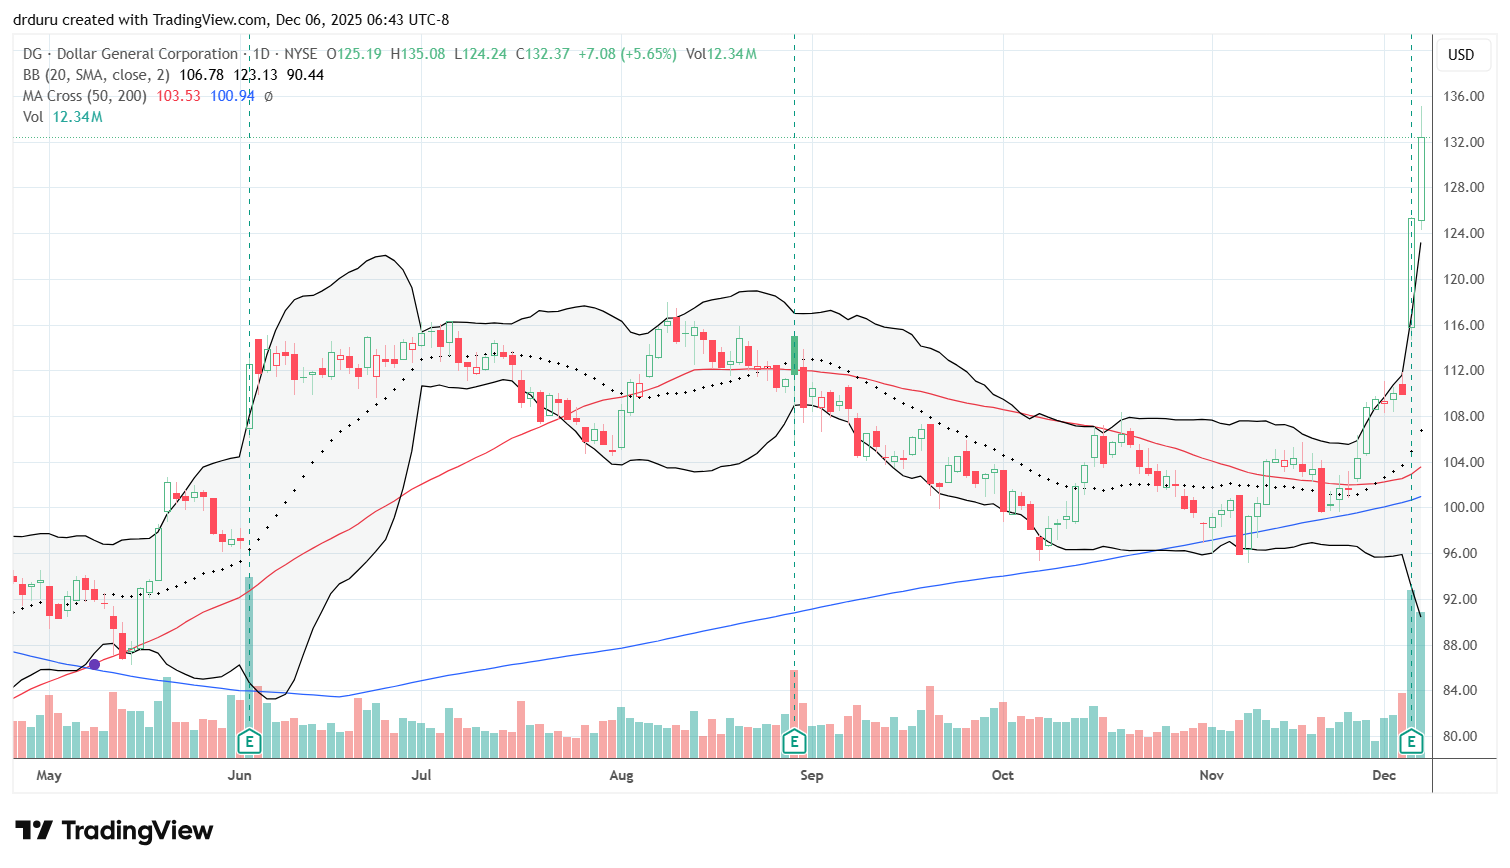
Dollar General (DG) staged a powerful breakout to a 17-month high after holding support at all the major trendlines and surging 14.0% post earnings.
Trade commentary:
DG delivered an even stronger post-earnings move than DLTR. I have talked endlessly about these two discount retailers, so I should have simply bought and held both! DG held 200DMA support after failing at 50DMA resistance in October and thus created a strong setup going into earnings. I plan to buy dips rather than chase this extended move.
Booz Allen Hamilton (BAH)
Description:
Booz Allen Hamilton (BAH) provides management consulting, analytics, and technology services for government and commercial clients.
Technical status:
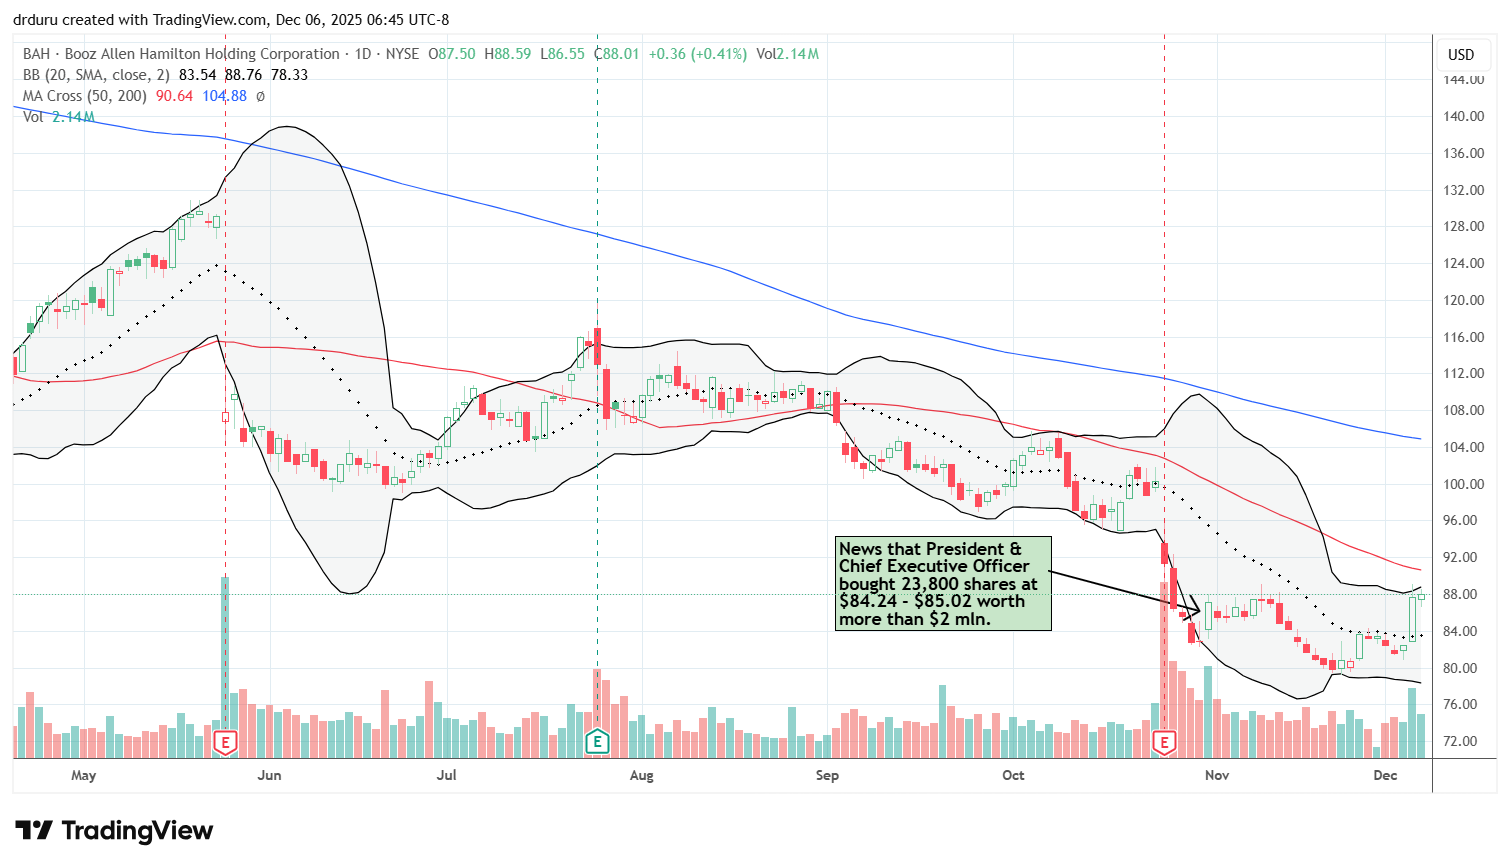
Booz Allen Hamilton (BAH) rebounded toward 50DMA resistance after insider buying but remains below key trend lines.
Trade commentary:
BAH was on my radar because the CEO purchased $2 million worth of stock in October. The market was not impressed initially. I sold a put option expecting the stock to hold steady, but instead I was assigned shares. I next sold an $85 call option when the stock bounced. My position is positive overall, and I am fine if the stock gets called away at December options expiration. If so, I will look to reenter the stock on a dip. A breakout above the 50DMA would confirm a potential turnaround. Insider buying of this size keeps me bullish unless major negative news contradicts the signal.
Cross Country Healthcare (CCRN)
Description:
Cross Country Healthcare (CCRN) provides nurse staffing and workforce solutions for healthcare organizations.
Technical status:
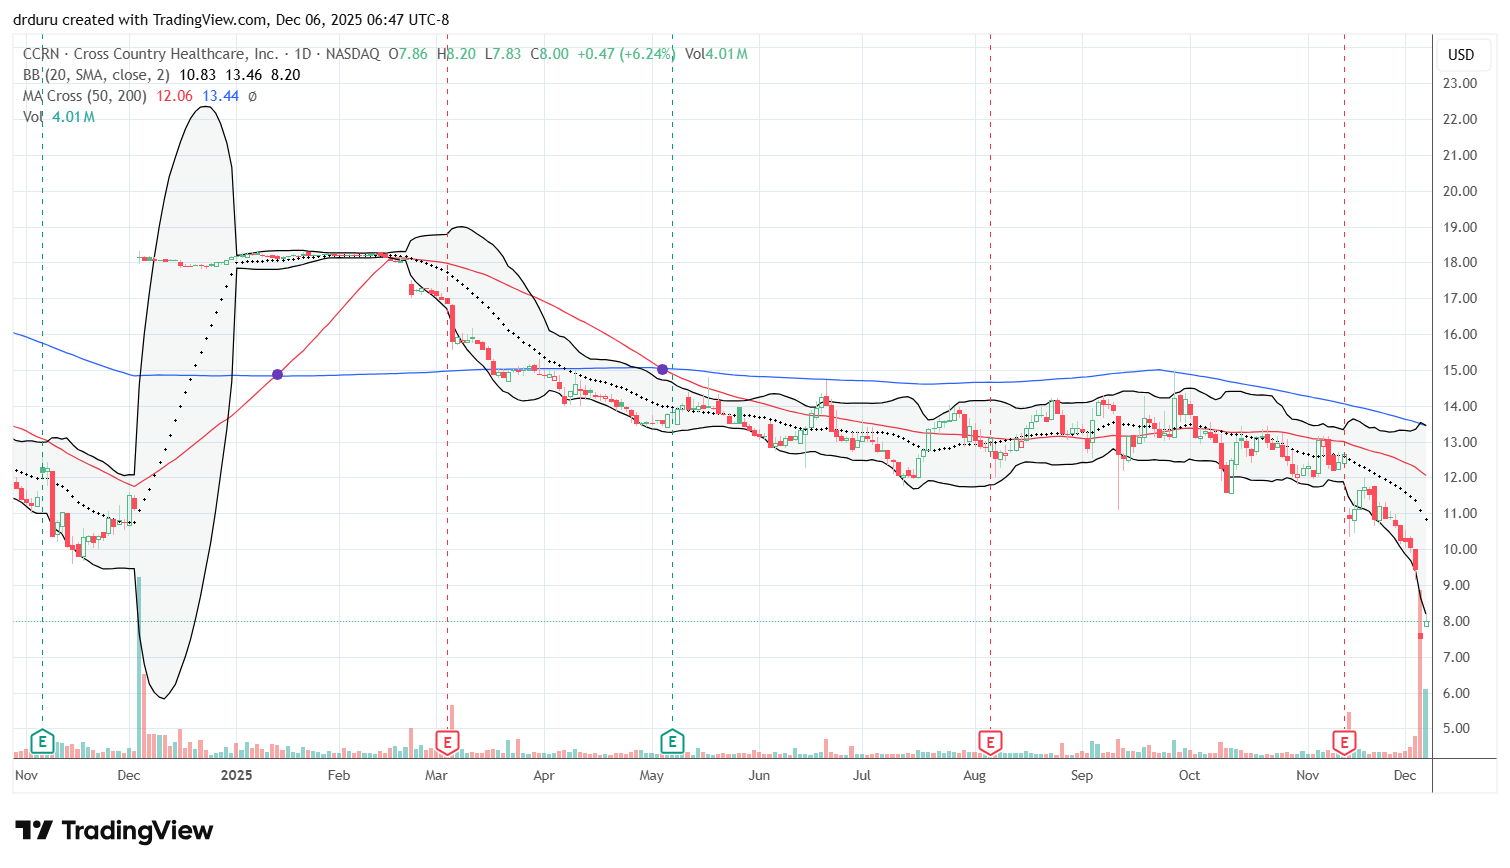
Cross Country Healthcare (CCRN) broke down 20.3% after a withdrawn acquisition offer and returned to price levels last seen early in the pandemic.
Trade commentary:
CCRN was another disappointment for the week, although less surprising than DOMO. The stock collapsed 20.3% after Aya Healthcare withdrew its acquisition offer. Last year, the stock soared 62% on a takeout offer from another healthcare company, but regulatory concerns stalled momentum. I was an investor before that news but had already taken profits on my last position. As the stock pulled back, I slowly reaccumulated shares, assuming the merger would eventually be approved.
The stock market now treats CCRN as being much worse off than before the offer. The stock is back near early-pandemic levels. I think this panic is overdone, so rather than sell with the stampede I actually added more shares. Still, the stock is clearly broken and may take one or two years to recover. I hope management can refocus without the M&A distraction.
Ramaco Resources (METC)
Description:
Ramaco Resources (METC) produces metallurgical coal and engages in related resource development activities.
Technical status:
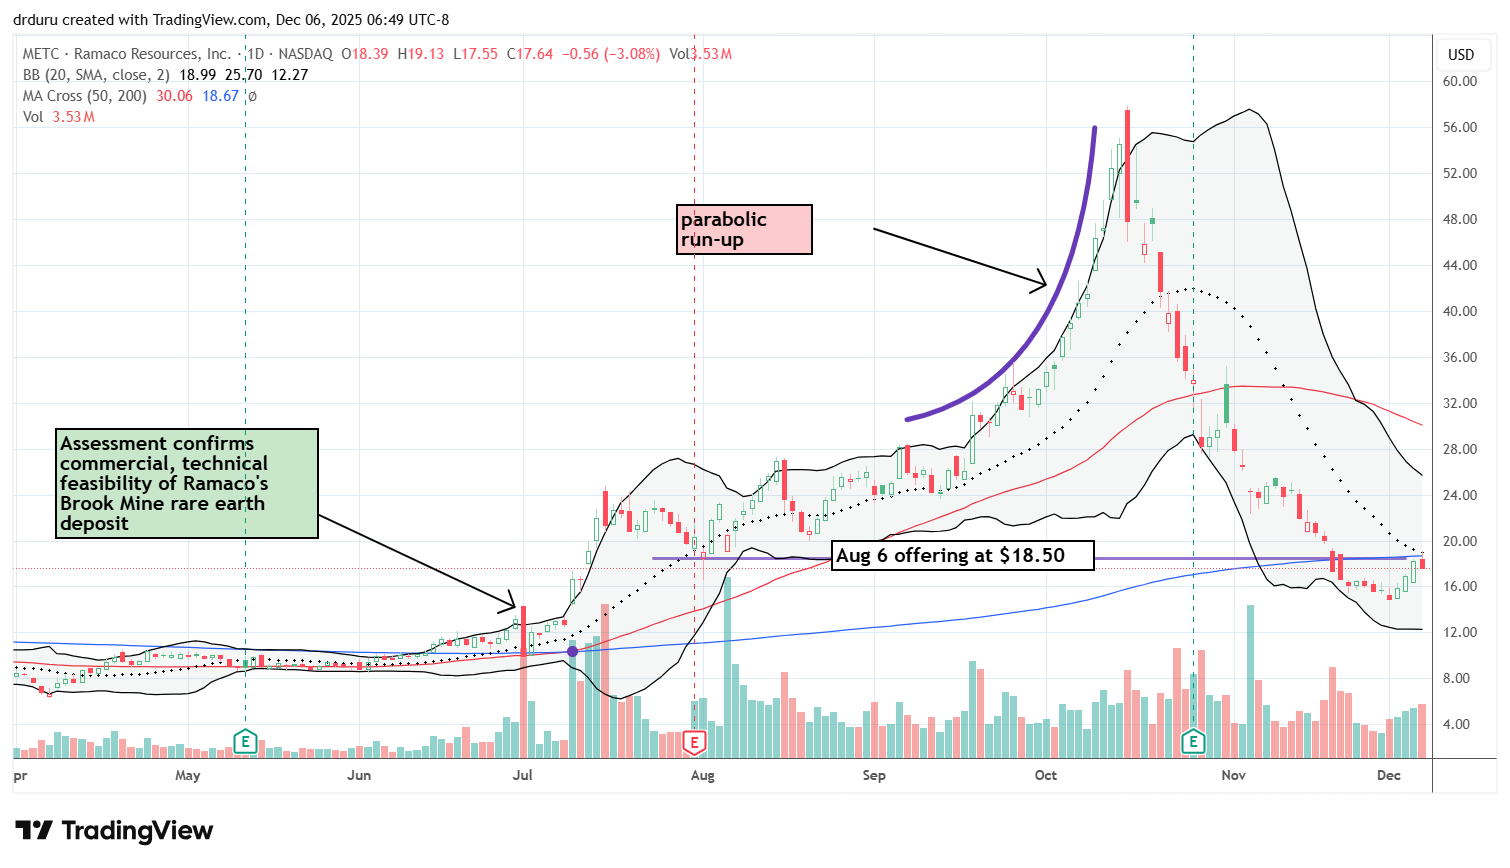
Ramaco Resources (METC) failed at resistance near 18.50 after a major parabolic run and continued trading in bearish position.
Trade commentary:
METC was driven earlier this year by commercial and technical feasibility news about a rare earth deposit and possible government funding. The company offered stock at $18.50 in August, and did well to hold that level as support, a very bullish development. A warning sign appeared for METC with a dramatic bearish engulfing pattern after a parabolic runup. Sellers poured in nearly nonstop into late November. Buyers are now trying to stabilize METC, but $18.50 has shifted from support to resistance. That resistance now aligns with the downtrending 20DMA and the 200DMA, creating heavy bearish resistance. METC needs to break out above $18.50 to set up a new bullish trade.
Be careful out there!
Footnotes
Subscribe for free to get email notifications of future posts!
“Above the 50” (AT50) uses the percentage of stocks trading above their respective 50-day moving averages (DMAs) to measure breadth in the stock market. Breadth defines the distribution of participation in a rally or sell-off. As a result, AT50 identifies extremes in market sentiment that are likely to reverse. Above the 50 is my alternative name for “MMFI” which is a symbol TradingView.com and other chart vendors use for this breadth indicator. Learn more about AT50 on my Market Breadth Resource Page. AT200, or MMTH, measures the percentage of stocks trading above their respective 200DMAs.
Active AT50 (MMFI) periods: Day #121 over 20%, Day #10 over 30%, Day #8 over 40%, Day #3 over 50% (overperiod), Day #52 under 60% (underperiod), Day #94 under 70%
Source for charts unless otherwise noted: TradingView.com
Full disclosure: long IWM shares, long SPY put spreads, long IWM calendar call spread, long MSFT, long DOMO, long BAH shares and short a call option, long CCRN
FOLLOW Dr. Duru’s commentary on financial markets via StockTwits, BlueSky, and even Instagram!
*Charting notes: Stock prices are not adjusted for dividends. Candlestick charts use hollow bodies: open candles indicate a close higher than the open, filled candles indicate an open higher than the close.
* Blog notes: this blog was written based on the heavily edited transcript of the following video that includes a live review of the stock charts featured in this post. I used ChatGPT to process the transcript.