Stock Market Commentary:
The Q3 2022 U.S. GDP report from the Bureau of Economic Analysis undermined this year’s strident claims that the economy overall is already in recession. Q3 GDP grew 2.6% largely thanks to a 2.8% growth in personal expenditures for services (one more validation of the relatively strong jobs market) and thanks to an astonishing 14.4% growth in exports despite the surging value of the U.S. dollar (DXY). With the schedule for a recession put on hold, the S&P 500 (SPY) finished a second straight week of gains. The index delivered an important bear market breakthrough that further confirms the recent bear market bottom and sets the stage for further follow-through sometime in the last two months of the year.
The Stock Market Indices
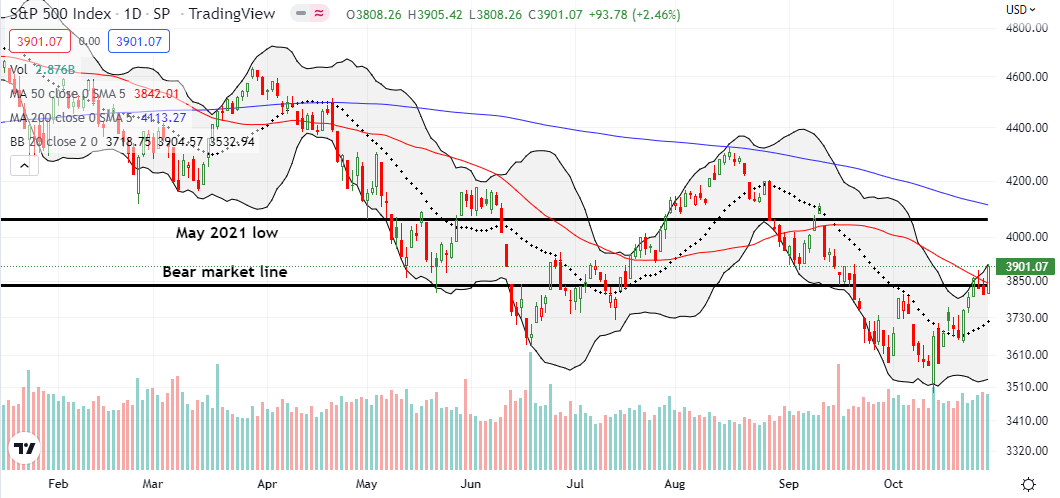
The S&P 500 (SPY) ended the week with a 2.5% gain. This carbon copy of the end of the prior week delivered a breakout above the 50-day moving average (DMA) (the red line below). The move also confirmed a breakout above the bear market line. The S&P 500 now looks ready to erase its remaining loss from September, challenge (eventually) resistance at its May, 2021 low, and even retest 200DMA resistance (the blue/purple line below).
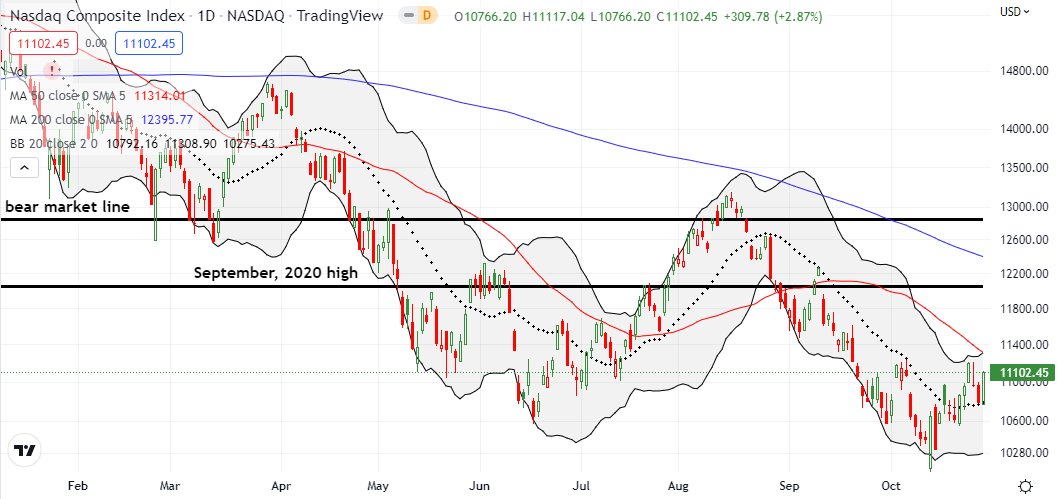
The NASDAQ (COMPQ) is lagging the S&P 500 thanks to some high profile post-earnings blow-ups from big cap tech. Still, the tech-laden index managed to defend support at its 20DMA (the dotted line below) with a 2.9% surge that also netted a 2.2% gain for the week. Apple (AAPL) led the way with a stunning post-earnings reversal: AAPL gained 7.6% a day after confirming 50DMA resistance. Sellers were only able to fade AAPL off 200DMA resistance. The NASDAQ next faces a stiff challenge overcoming resistance from a steeply declining 50DMA.
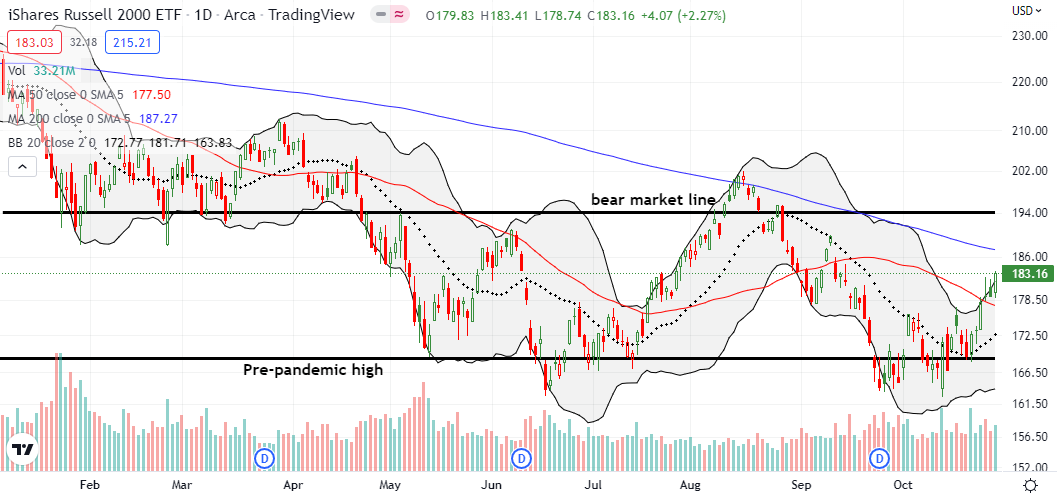
The iShares Russell 2000 ETF (IWM) continues to demonstrate the most solid base of trading. Friday’s 2.3% gain confirmed a 50DMA breakout for the ETF of small caps. IWM also finished erasing its remaining loss from September and looks set to challenge overhead 200DMA resistance.
Stock Market Volatility
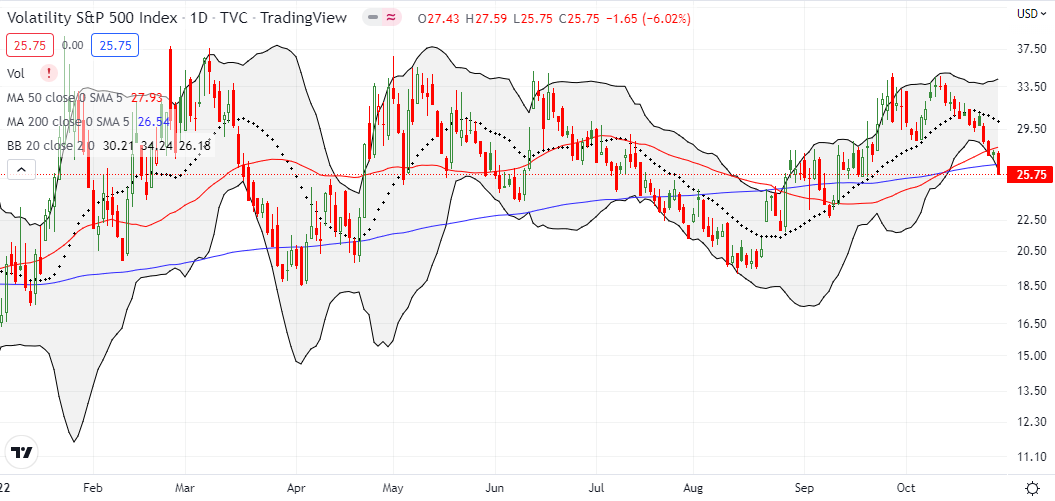
The volatility index (VIX) is now in a definite downtrend off the October high. The orderly decline is helping to escort the stock market higher.
The Short-Term Trading Call With A Bear Market Breakthrough
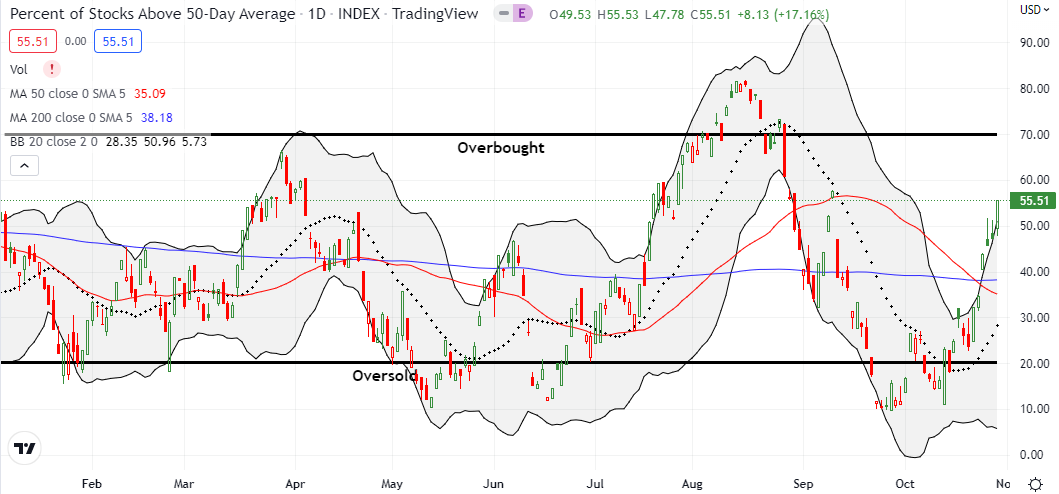
- AT50 (MMFI) = 55.5% of stocks are trading above their respective 50-day moving averages
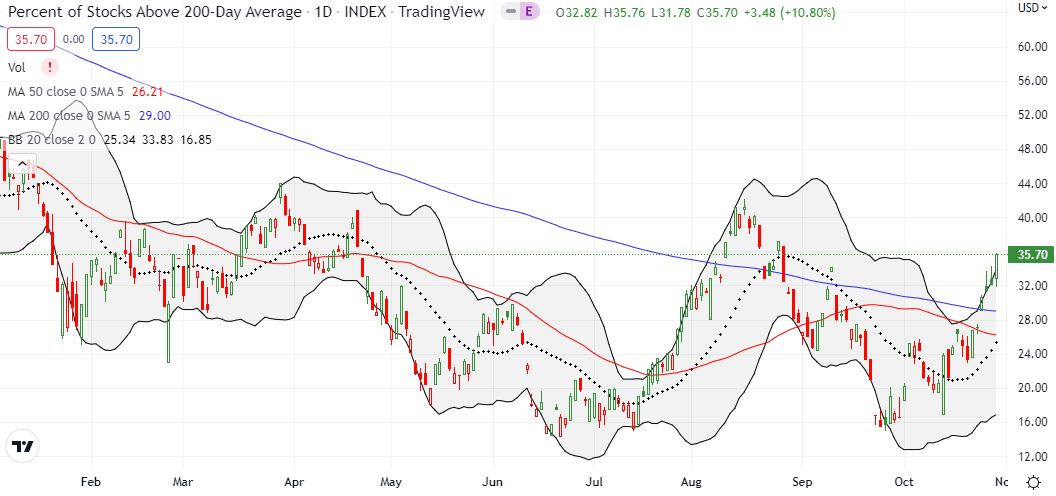
- AT200 (MMTH) = 35.7% of stocks are trading above their respective 200-day moving averages
- Short-term Trading Call: bullish
AT50 (MMFI), the percentage of stocks trading above their respective 50DMAs, closed at 55.5%. Last week’s surge validated my decision to upgrade my short-term trading call from cautiously bullish to bullish. “Fundamentals” can often cloud the signal from price; without the technicals and the AT50 trading rules, I might have otherwise been tempted to cling to bearishness. However, with overbought conditions already in sight again (AT50 above 70%), the short-term technicals enter a tricky period. It was just two weeks ago when the stock market was chasing its tail. The week after that delivered an important breakthrough above 20DMA resistance levels. Last week delivered a bear market breakthrough for the S&P 500 that could cause premature feelings of an “all-clear.” Accordingly, I fully expect more back and forth before the next clean move higher. Regardless, my bullish call means I will look to buy dips from here.
The fruits of last week’s trading confirmed my strategy of buying calendar call spreads to reduce payments for options premiums and provide opportunities to profit from churn. When IWM raced past my $175 strike for a calendar call spread, I turned that position into a “backstop” for additional call option trades. As a result, I could still profit from that spread if IWM suffers a setback to or below its 50DMA support. Friday’s rally left me feeling underinvested in SPY, so I added a Nov 04/Nov 18 $390 calendar call spread to the mix. (And yes, I would have been even better off if I dared to just load up long call options).
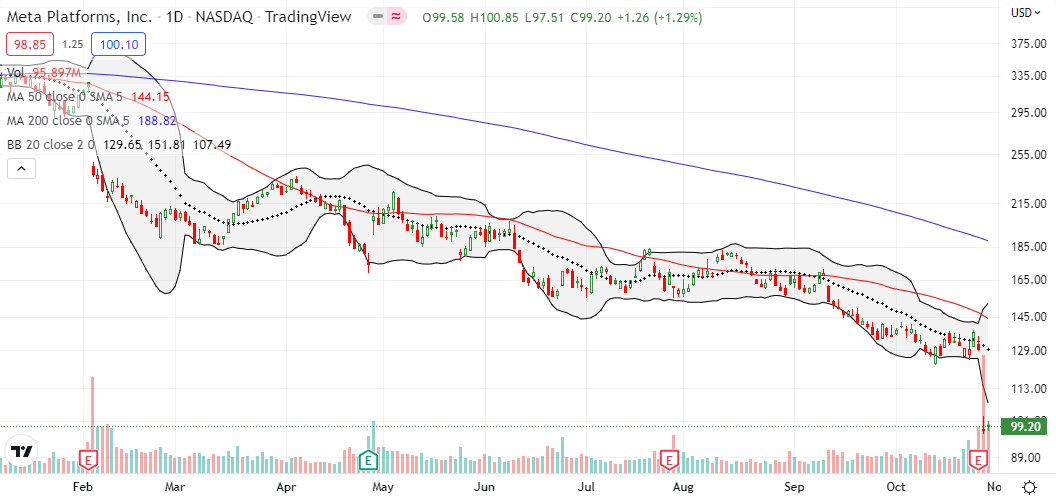
Last week’s rally was even more amazing given large setbacks for several big cap tech stocks. The plunge in Meta Platforms, Inc (META) was an epic decline to 6+ year lows. Once again, I am reminded of the dangers of ignoring the warning signs in a persistent downtrend. In the context of price action, META’s blow-up looks like the logical conclusion of intractably poor trading action. META’s disaster is all the more poignant given the army of pundits and analysts who called META cheap all the way down and continued to like the stock (even if they did not like the company!).
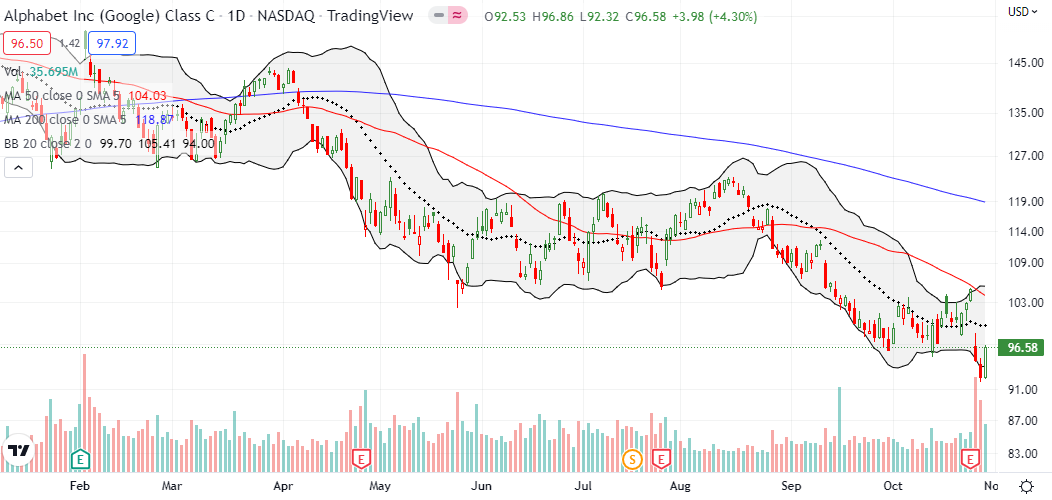
Alphabet Inc (GOOG) was another big-cap tech stock that should have dampened moods in the indices. GOOG delivered its last warning with September’s breakdown. Just ahead of its 9.6% post-earnings loss, GOOG traded right back to that breakdown point and challenged 50DMA resistance. Buyers are right back to trying to repair the price action with a surge on Friday that took GOOG back to the pre-earnings low.
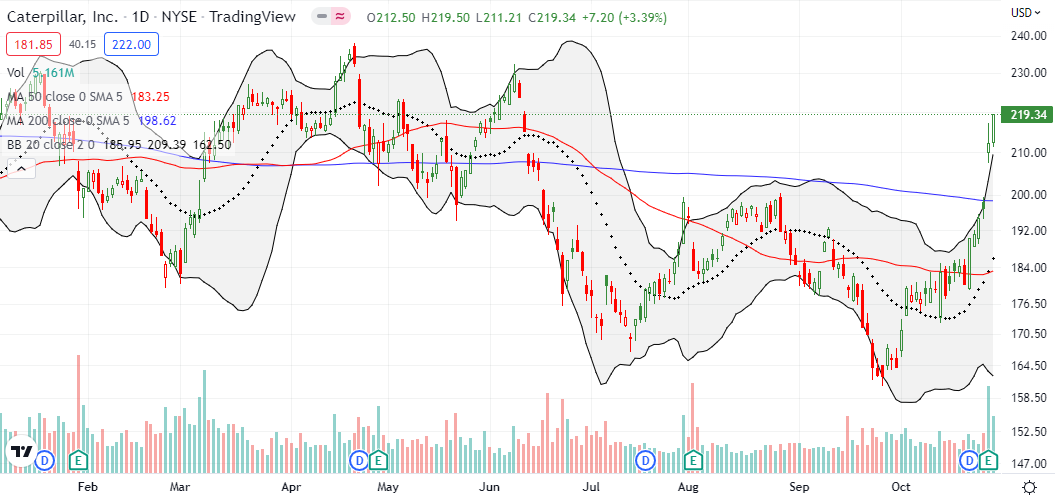
With money fleeing from big-cap tech, industrials are enjoying a fresh revival. Caterpillar, Inc (CAT) surged 7.7% and printed a 200DMA breakout after reporting earnings Thursday morning. Buyers followed through with a 3.4% gain which took CAT close to its triple top. CAT is up an amazing 33.7% in October. Needless to say, my growing interest in non-tech stocks took another leap forward last week!
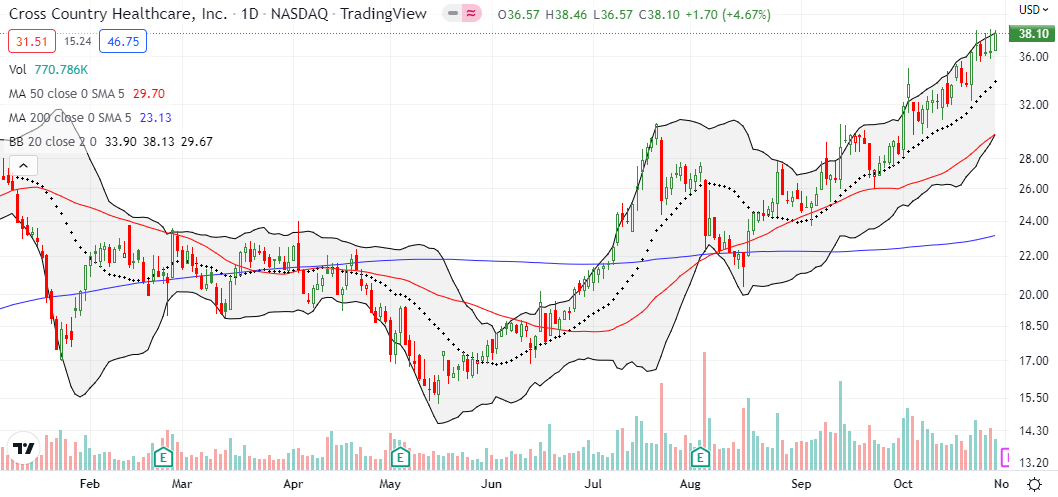
I last discussed Cross Country Healthcare, Inc (CCRN) almost a year ago. I enjoyed a few good trades in CCRN, but I let an “Amazon Panic” over the company’s acquisition of One Medical in July force me to take profits on my last position before I was ready. A 15.6% post-earnings loss sealed the deal on my attention. I even failed to get back in the game after the company authorized a fresh $100M stock buyback in the wake of the post-earnings selling. Perhaps predictably, CCRN proceeded to resume its uptrend (cash is moving into the healthcare space in general). Now, I can only wait for the next dip!
Be careful out there!
Footnotes
“Above the 50” (AT50) uses the percentage of stocks trading above their respective 50-day moving averages (DMAs) to measure breadth in the stock market. Breadth defines the distribution of participation in a rally or sell-off. As a result, AT50 identifies extremes in market sentiment that are likely to reverse. Above the 50 is my alternative name for “MMFI” which is a symbol TradingView.com and other chart vendors use for this breadth indicator. Learn more about AT50 on my Market Breadth Resource Page. AT200, or MMTH, measures the percentage of stocks trading above their respective 200DMAs.
Active AT50 (MMFI) periods: Day #10 over 20%, Day #6 over 30%, Day #4 over 40%, Day #1 over 50% (overperiod ending 35 days under 50%), Day #44 under 60%, Day #45 under 70%
Source for charts unless otherwise noted: TradingView.com
Full disclosure: long IWM calendar call spreads, long SPY calendar call spread, long QQQ call spread
FOLLOW Dr. Duru’s commentary on financial markets via StockTwits, Twitter, and even Instagram!
*Charting notes: Stock prices are not adjusted for dividends. Candlestick charts use hollow bodies: open candles indicate a close higher than the open, filled candles indicate an open higher than the close.


Speaking of non tech stocks….Dow chart challenging its 200 day MA already.
Share your frustration with CCRN. Traded it most of 2021 expecting it to become a leader. Exentually it also fell off my radar, and really gasped a huge sign of relief upon not getting caught in the previous earning demise. Goes to show how sick mindes Mr. Market is.
Amazing.
Glad I’m not the only one!