

Stock Market Commentary
The protracted shutdown of the U.S. Federal government has dragged past three weeks and Federal workers have now missed their first paychecks of this battle. The stock market rallied to an all-time high when the shutdown started, and it certainly seems to care even less after recovering from a 1-day mini panic after fresh trade tensions between the U.S. and China. That pullback triggered the seasonal buying opportunity created by a maximum drawdown in October. I stayed cautious, preferring to get bullish only after a confirmation of a resumption of the uptrend (see below). With the uptrend secured once again, the week ended in timely fashion at a fresh all-time high. This breakout looks like the start of the next market melt-up.
The volatility index (VIX) marked the occasion by completing its full reversal of the surge that came with the fresh trade tensions. The trouble with regional banks turned out to be the final surge of this up-cycle for the VIX. The full reversal and return to the earlier trading range underlines the next market melt-up.
")
The Stock Market Indices
S&P 500 (SPY)
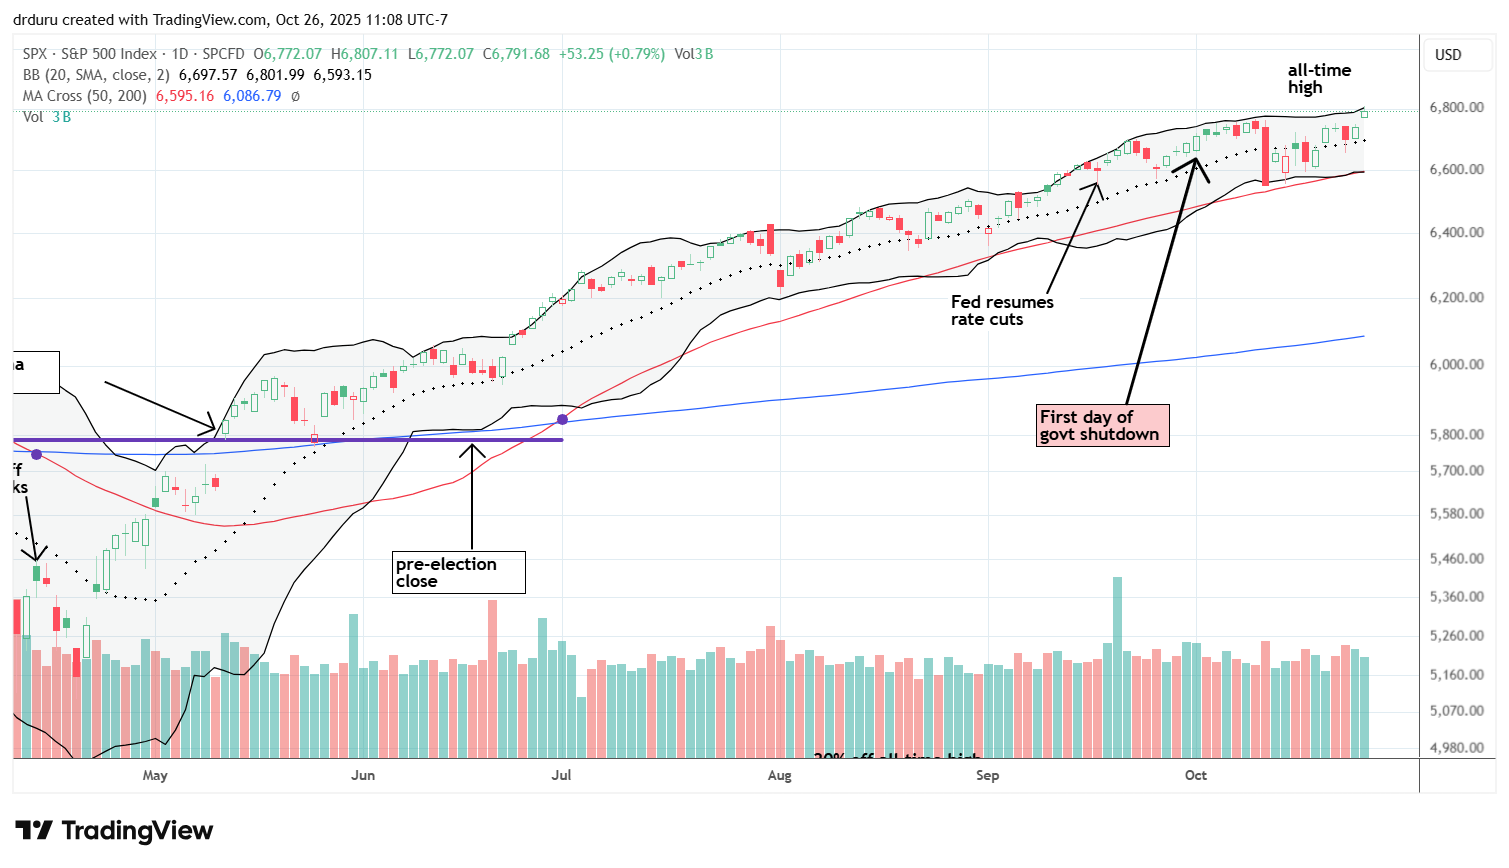
The S&P 500 reached a new all-time high, gaining 0.8% to end the week. The index cleared the large 2.7% down day from two weeks ago when fresh trade tensions erupted between the U.S. and China. These convulsions also set up a launch point for this next market melt-up. The 50-day moving average (DMA) (the red line) held as support, and the 20DMA (the dashed line) is once again in position to provide primary trend support.
NASDAQ (COMPQX)
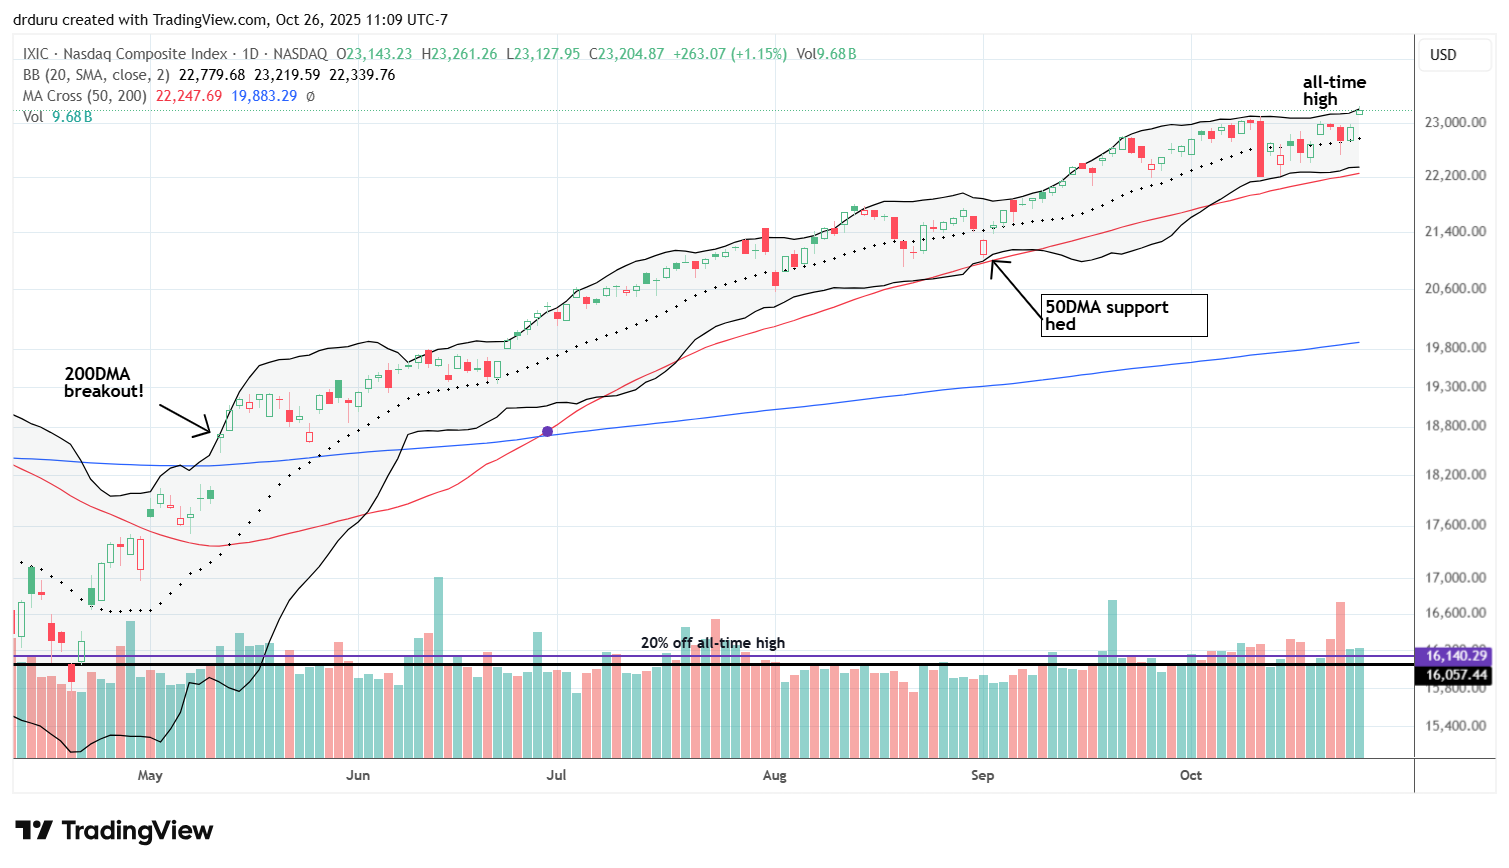
The NASDAQ mirrored the S&P 500, maintaining a steady 50DMA uptrend through recent volatility. The index also set a new all-time high on Friday, reclaiming its 20DMA as support in the process. Together, the S&P 500 and the NASDAQ are just about as bullish as they can get at this stage of the rally. Yet one more negative catalyst is sinking in the rear view mirror.
iShares Russell 2000 ETF (IWM)
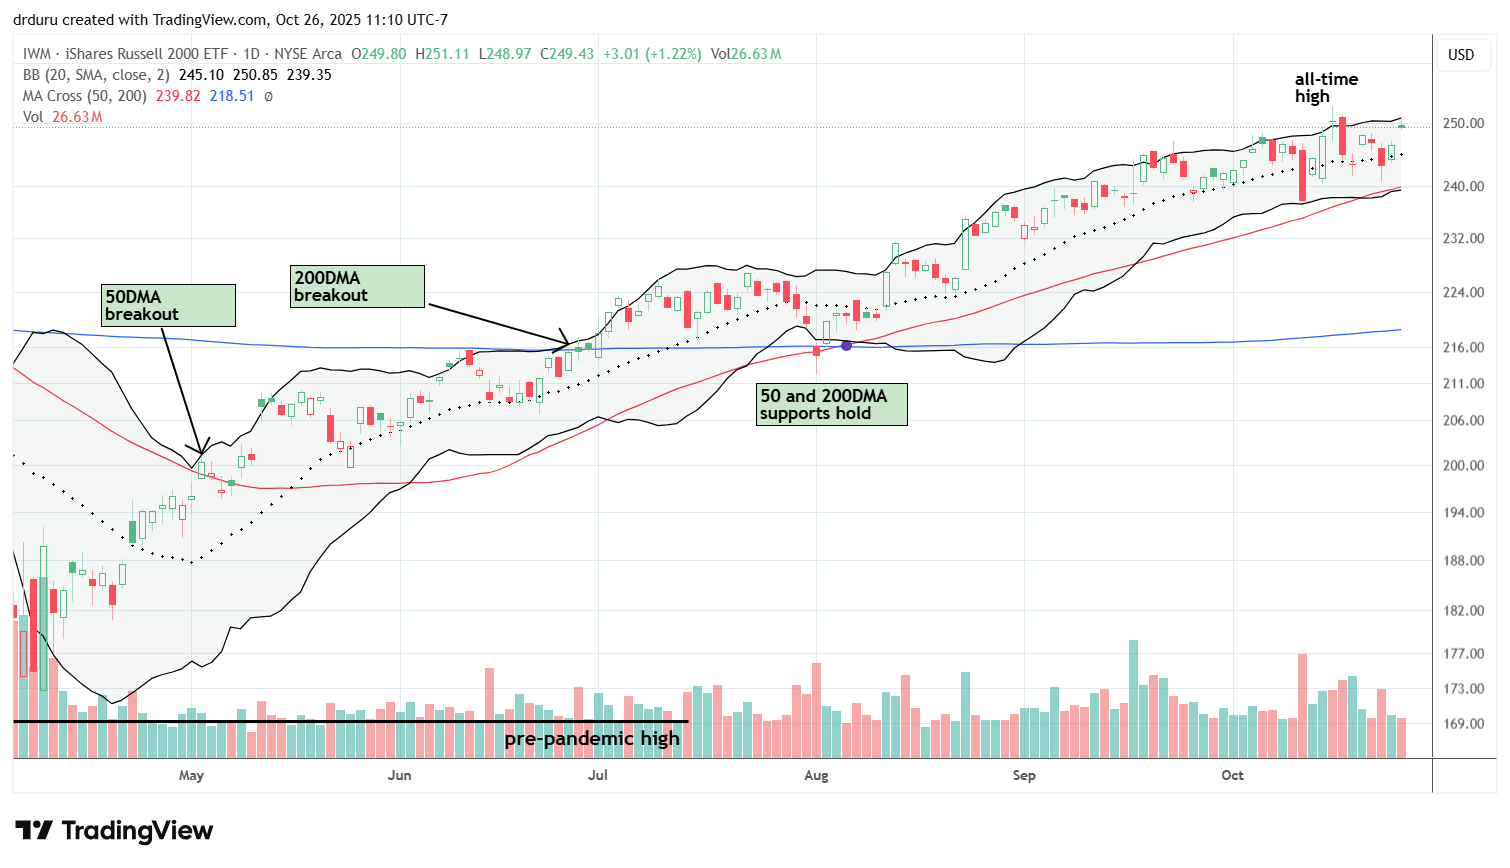
After a bout of technical outperformance in the previous week, the iShares Russell 2000 ETF (IWM) lagged last week. The ETF of small caps fell just short of setting a new all-time high and faded from its intraday high. I took a small profit on my latest tranche of IWM call options and am waiting for a pullback before re-entering. Like the other two indices, the uptrends from the 20DMA and 50DMA remain intact.
The Short-Term Trading Call With the Next Market Melt-Up
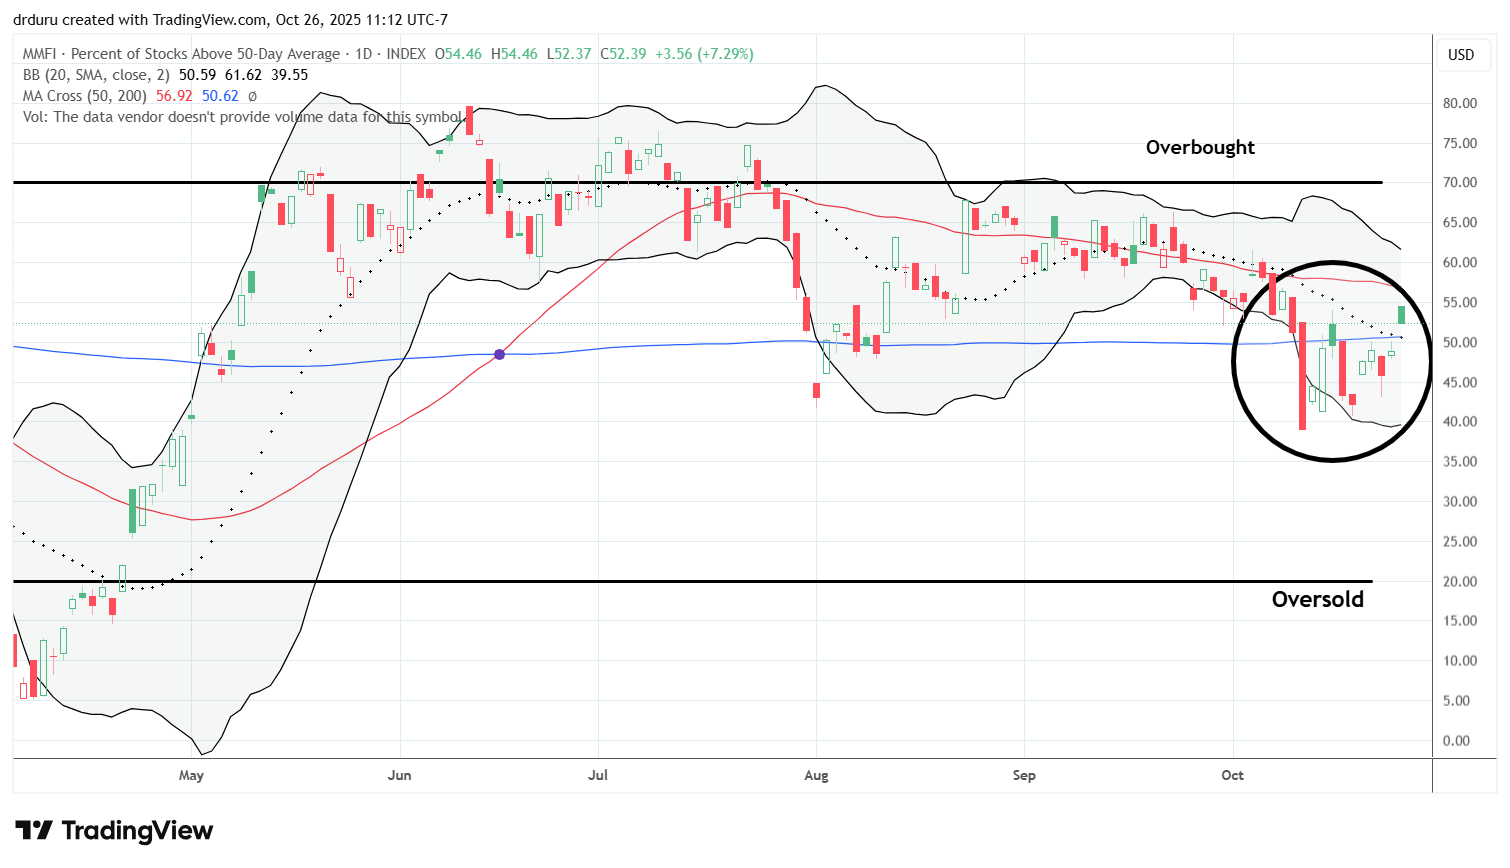
- AT50 (MMFI) = 52.4% of stocks are trading above their respective 50-day moving averages
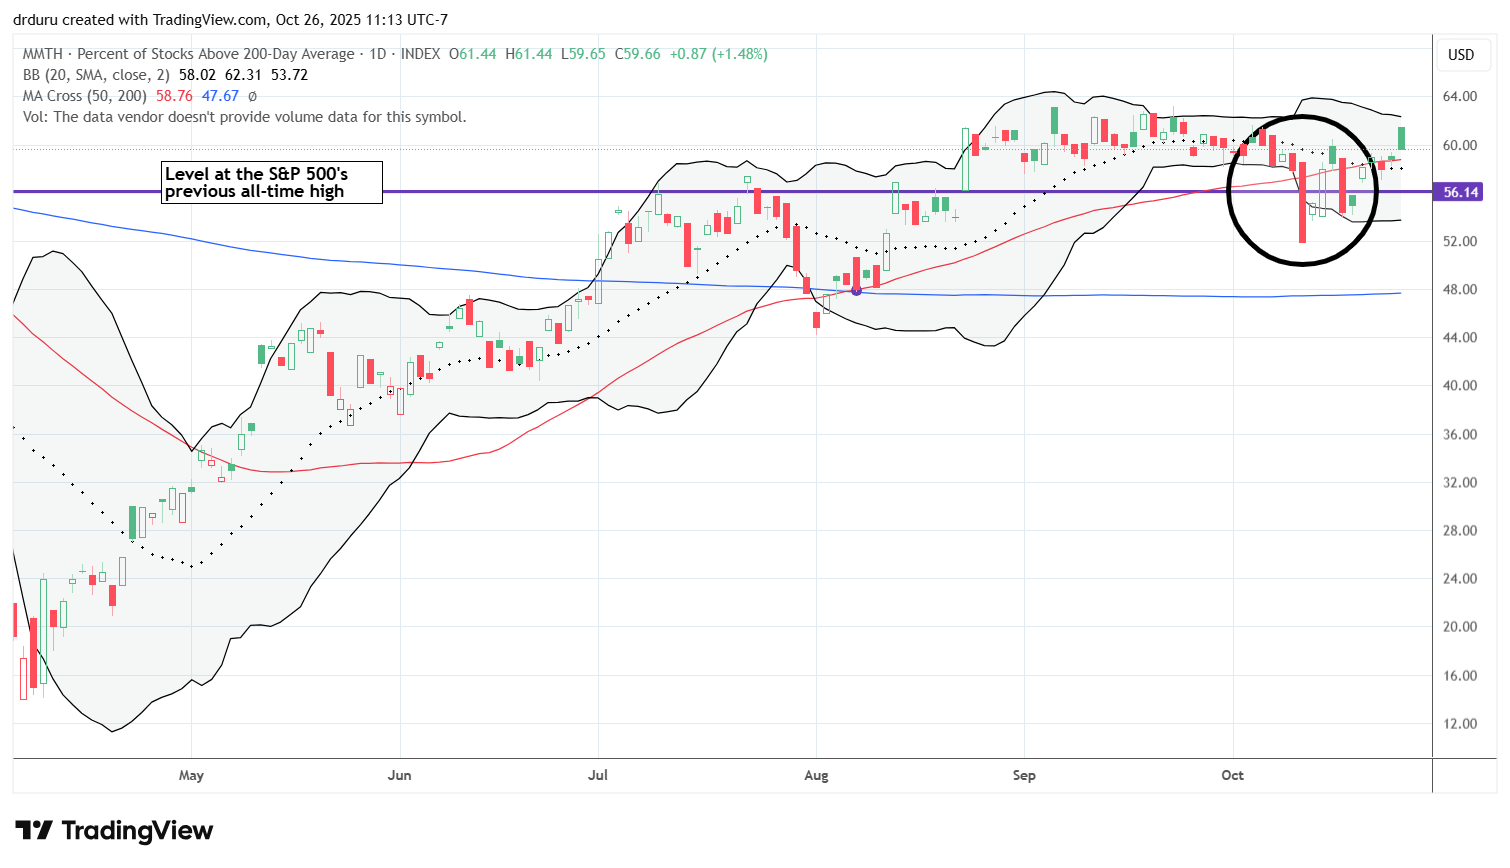
- AT200 (MMTH) = 59.7% of stocks are trading above their respective 200-day moving averages
- Short-term Trading Call: cautiously bullish
AT50 (MMFI), the percentage of stocks trading above their respective 50DMAs, closed the week at 52.4%. My favorite technical indicator fully recovered from the plunge two weeks ago but remains stuck in a broader downtrend. As promised in my last Market Breadth post, I finally flipped the short-term trading call back to bullish after the S&P 500 jumped above its 20DMA. The index pressed the point right from the open of trading for the week and gained 1.1% to mark my return to a bullish short-term trading call. Buyers wavered slightly on Wednesday but Friday’s close confirmed the next market melt-up is underway.
Still, the downtrend in AT50 tells me the underlying technical health of the market is tenuous. The market’s sorry stragglers form part of this downtrend. Fortunately, AT200 (MMTH), the percentage of stocks trading above their 200DMAs, paints a stronger picture. This indicator of longer-term technical health cleared resistance from its level earlier in the year when the S&P 500 made an all-time high. The improvement in longer-term breadth gives me more confidence in upgrading the short-term trading call even though AT200 is a longer-term indicator.
The Equities: Next Market Melt-Up
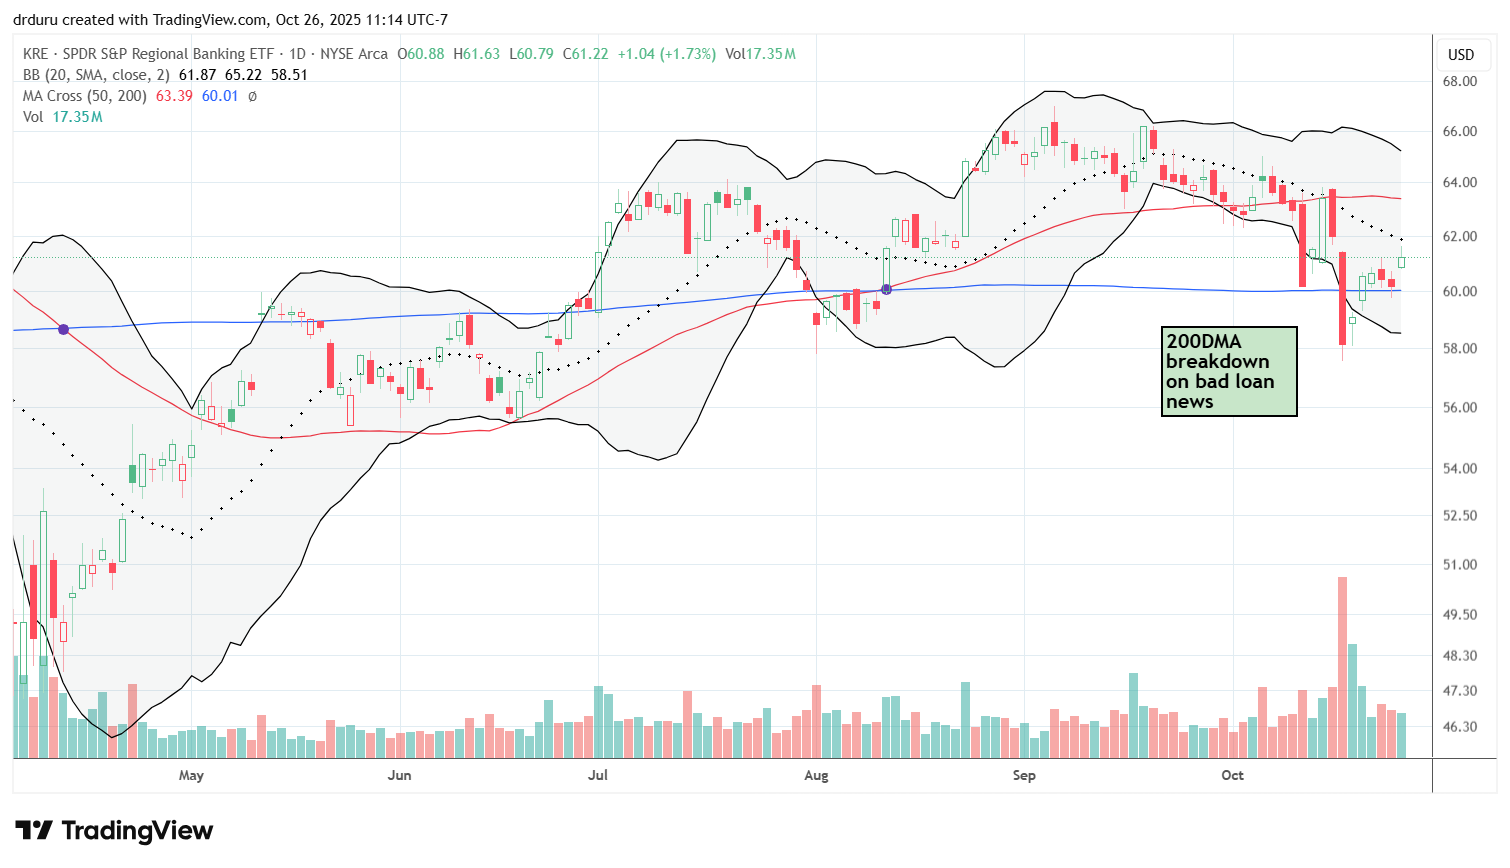
SPDR S&P Regional Banking ETF (KRE)
Description: An exchange-traded fund that tracks the performance of U.S. regional banks.
Technical status: KRE fell sharply twice in the past two weeks but has now stabilized and recovered above its 200DMA. The ETF remains in the danger zone with a downtrending 20DMA but shows early signs of healing.
Trade commentary: The selling stopped on a dime after the last steep decline. While conditions remain fragile, KRE appears to be mending. I’m watching to see whether KRE can sustain momentum above the 200DMA. Overall, I am not interested in buying KRE because the stock market offers far better options for upside potential…likely with less risk.
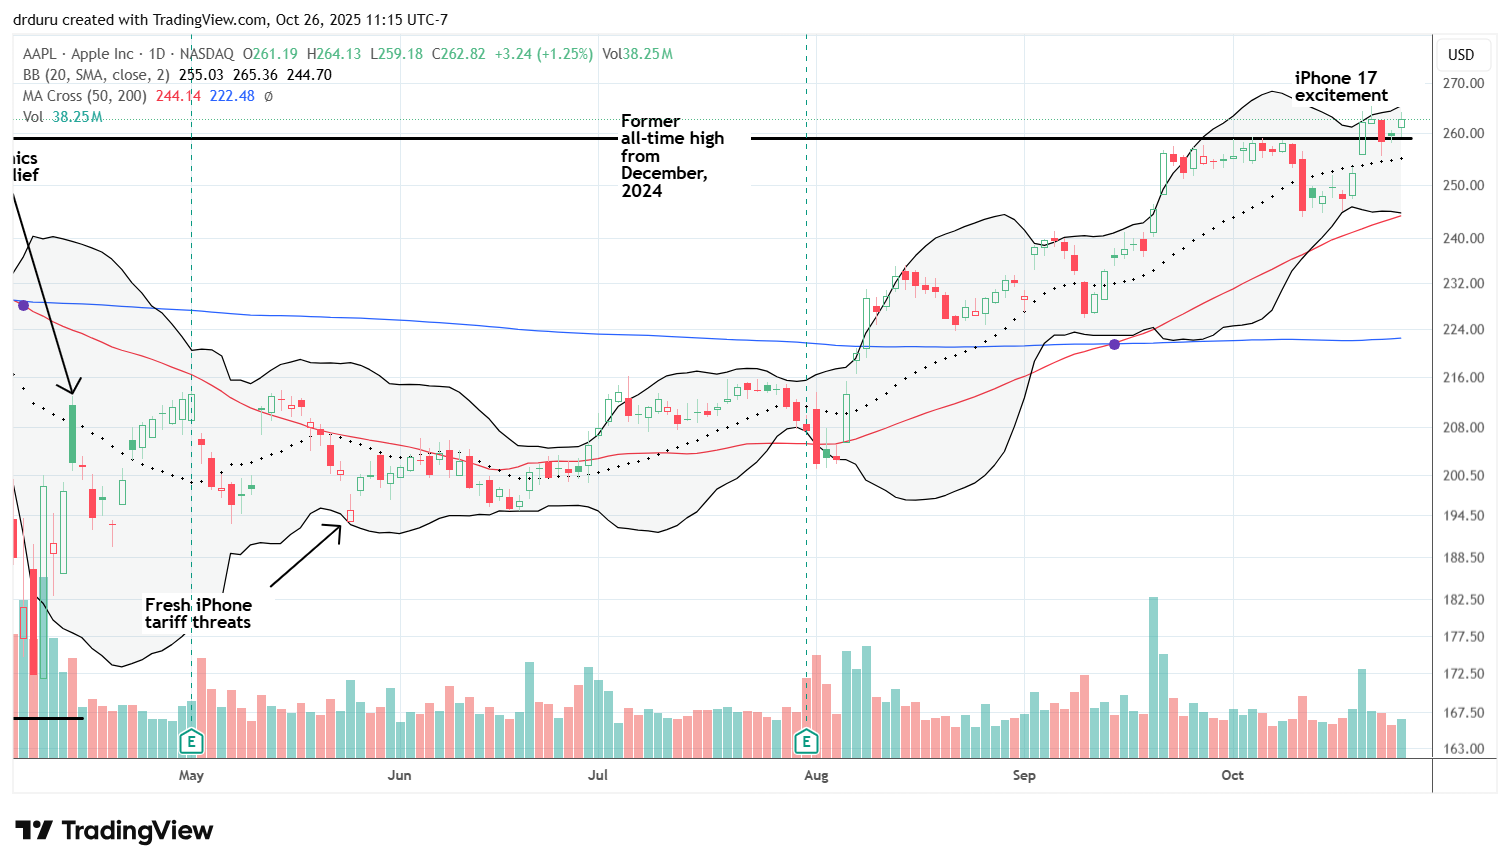
Apple (AAPL)
Description: Designs and sells smartphones, personal computers, tablets, and wearables.
Technical status: Apple gapped higher 3.9% on iPhone 17 sales news, breaking out to new all-time highs after a long period of technical underperformance relative to the S&P 500 and the NASDAQ.
Trade commentary: I stayed short Apple as a hedge, but this breakout signals the need to let go. I may even flip long by trying call options ahead of earnings on on October 30th. This breakout could be just the beginning of the release of substantial pent-up buying interest in AAPL.
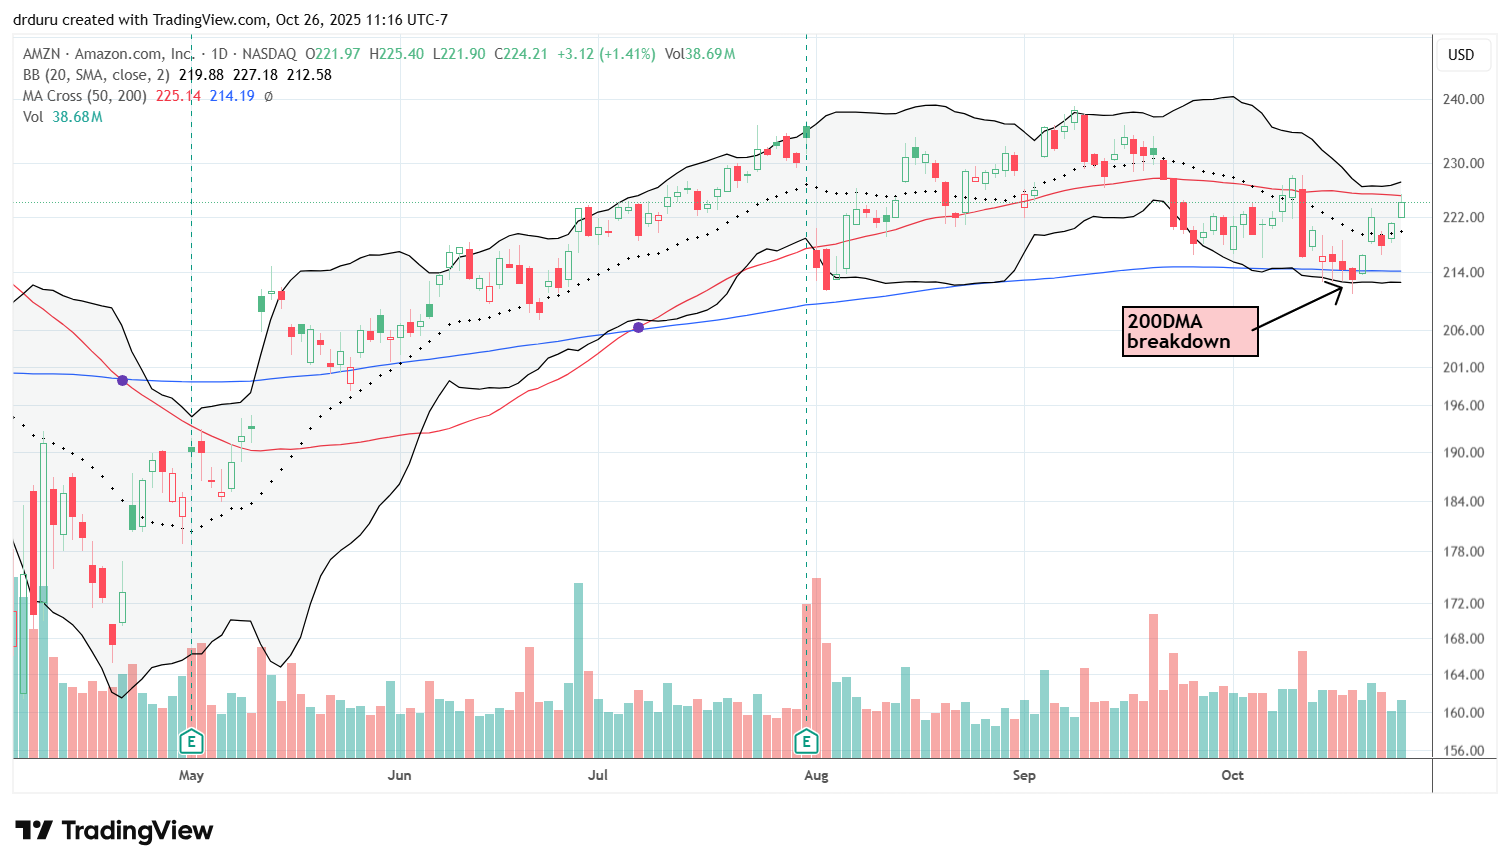
Amazon.com (AMZN)
Description: Operates an e-commerce platform and cloud computing business through Amazon Web Services.
Technical status: AMZN recovered from its 200DMA breakdown and rallied toward 50DMA resistance. Trade commentary: AMZN has lagged the major indices. The last peak did not even challenge AMZN’s all-time high. However, given traders and investors bought AMZN despite the week starting with a massive AWS outage, I suspect AMZN sellers have exhausted themselves. Note the stock rebounded perfectly after testing its post-earnings closing low from August.
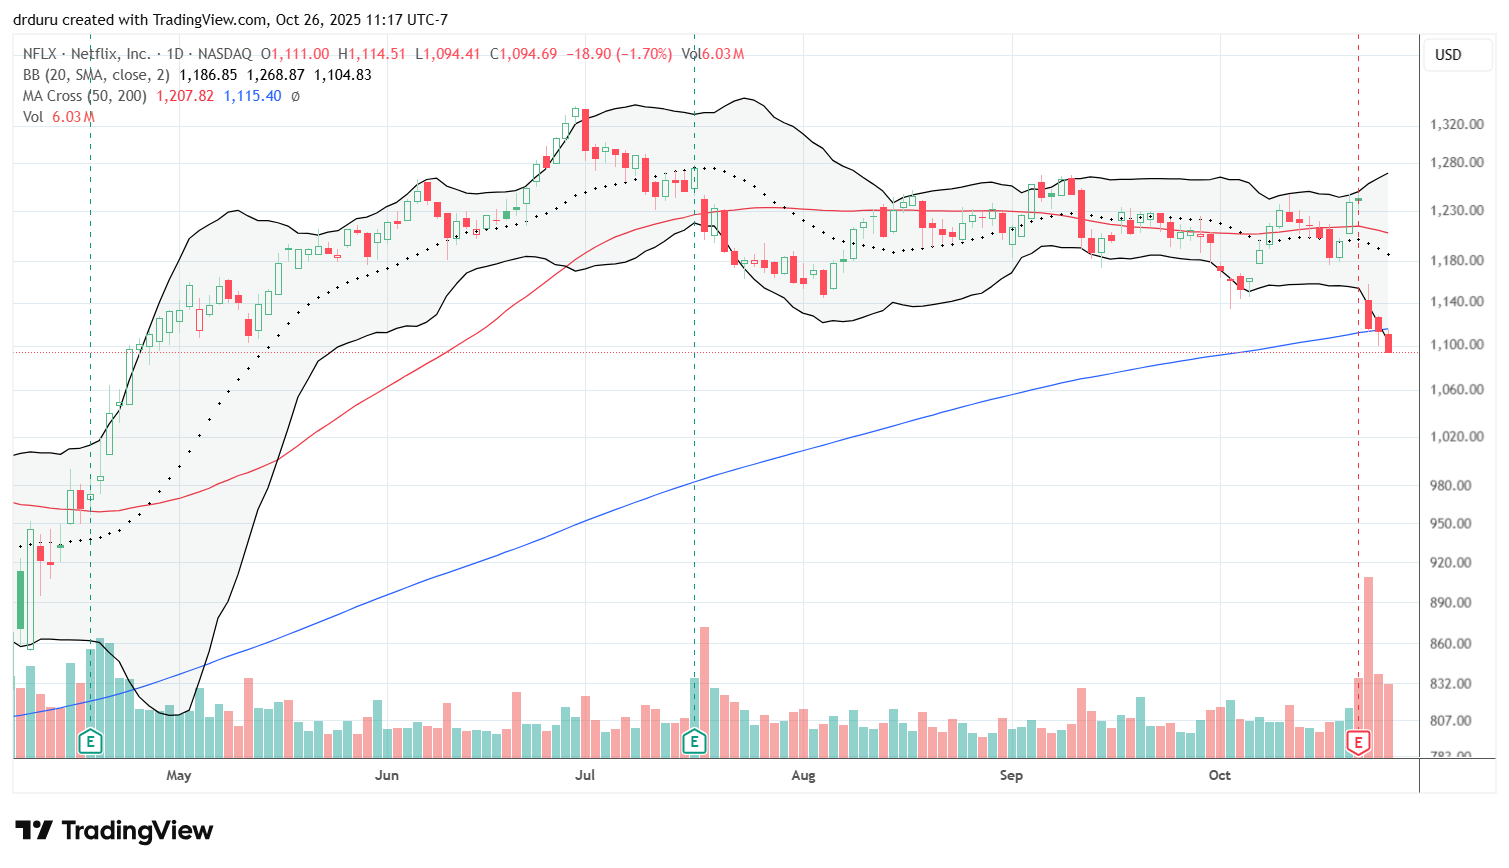
Netflix, Inc (NFLX)
Description: Provides streaming entertainment services globally.
Technical status: NFLX dropped 10% post-earnings, breaking below its 200DMA for the first time in two years.
Trade commentary: NFLX is suddenly in bearish territory with a 6-month low. I put the stock on my (shrinking) list of potential shorts. Any short will be on a tight leash with a stop on a close above 200DMA resistance.
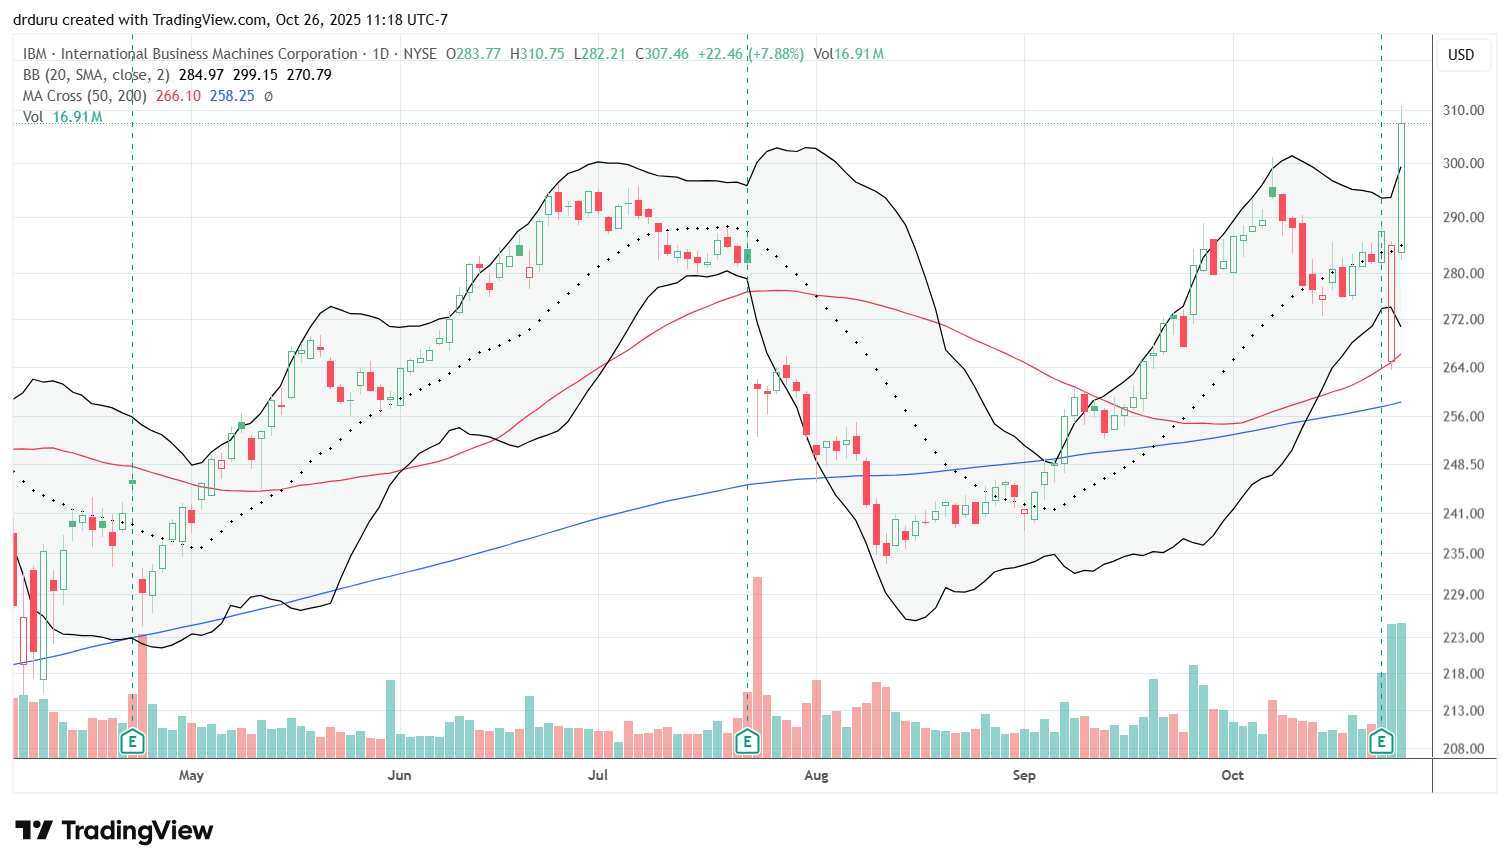
International Business Machines Corporation (IBM)
Description: Provides IT consulting, software, and infrastructure solutions globally.
Technical status: IBM’s post-earnings drop reversed immediately at 50DMA support in picture-perfect form, forming the launchpad for an 8% surge to a new all-time high.
Trade commentary: I am bullish on IBM yet somehow missed the impressive post-earnings reversal. The drop was a surprise given IBM beat expectations and delivered increased guidance. Apparently, sellers looked at RedHat weakness as an excuse to panic. IBM remains a buy-the-dips stock, and I am eagerly looking for the next dip from here. Side note: IBM’s claim that its quantum computing technology works with cheap AMD chips is a big addition for my case for AMD.
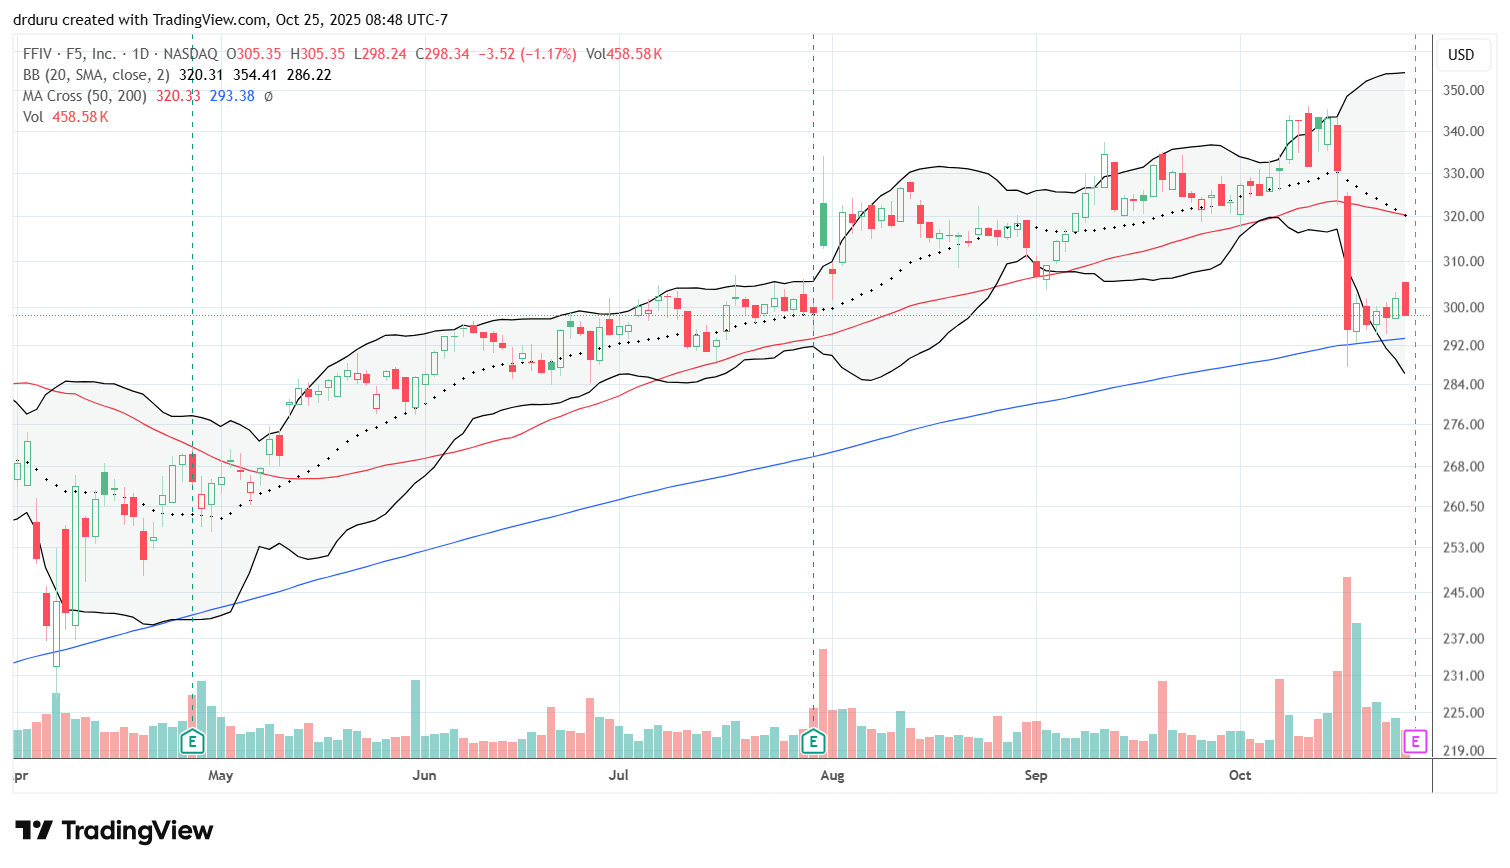
F5 (FFIV)
Description: Provides multi-cloud application security and delivery solutions.
Technical status: After revealing a major security breach, FFIV plunged 10.7%. Yet sellers “magically” stopped at 200DMA support.
Trade commentary: I am a big proponent and fan of technicals to explain price action and to setup trades. Yet, episodes like FFIV never cease to amaze me. I find it hard to believe that the implications of the “fundamentals” of the F5 breach end magically at 200DMA support. F5 even hung close to this support as it drift higher in subsequent trading days. I strongly suspect FFIV will see additional weakness after its earnings on October 27. Only a combination of low liquidity and exceptionally high premiums will keep me from buying a pre-earnings put spread.
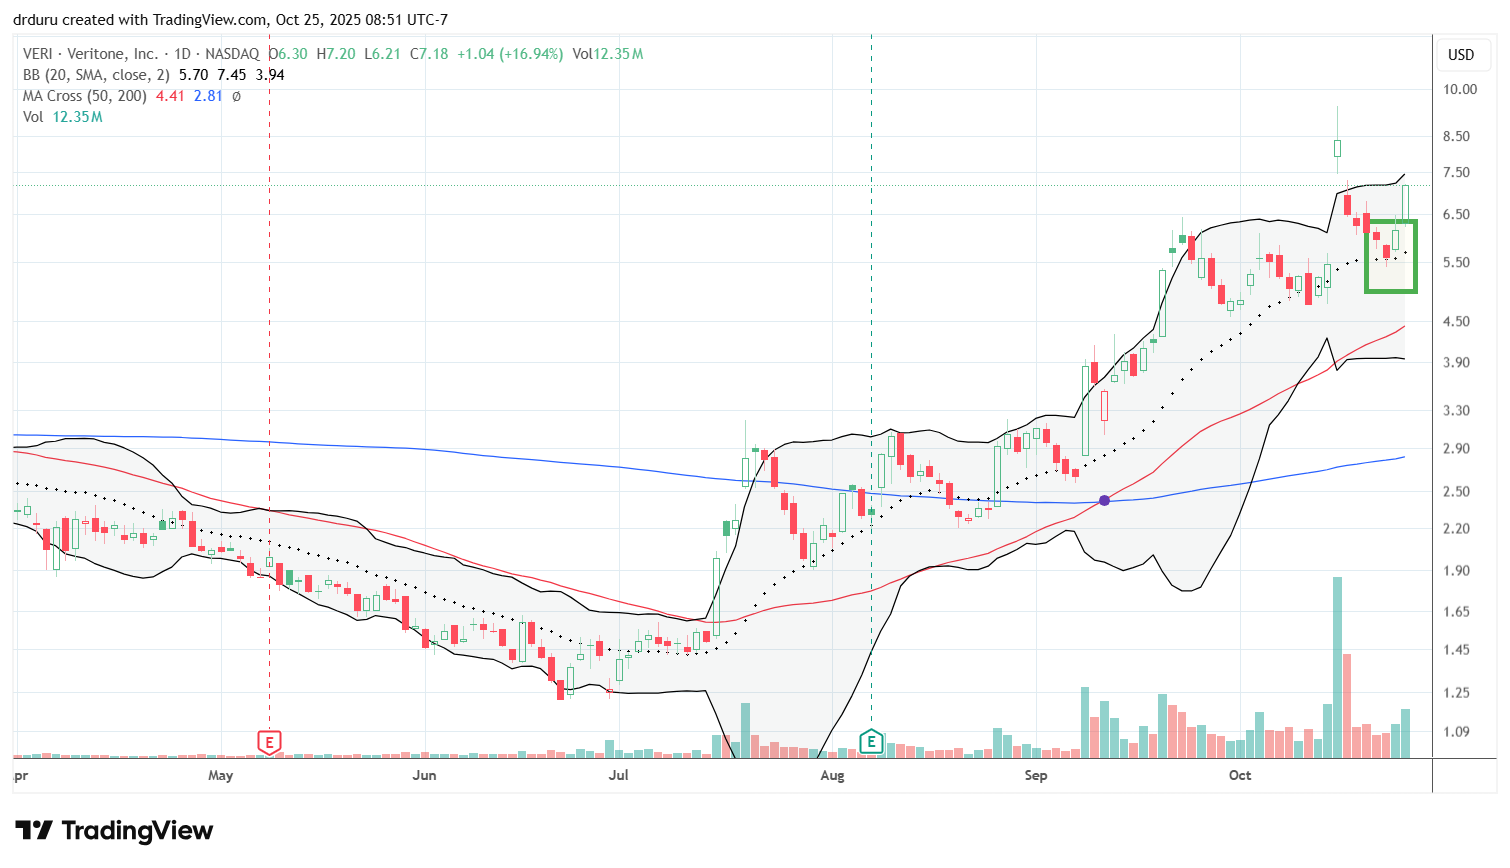
Veritone (VERI)
Description: Develops AI software and infrastructure solutions for media and government clients.
Technical status: VERI soared 54% on a hyperscaler deal, then dropped 22.5% after announcing an equity offering. Selling in the stock stopped cold and in picture-perfect form at 20DMA support.
Trade commentary: While the buying setup at 20DMA support tempted me, I passed due to “fundamentals” as explained in “Veritone Is Up 50% – It’s Not A Meme Stock, But An AI-Related Rally.” The company increased guidance after announcing the hyperscaler deal, but the equity raise the day after the 54% surge may have improved the ugly balance sheet. This potential apparently did not occur to traders and investors until the stock tested 20DMA support. I also neglected to trigger my rules for trading secondary offerings when VERI closed above its $5.83 offering price on Thursday. VERI soared 16.9% on Friday and now looks ready to challenge the abandoned baby top created by the gap up on the hyperscaler news and the gap down from the equity raise.
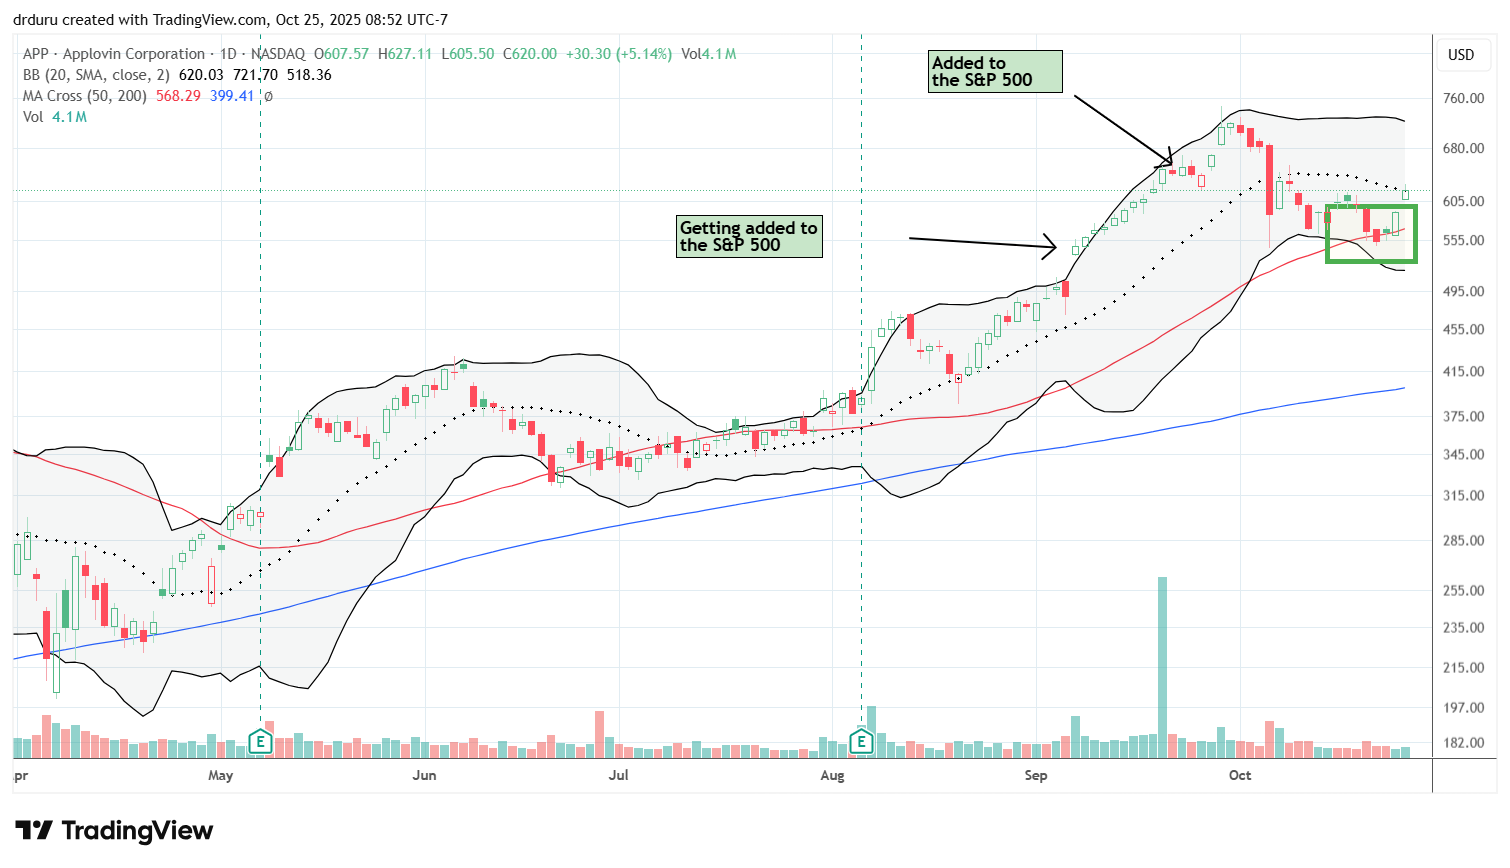
AppLovin (APP)
Description: Develops mobile app discovery and marketing software.
Technical status: APP plunged as much as 20% on a short-seller report. Follow-through selling stopped cold right at 50DMA support. The rebound stopped for the week at 20DMA resistance.
Trade commentary: I purposely passed on trading APP as a play on 50DMA support. I did not like the prices on options and did not want to buy shares given what I see as the potential for the stock to blow through stops at any point for any reason.
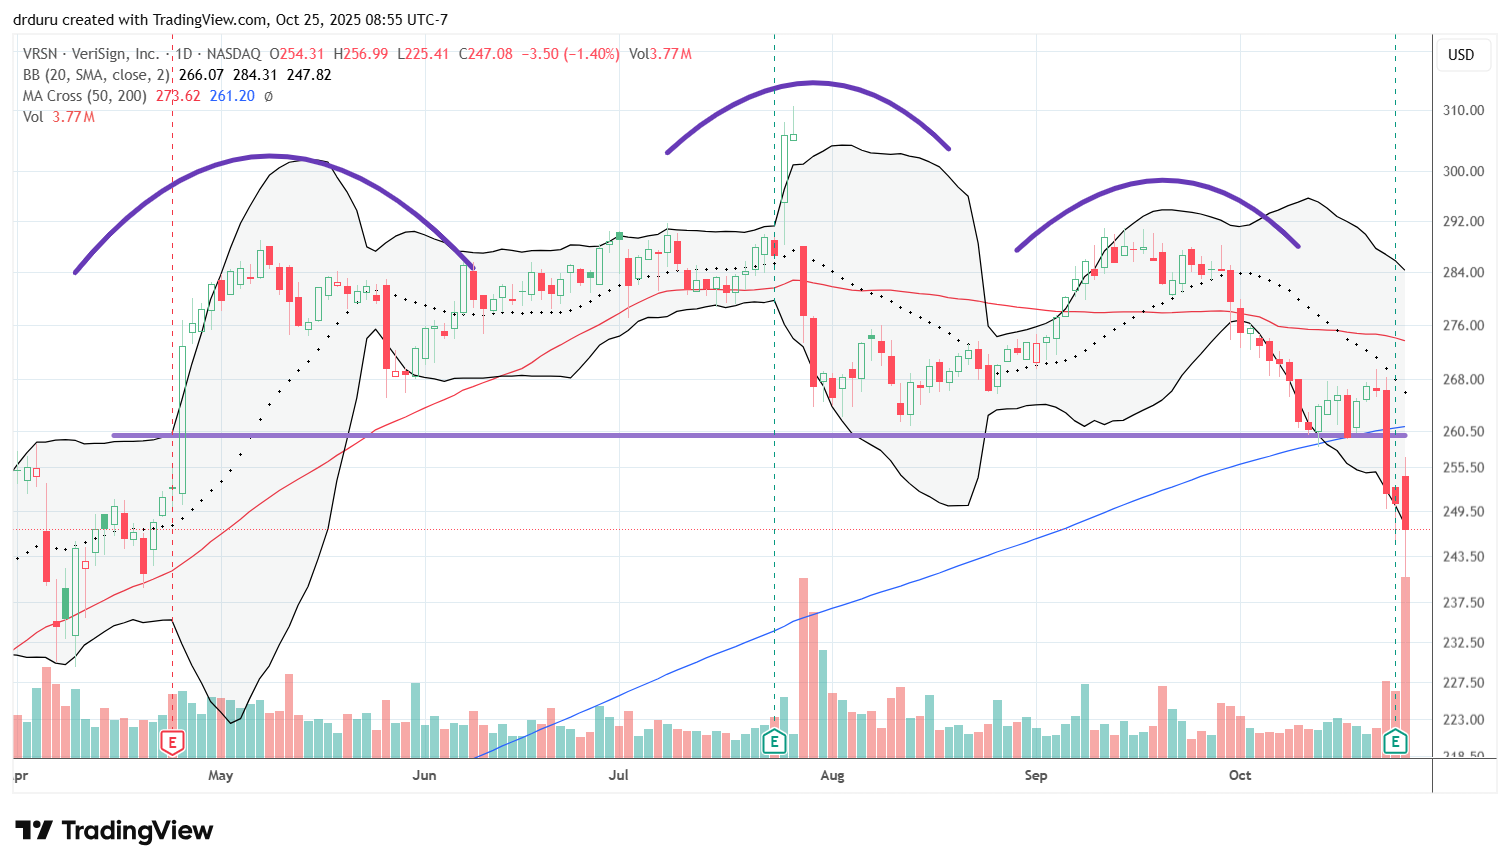
VeriSign (VRSN)
Description: Provides domain name registry services and internet infrastructure.
Technical status: VeriSign confirmed a head and shoulders top with a confirmed 200DMA breakdown following pre and post-earnings weakness.
Trade commentary: I could not find any news to explain VRSN slice through 200DMA support. Absent a counter-revelation, the stock is in bearish position and on my short list.
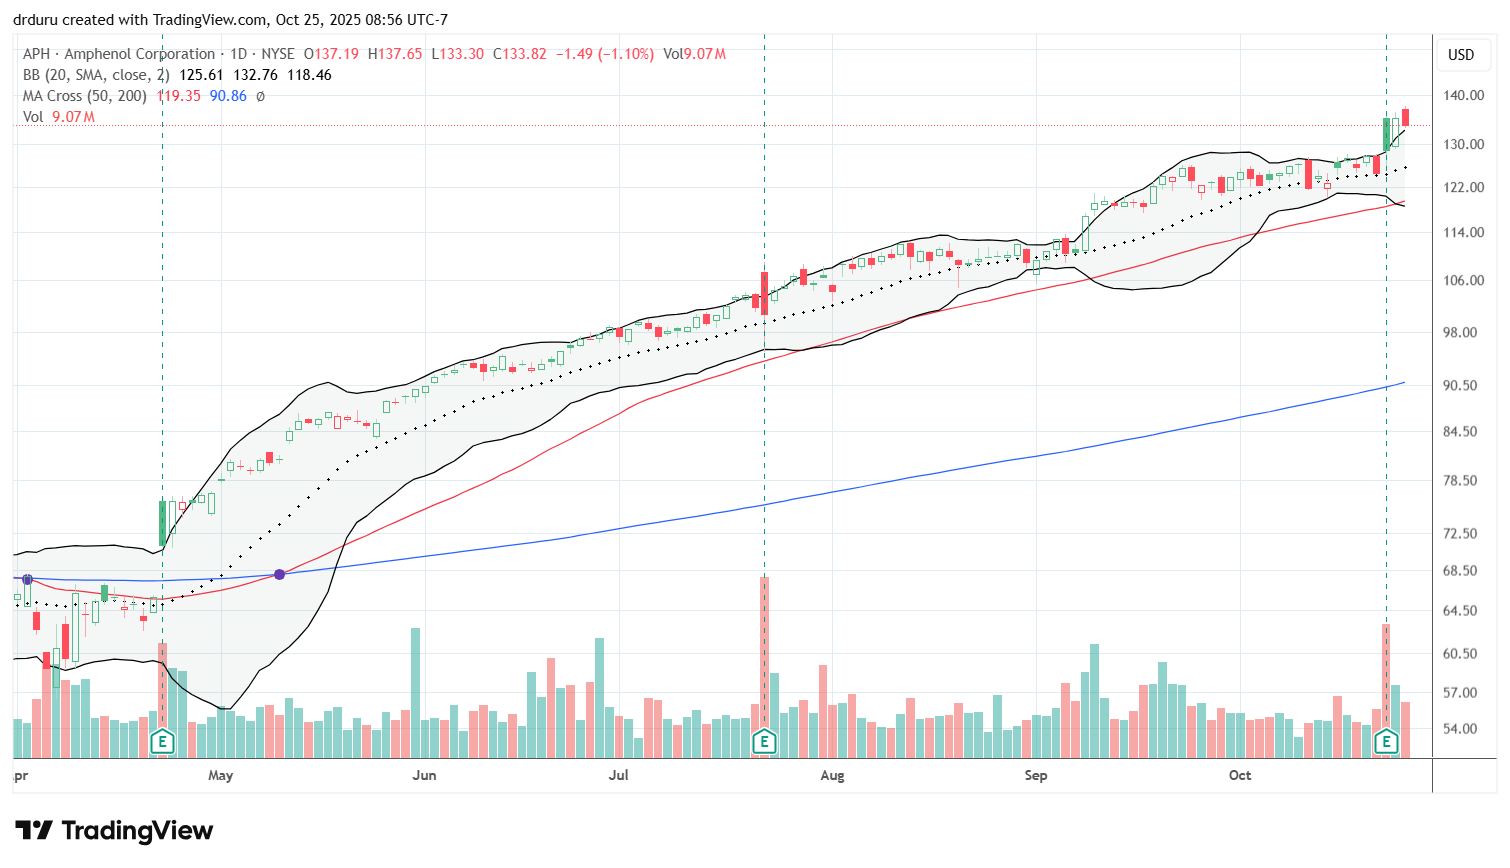
Amphenol Corporation (APH)
Description: Manufactures electronic and fiber-optic connectors and components.
Technical status: APH gapped up post-earnings and faded slightly to a 3.6% gain on the day. Buyers returned with force the next day and sent the stock right back to its post-earnings intraday high. APH ended the week with a 1.1% loss.
Trade commentary: This stock is a long-term winner (link goes to a monthly chart) with AI needs providing a fresh catalyst for the company. APH’s uptrend accelerated coming out of April earnings with an 8.2% post-earnings pop. I am still figuring out an accumulation strategy; I was hoping earnings would deliver a big dip to buy as part of a no regret trade.
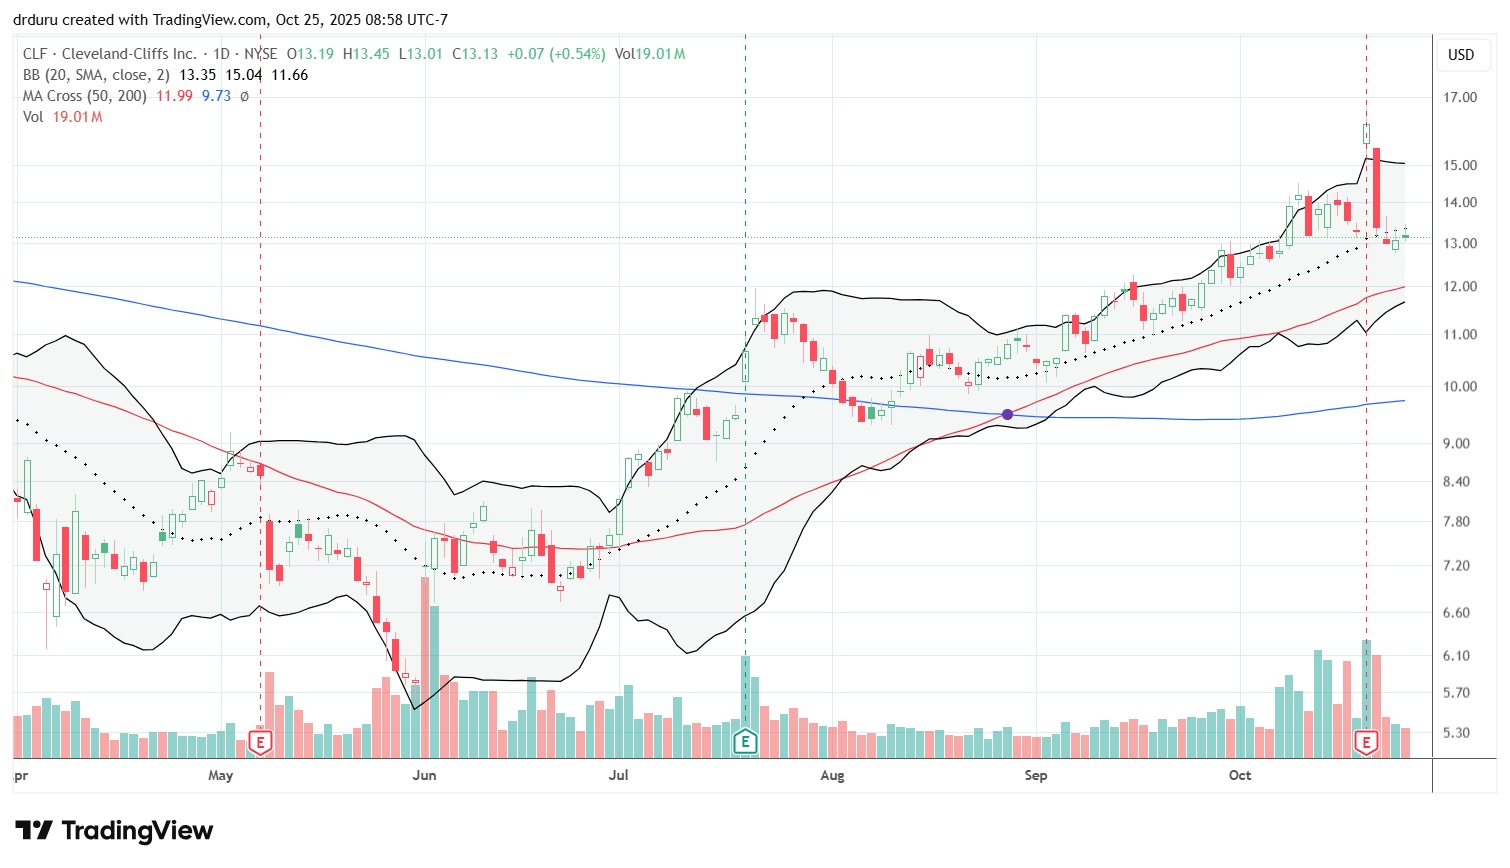
Cleveland-Cliffs Inc (CLF)
Description: Produces iron ore and steel products in North America.
Technical status: Cleveland-Cliffs jumped 21.5% post-earnings as the company’s timely rare earth plans brought the company the company big attention. Skeptics quickly reversed all the gains the very next day with CLF now clinging close to 20DMA support/resistance.
Trade commentary: The wicked reversal for CLF makes the stock vulnerable to follow-through and confirming selling. I do not want to short CLF, but if buyers return here around 20DMA support/resistance, I will join them.
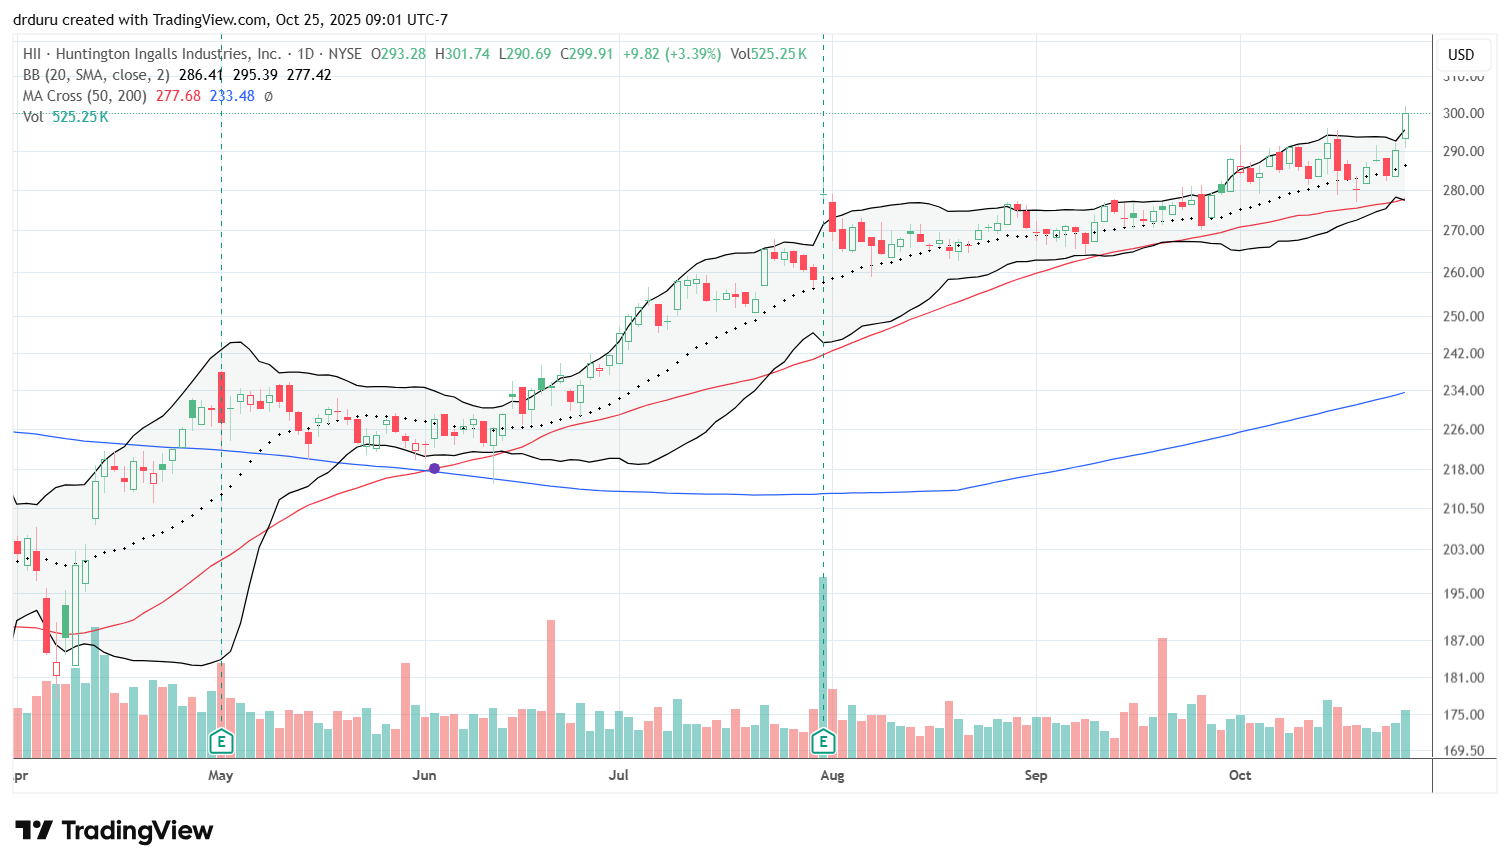
Huntington Ingalls Industries (HII)
Description: Designs and builds military ships for the U.S. Navy and Coast Guard.
Technical status: HII broke out of a near 8-year trading range to a new all-time high.
Trade commentary: I put HII on my long-term buy list. Last February, the U.S. Naval Institute published an article titled “The Next Great Era in U.S. Shipbuilding“, making the case for ramping up U.S. production of ships. In April, The general Accounting Office (GAO) published a report criticizing the U.S.’s inability to keep up with the Navy’s needs. Incredibly, “despite nearly doubling its shipbuilding budget over the last 2 decades, the U.S. Navy hasn’t increased its number of ships.” A quick Google search shows a LOT of attention and spotlights on the U.S.’s shortfalls in this industry. An investment in HII is a bet that these issues will get addressed and generate a ramp in business for Huntington Ingalls. Hopefully, Friday’s historic breakout is an early signal of positive changes afoot.
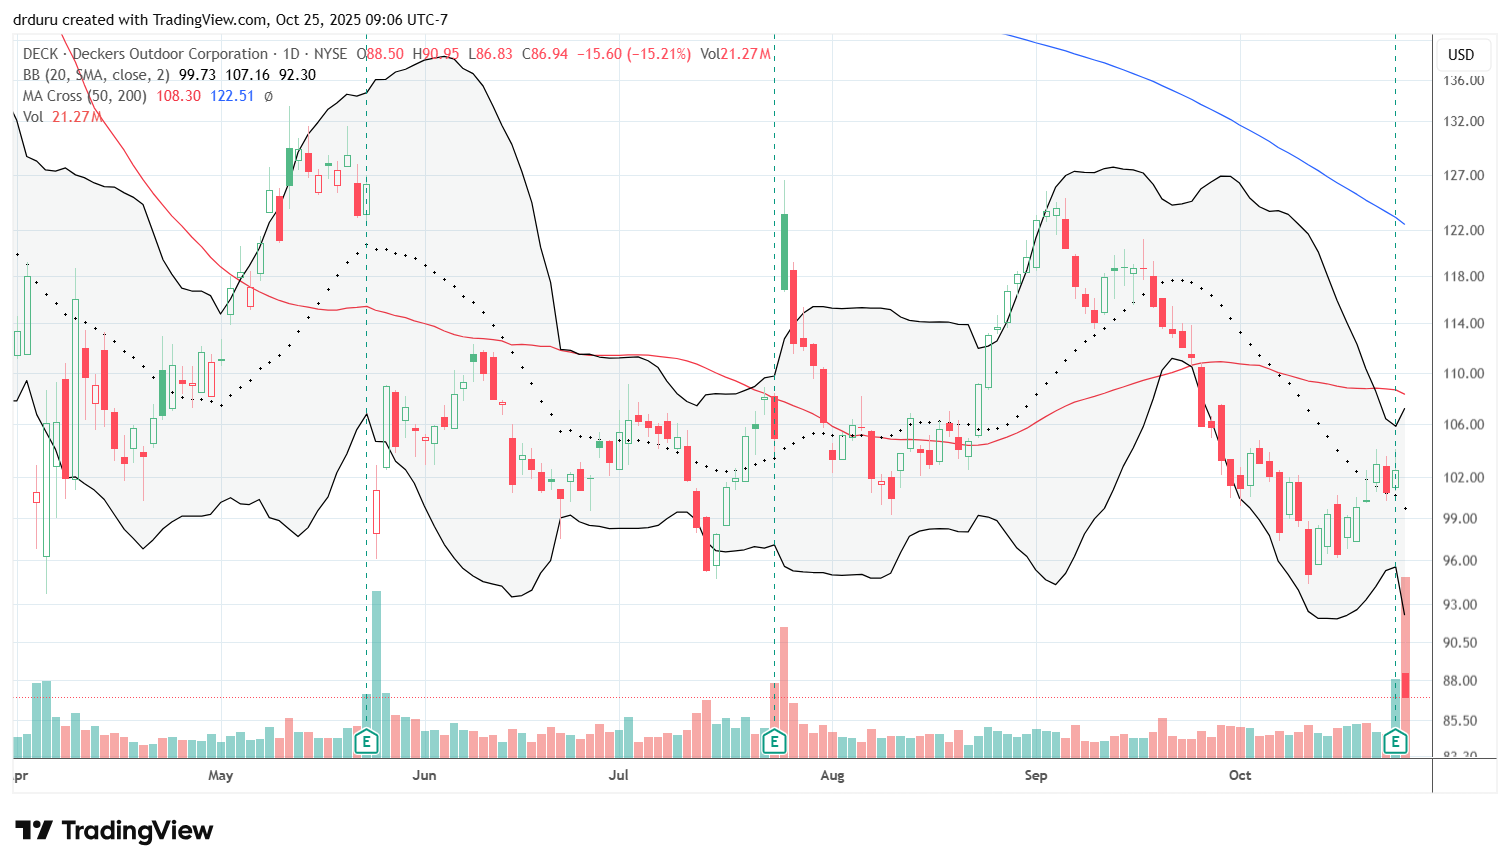
Deckers Outdoor (DECK)
Description: Designs and markets footwear and apparel under brands like UGG and HOKA.
Technical status: DECK fell 15% post-earnings and closed at a 2-year low, continuing a long bearish trend below its 200DMA.
Trade commentary: The stock has reversed all of its prior gains starting with a post-earnings pop two years ago. This weakness is part of a group of stragglers in consumer-facing stocks that are helping to drag on market breadth.
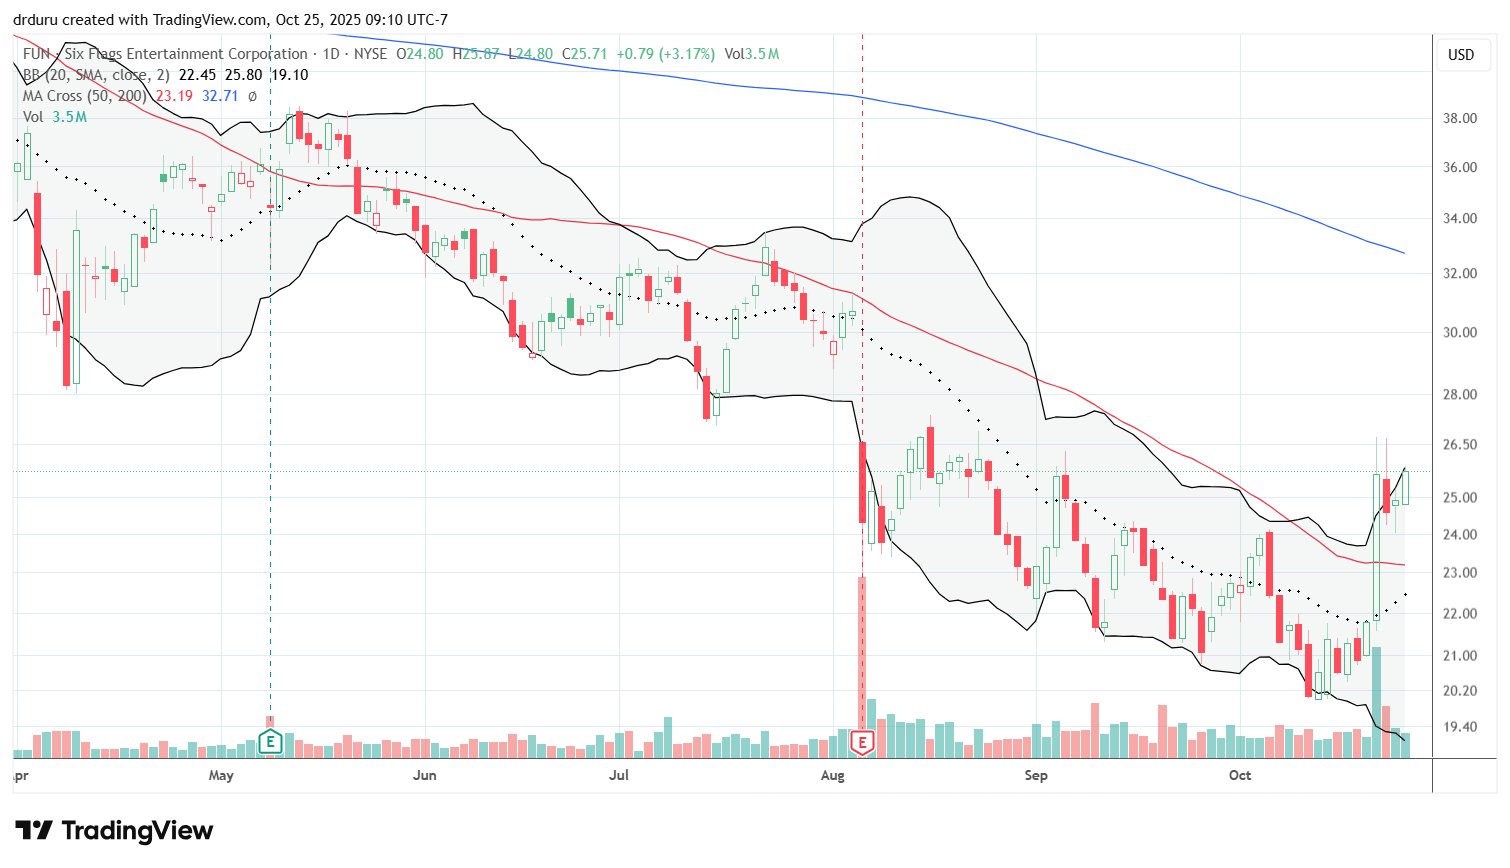
Six Flags Entertainment (FUN)
Description: Operates regional theme parks and water parks across North America.
Technical status: Six Flags jumped 17.7%, breaking out above its 50DMA and signaling a potential bearish and to bullish turnaround.
Trade commentary: The Wall Street Journal reported on July 21 that Jana Partners and NFL player Travis Kelce (Kansas City Chiefs tight end now engaged to mega pop star Taylor Swift) took a combined stake of 9% in FUN. This development is very positive for the company given its deep financial troubles. Still, I am going to wait for the stock to form a a strong base before considering joining Jana and Kelce. Before this news, FUN looked set to return to pandemic era lows.
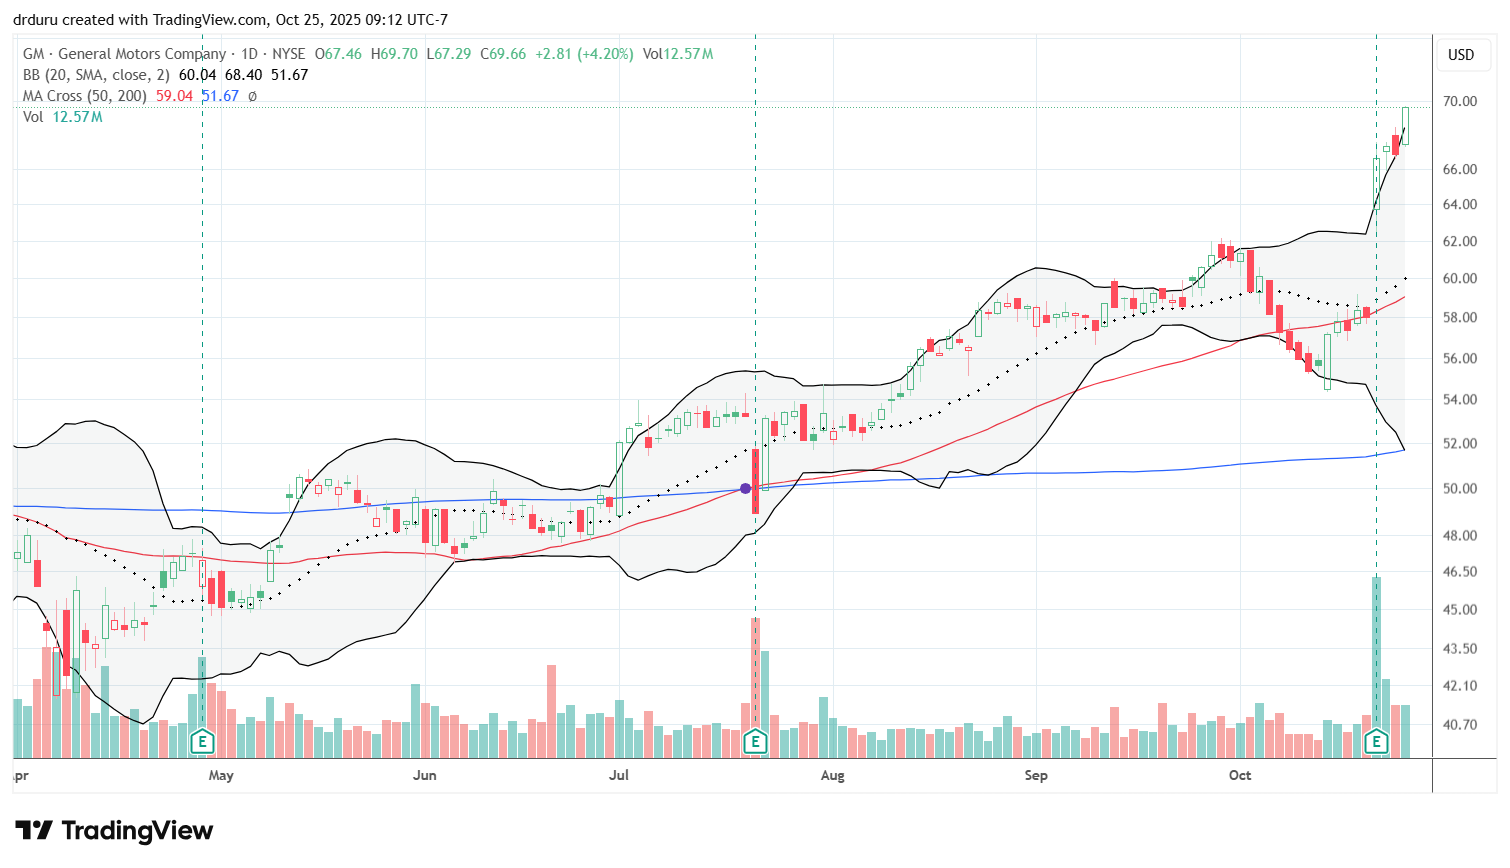
General Motors (GM)
Description: Manufactures automobiles and provides financing services worldwide.
Technical status: GM surged 14.9% post-earnings and continued higher to new all-time highs.
Trade commentary: At least GM is one consumer-facing stock that is int he winner column. I took profits on a GM position some time ago. If not for a fistful of AI stocks, I would have tried to find room in the portfolio for a buy-the-dip strategy in GM given this breakout.
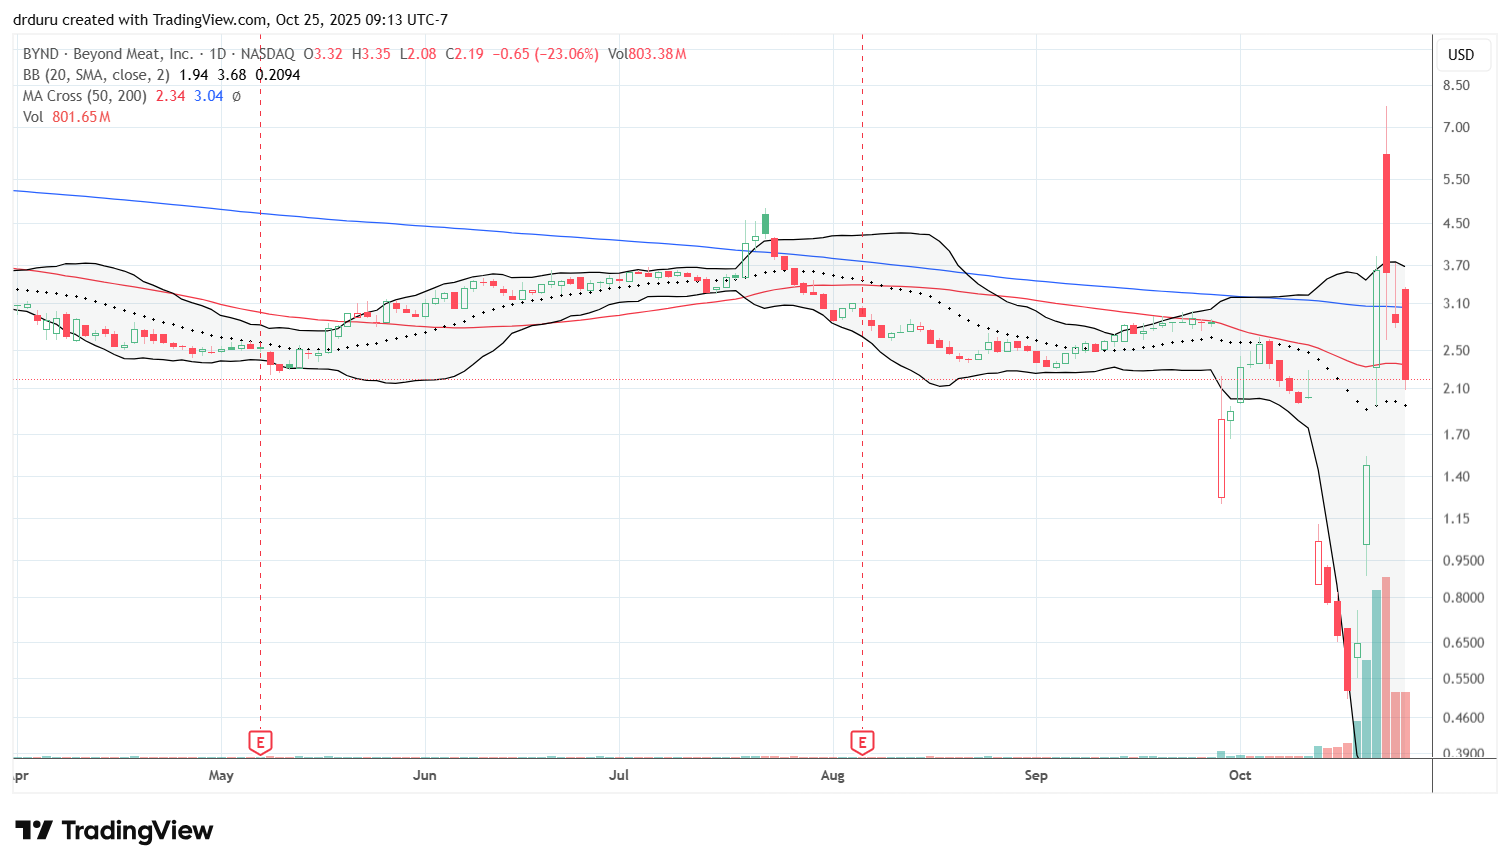
Beyond Meat (BYND)
Description: Produces plant-based meat alternatives.
Technical status: Beyond Meat collapsed toward bankruptcy levels, then skyrocketed more than tenfold before retreating.
Trade commentary: Three weeks ago, I observed BYND’s near-death experience and cautioned that “BYND remains bearish until and unless it can confirm a 200DMA breakout.” The stock promptly failed at 50DMA resistance and collapsed all over again to new all-time lows on a financial engineering regarding convertible notes. The stock started last week with 128% surge on no news that I can find. Ditto on the 146% gain the next day that printed a 200DMA breakout. Even if BYND confirmed the breakout with a higher close, I was not interested in chasing the stock given the wild swings in place on little to no news. Wednesday’s fade from $7.69 on a day with a low of $2.64 is quite telling. BYND captured the interest of wild speculators and is a definite no touch in the middle of this storm – just a stock to watch in amazement.
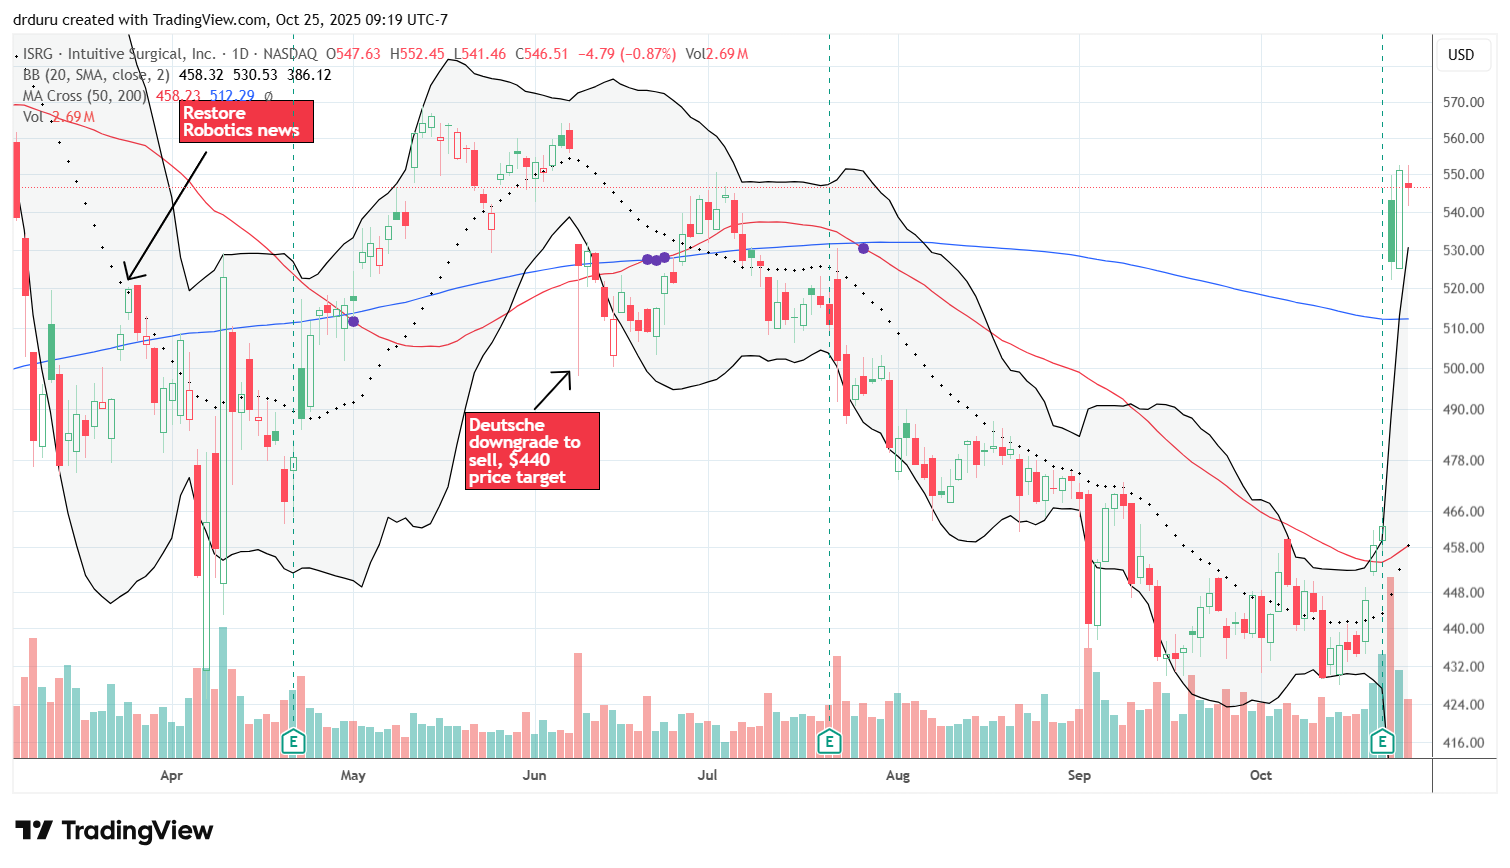
Intuitive Surgical (ISRG)
Description: Develops robotic-assisted surgical systems.
Technical status: Intuitive Surgical jumped 13.9% post-earnings, reclaiming its 200DMA and entering bullish territory.
Trade commentary: When ISRG slipped to a14-month low in September, I breathed a sigh of relief about my exit the previous month. The stock came back with a vengeance last week with a 200DMA breakout and a 13.9% post-earnings breakout. Now despite my earlier concerns, I am looking to reaccumulate shares.
Be careful out there!
Footnotes
Subscribe for free to get email notifications of future posts!
“Above the 50” (AT50) uses the percentage of stocks trading above their respective 50-day moving averages (DMAs) to measure breadth in the stock market. Breadth defines the distribution of participation in a rally or sell-off. As a result, AT50 identifies extremes in market sentiment that are likely to reverse. Above the 50 is my alternative name for “MMFI” which is a symbol TradingView.com and other chart vendors use for this breadth indicator. Learn more about AT50 on my Market Breadth Resource Page. AT200, or MMTH, measures the percentage of stocks trading above their respective 200DMAs.
Active AT50 (MMFI) periods: Day #92 over 20%, Day #90 over 30%, Day #10 over 40%, Day #1 over 50% (overperiod), Day #23 under 60% (underperiod), Day #65 under 70%
Source for charts unless otherwise noted: TradingView.com
Full disclosure: long IWM shares, long SPY put spreads
FOLLOW Dr. Duru’s commentary on financial markets via StockTwits, BlueSky, and even Instagram!
*Charting notes: Stock prices are not adjusted for dividends. Candlestick charts use hollow bodies: open candles indicate a close higher than the open, filled candles indicate an open higher than the close.
* Blog notes: this blog was written based on the heavily edited transcript of the following video that includes a live review of the stock charts featured in this post. I used ChatGPT to process the transcript.