

Stock Market Commentary
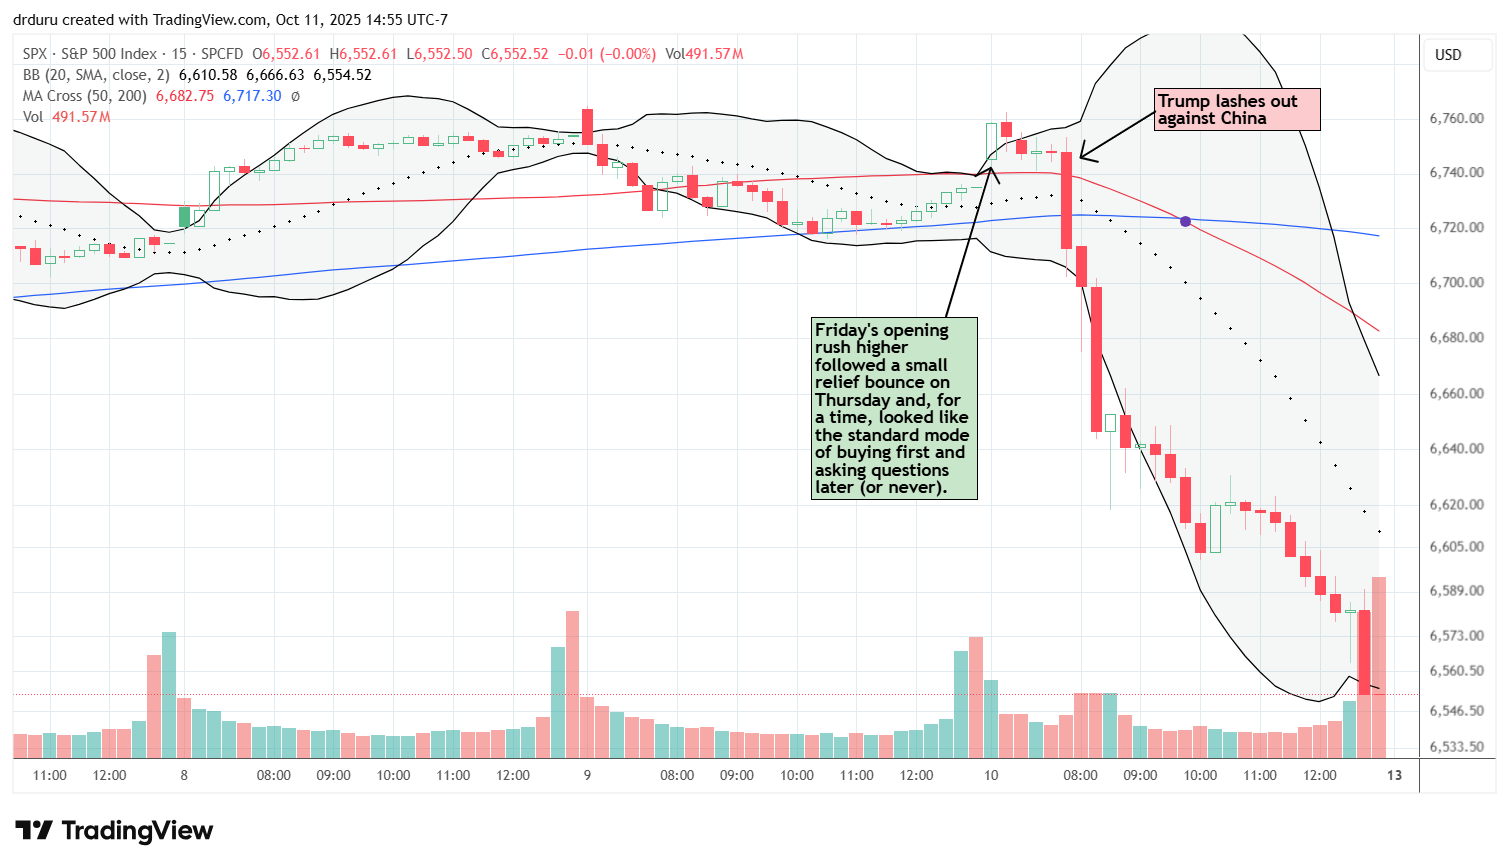
China and the U.S. have an unstable relationship. Each country needs the other and yet they cannot co-exist peacefully in the global economic or political sphere, especially when nativist flames and security alarms are burning brightly. That lingering instability came to prominence one more time after trade negotiations broke down (yet again) between the economic powerhouses. What on the surface seemed like a multi-month detente exploded into a war of words and policy. When China implemented new export restrictions on rare earths on Thursday (October 9), the stock market barely budged. The melt-up clearly dulled the senses (and mine!) with the S&P 500 losing just 0.3% and the NASDAQ bouncing from an intraday low to close nearly flat. The President’s response the following day triggered the anguish that caused a month’s worth of gains from the melt-up to vanish in a flash.
In the morning, Trump his irritation on Truth Social, calling China “hostile” and threatening more substantial tariffs. The President caught the stock market in the middle of a well-rehearsed return to melt-up mode, ignoring any and all risks. The S&P 500 opened higher in the first 15 minutes with a 0.4% gain. Sellers tentatively took price back to the open. Trump’s post emboldened the sellers and the stock market slid nearly non-stop from there.
The subsequent carnage created a kind of “October surprise” that is only remarkable because of the high level of complacency that preceded the dramatic selling. As I noted a week ago, the volatility index (VIX) was warning about an imminent surge in fear. I also suggested that it was impossible to bet on the exact timing of this surge given the market’s blissful melt-up behavior; I tried to guess at a potential catalyst:
“This week’s key reason for caution comes courtesy of the volatility index (VIX). The VIX has a bottoming pattern as it hugs ever more closely to its level from right before the tariff drama, trauma, and noise. In other words, volatility looks ready for another surge. Given October is the last of the stock market’s most dangerous months of the year, one more VIX pop seems both appropriate and timely. Yet, a convincing catalyst remains elusive. Perhaps some signal actually emerges that suggests this latest government shutdown could get worse than the last one.”
")
I drew the purple “bowl” shape to further highlight the upward pressure on the VIX.
Now, with Trump setting a November 1st, or earlier, deadline to implement a retaliatory additional 100% tariff on China, financial markets need to completely reorient toward risk away from complacency. The after hours announcement sent stocks even lower, setting up the potential for a rough open on Monday without counteracting news. This abrupt adjustment in sentiment creates the classic October pullback that typically generates an opportune buying opportunity ahead of the seasonally strong November to April/May time period for the stock market. In other words traders and investors must hold two conflicting ideas:
- This sell-off could get a lot worse until China and the U.S. stand down (again). Note the S&P 500’s 2.0% drawback for the month is at the median maximum drawdown for October but below the average maximum drawdown of 3%.
- This selling is a buying opportunity with market breadth accelerating toward oversold conditions and March/April’s tariff drama, trauma, and noise a potential reminder of the cost of selling in a tariff panic.
The Stock Market Indices
S&P 500 (SPY)
The S&P 500 (SPY) dropped 2.7% on the day and closed at a 1-month low. In an instant one month of melt-up gains vanished. The index made an all-time high just two days prior and nearly tagged support at its 50-day moving average (DMA) (the red line). The S&P 500 has yet to “properly” test this support since its breakout in May. This sell-off is significant given the last one-day pullback larger than this one was on April 10th when the index briefly cooled from the previous day’s monster 9.5% gain. That astonishing rally came on the heels of the U.S. blinking on tariffs. The next blink should also generate a sharp upside move.
Typically at this point I look forward to a Monday gap down (a Monday open much lower than Friday’s close) to wash out remaining motivated sellers. Yet, instead, traders seem to prefer getting ahead of the bounce (surely everyone remembers April’s rebounds). However, unless the news flow suddenly flips positive, I will consider such an immediate bounce to represent fool’s gold.
")
NASDAQ (COMPQX)
The NASDAQ traded similarly to the S&P 500. The tech-laden index collapsed 3.6% and approached its 50DMA support after printing an all-time high just two days prior. Unlike the S&P 500, the NASDAQ did has achieved a picture-perfect test of 50DMA support since the May breakout. While odds favor an imminent repeat test of that support, I bought call options on QQQ to take fortuitous profits on a Monday morning bounce, or a rally into the end of the week.
")
iShares Russell 2000 ETF (IWM)
IWM dropped roughly 3.3% on the day. Like the other two major indices, this ETF of small caps vanished a month’s worth of gains. However, IWM has churned a lot more and is not technically in melt-up mode.
I bought a fresh tranche of IWM call options as part of my regular routine to trade around my core position in IWM shares.
")
The Short-Term Trading Call With Melt-Up Vanished
- AT50 (MMFI) = 39.0% of stocks are trading above their respective 50-day moving averages
- AT200 (MMTH) = 51.9% of stocks are trading above their respective 200-day moving averages
- Short-term Trading Call: neutral
AT50 (MMFI), the percentage of stocks trading above their respective 50DMAs, closed the week at 39%. I have been warning for over a month that market breadth was waning even as the indices ignored risks in its melt-up mode. This slow divergence from the overbought threshold at 70% is bearish per the AT50 trading rules.
While I flipped the short-term trading call to neutral as a precaution two months ago, I could not go all the way to bearish because the market trend is so heavily biased upward. Sure enough, the S&P 500 is still up 5.0% since then. A 50DMA breakdown will finally get me all the way to bearish but for only as long the S&P 500 trades below that important trendline and AT50 trades above the oversold threshold at 20%. Balancing these triggers and thresholds is part of the conflicting trading thoughts I referenced earlier. Of course, news flow can at any time force further strategic adjustments based on the responding technicals of the market.
AT200, the percentage of stocks trading above their respective 200DMAs, plunged to a 2-month low. During much of this time, this longer-term indicator of the health of market breadth was at highs for the year. Thus, Friday’s massive breakdown is a big strike against the market.
The Equities: Vanished
SPDR S&P Retail ETF (XRT)
Description: XRT is an exchange-traded fund that tracks a diversified basket of U.S. retail stocks.
Technical status: XRT flashed an early warning when it broke its 50DMA support on Tuesday. The ETF next bounced but failed right at 50DMA resistance. On Thursday, XRT confirmed the 50DMA breakdown. XRT made its last high almost a month ago. Friday’s 3.1% loss took KRT to a 2-month low.
Trade commentary: I had XRT on my watchlist precisely because retail sits close to the consumer. Friday’s chaos pulled my attention elsewhere even as the selling confirmed XRT’s bearish positioning. Now I am looking to fade XRT on a rebound to 50DMA resistance if I have not flipped bullish on the market thanks to a visit to oversold conditions.
")
Carvana Co. (CVNA)
Description: Carvana (CVNA) operates an online platform for buying and selling used vehicles and provides vehicle financing and delivery services.
Technical status: After a big post-earnings pop of 17.0%, including a strong fade from an intraday high, CVNA chopped around mostly sideways. CVNA joined the early warning crowd with a confirmed 50DMA breakdown on Thursday. Friday’s 8.6% loss took the stock to a three-month low and a confirmed topping pattern.
Trade commentary: I will not call an official top because CVNA has defied many premature obituaries. Yet, I have it on my list to fade on a test of 50DMA resistance unless I am bullish on the market at the time. In due time, I can see CVNA testing its June low along with a simultaneous test of 200DMA support (the blue line).
")
Brinker International (EAT)
Description: Brinker International (EAT) operates casual-dining restaurant brands including Olive Garden.
Technical status: EAT dropped 4.1% on Wednesday to a new low for the year, undercutting its prior closing low and confirming a double-top.
Trade commentary: I bought a put spread on the breakdown. Ironically, despite the market’s carnage, EAT did not join the selling. This resistance is doubly ironic because I did not chase any other early warning retail/consumer stocks! I still expect EAT to follow its 20DMA (the dotted line) in a steep downtrend. The 50DMA is also trending downward.
")
Nike (NKE)
Description: Nike (NKE) designs, develops, and markets athletic footwear, apparel, equipment, and accessories.
Technical status: NKE popped 6.4% after earnings, then stalled at 50DMA resistance; sellers took control for the next five of six sessions. The resumption in selling confirmed a 200DMA breakdown with another 4.2% loss on Friday.
Trade commentary: In September I warned about the dangers of ignoring extended downtrends in stocks using Carmax (KMX) as a cautionary tale and NKE as the next potential victim. So I was of course surprised to see the strong and positive response to earnings. The subsequent selling returns the stock to bearish positioning. NKE is now on a path to fill its post-earnings surge from June.
")
Abercrombie & Fitch (ANF)
Description: Abercrombie & Fitch (ANF) operates specialty retail apparel and accessories brands.
Technical status: After failing at its 50DMA with its 20DMA pressing from above, ANF slid steadily to a five-month low.
Trade commentary: ANF stalled out after an all-time high in June, 2024. The downtrend after that peak cut the stock by as much as 2/3. Yet, last month I eagerly watched the stock for a bullish 200DMA breakout. ANF instead failed right at 200DMA resistance and never looked back. Thus the stock remains in a bearish position.
")
Albemarle Corporation (ALB)
Description: Albemarle (ALB) produces specialty chemicals, including lithium, bromine, and catalysts.
Technical status: ALB recovered key support and broke out, but a sharp fade from an intraday high on Thursday followed by sell-through signals a (short-term?) top.
Trade commentary: ALB caught a modicum of attention after the U.S. government restructured a deal with Lithium Americas Corp (LAC) from a loan package to an investment. ALB eventually crawled its way to a new high but Thursday’s topping action motivated me to lock in profits. I am keeping my eye out for a deeper sell-off back to 50DMA or 200DMA support. I am of course glad I hung in there as just a month ago ALB seemed ready to suffer a major failure at converged 50DMA and 20DMA resistance.
")
Dell Technologies (DELL)
Description: Dell Technologies (DELL) provides hardware, software, and services across PCs, servers, storage, and infrastructure solutions.
Technical status: DELL enjoyed a powerful AI-driven breakout midweek, then pulled back abruptly into Friday’s selloff, leaving likely near-term buyer’s exhaustion.
Trade commentary: With market breadth continuing to waver, AI-related stocks were a major component of last week’s latest phase in the melt-up. DELL peaked with a major surge on Wednesday that approached the all-time high. I am assuming the subsequent fade signals an end to the current cycle of buying. As a core component in my AI portfolio, I plan to continue holding DELL in anticipation of eventual new all-time highs. (Any interest OpenAI?).
")
Vertiv Holdings (VRT)
Description: Vertiv Holdings (VRT) designs and services critical digital infrastructure and data-center power, cooling, and IT management solutions.
Technical status: VRT was up as much as 12% intraday before heavy selling erased the move. The stock essentially closed flat after its breakout to fresh all-time highs.
Trade commentary: VRT remains my favorite individual stock in the AI trade. While it was disappointing to see Friday’s sharp reversal from a 12% surge, I am taking encouragement from a flat close on an ugly day in the stock market. I highlighted VRT in a recent video making a case for the jobs of the future.
")
BHP Group (BHP)
Description: BHP Group (BHP) is a diversified resources company producing iron ore, copper, coal, nickel, and other commodities.
Technical status: BHP fell about 2.1% and looks short-term topped out inside a multi-year trading range.
Trade commentary: I have started to accumulate commodities on weakness. Major infrastructure and data center buildouts and spending will consume a whole host of commodities (thus making the tensions over rare earths of critical importance). I am surprised players like BHP are not trading much higher. BHP remains stuck in a 5-year trading range. At some point in the near future I expect a major breakout and a resumption of a recovery from a major trough in 2016.
Rio Tinto (RIO)
Description: Rio Tinto (RIO) is a global mining company producing iron ore, aluminum, copper, and other minerals.
Technical status: RIO dropped roughly 2.3% and closed just above at its rising 20DMA, holding a constructive near-term uptrend inside a 5-year trading range.
Trade commentary: I have started accumulating RIO for the same reasons I am buying into BHP. RIO’s long-term chart is actually worse than BHP. The stock trades at less than its all-time high in 2008 and still trades at prices seen in 2007. Thus, I am much more interested in loading up on future sell-offs than chasing rallies.
")
")
")
Be careful out there!
Footnotes
Subscribe for free to get email notifications of future posts!
“Above the 50” (AT50) uses the percentage of stocks trading above their respective 50-day moving averages (DMAs) to measure breadth in the stock market. Breadth defines the distribution of participation in a rally or sell-off. As a result, AT50 identifies extremes in market sentiment that are likely to reverse. Above the 50 is my alternative name for “MMFI” which is a symbol TradingView.com and other chart vendors use for this breadth indicator. Learn more about AT50 on my Market Breadth Resource Page. AT200, or MMTH, measures the percentage of stocks trading above their respective 200DMAs.
Active AT50 (MMFI) periods: Day #82 over 20%, Day #80 over 30% (overperiod), Day #1 under 40% (underperiod ending 74 days above 40%), Day #48 over 50%, Day #12 under 60%, Day #55 under 70%
Source for charts unless otherwise noted: TradingView.com
Full disclosure: long IWM shares and call options, long SPY put spreads, long QQQ call options, long DELL, long VRT, long BHP, long RIO, long EAT put spread
FOLLOW Dr. Duru’s commentary on financial markets via StockTwits, BlueSky, and even Instagram!
*Charting notes: Stock prices are not adjusted for dividends. Candlestick charts use hollow bodies: open candles indicate a close higher than the open, filled candles indicate an open higher than the close.
* Blog notes: this blog was written based on the heavily edited transcript of the following video that includes a live review of the stock charts featured in this post. I used ChatGPT to process the transcript.
TACO.
YEP!
Whats your take on MP
See my latest post. I prefer UURAF here and think REMX is a “safer” way to play MP. If you want to buy MP, try to wait for a pullback to 20DMA at $77 or even better the 50DMA at $72.