

Stock Market Commentary
The month of August featured three distinctly strong expansions of market breadth. The last expansion featured the largest single-day expansion I have ever seen. In between these episodes, the market showed signs of exhaustion. The latest exhaustion is centered on the AI trade. NVDA earnings slightly disappointed and included slowing revenue growth rates. The next day, Alibaba Group Holdings (BABA) reported earnings alongside news that the company is developing its own AI chip to replace exports banned by the U.S. Such a chip could reduce demand for NVDA and related suppliers as BABA, and others, make further advances. Finally, Marvell Technology (MRVL) and Dell Technologies (DELL) fell sharply post-earnings on Friday with questions about MRVL’s AI-related benefits and DELL tumbling despite promising AI server sales. These headlines and more provided the drag on sentiment that created the exhaustion in tech and big cap tech specifically.
Important inflation news was practically lost in the late summer haze of exhaustion. The Personal Consumption Expenditures (PCE) Index continued to trend higher and away from the Federal Reserve’s 2% target. For now, the market is largely ignoring the implications of cutting rates into the teeth of stubbornly high inflation. The rest of us should not be so nonchalant. For example, I hold a SPDR Gold Shares (GLD) call spread and a significant amount shares in the Goldman Sachs Access Inflation Protected USD Bond ETF (GTIP).
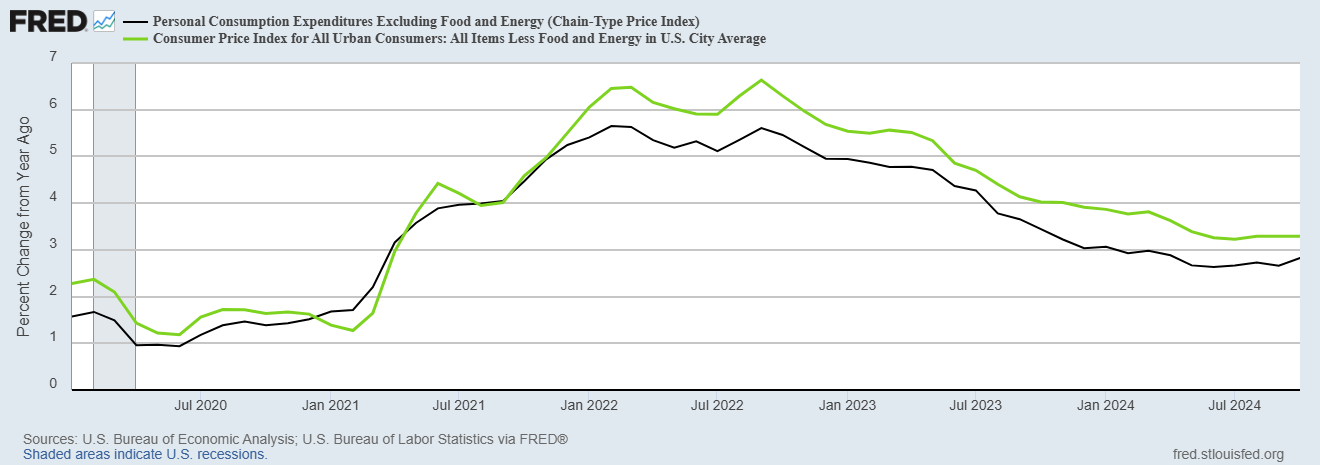
Sources: U.S. Bureau of Economic Analysis, Personal Consumption Expenditures Excluding Food and Energy (Chain-Type Price Index) [PCEPILFE], retrieved from FRED; U.S. Bureau of Labor Statistics, Consumer Price Index for All Urban Consumers: All Items Less Food and Energy in U.S. City Average [CPILFESL], retrieved from FRED, Federal Reserve Bank of St. Louis , September 1, 2025.
The Stock Market Indices
S&P 500 (SPY)
The S&P 500 (SPY managed to make an all-time high before succumbing to exhaustion on Friday with a small 0.6% loss. Overall, the index continues to hold support at its 20-day moving average (DMA) (the dotted line), so I am not worried about the S&P 500 just yet. The equal-weighted S&P 500 (RSP) looks even better.
")
NASDAQ (COMPQX)
The NASDAQ showed clearer signs of exhaustion thanks to the heavy trading in tech. The tech-laden index lost 1.2% before it was able to record a new all-time high. The NASDAQ closed right on top of uptrending 20DMA support. Thus, there are plenty of reasons to expect the uptrend to hold yet again….except September is the second of the stock market’s most dangerous months of the year.
")
iShares Russell 2000 ETF (IWM)
The iShares Russell 2000 ETF (IWM) managed to drift higher most of the week after a small hiccup on Monday. While Friday’s 0.4% loss closed the ETF of small caps at flat for the week, IWM remains in a strong uptrend far above its 20DMA uptrend. The ETF is also a curious exception to the exhaustion elsewhere in the market. IWM is even still trading around its highs for the year.
I dutifully bought a weekly IWM calendar call spread on Thursday. This position now just consists of the long side of weekly $249 call options after short $237 calls expired worthless.
")
The Short-Term Trading Call When Rally Reignites
- AT50 (MMFI) = 64.8% of stocks are trading above their respective 50-day moving averages (first overbought day)
- AT200 (MMTH) = 60.5% of stocks are trading above their respective 200-day moving averages
- Short-term Trading Call: neutral
AT50 (MMFI), the percentage of stocks trading above their respective 50DMAs, closed the week just under the overbought threshold (70%) and failed to follow-through on the prior week’s surge. The listless meandering for the week highlighted the exhaustion that appeared in the market. The action raises fresh specters of the three most dangerous months of the year. My neutral short-term trading call seems even more appropriate given the exhaustion in the market.
AT200, the percentage of stocks trading above their respective 200DMAs, fared a little better by drifting upward after a small setback on Monday. The pattern looks very similar to the price action in IWM as AT200 closed just under prices last seen in December, 2024. Bulls can definitely take encouragement from this longer-term indicator of market breadth.
The Equities: Exhaustion
Nvidia (NVDA)
Description: Nvidia designs and sells accelerated computing platforms spanning GPUs, networking, and software that power AI, data centers, gaming, and professional visualization.
Technical status: NVDA printed a “subtle” double top at its all-time highs with the 50DMA rising to provide support against a confirmation of the top. Post-earnings action produced three high-volume down days, and today’s 3.3% drop brought price closer to that 50DMA test.
Trade commentary: As I stated in the intro, NVDA was one of the big stories of the week given its earnings report. The stock closed down 0.8% after ranging widely between buying and selling pressures. Friday’s 3.3% loss solidified the double-top pattern made all the more ominous given the negative AI news flow. Perhaps most telling is the (inevitable) slowing growth rate for NVDA revenues…
Meta Platforms (META)
Description: Meta builds technologies for social connection, including Facebook, Instagram, WhatsApp, Messenger, and mixed-reality devices.
Technical status: Price drifted back into the prior all-time-high area after a “gap and crap.” Earnings popped shares 11%, but recent profit-taking brought the stock to a key convergence of prior resistance and 50DMA support.
Trade commentary: I am stalking a trade at this inflection point. A breakdown below the converged support would be bearish, and I would target puts or even a short. A strong rebound would be bullish, and I would chase with call options and/or shares.
Caterpillar (CAT)
Description: Caterpillar is a leading manufacturer of construction and mining equipment, diesel and natural gas engines, industrial gas turbines, and diesel-electric locomotives.
Technical status: CAT created a potential double top after breaking lower with a 3.7% drop tied to higher-than-expected tariff impact. That shock rippled through industrials and adjacent spaces and contributed to exhaustion in the stock market.
Trade commentary: I opened a put spread given the news seemed to finally justify going back to CAT as a hedge against other bullish trades. However, after the close, the U.S. Court of Appeals for the Federal Circuit ruled that most of President Trump’s tariffs are illegal. Thus, it is very possible most of Friday’s loss gets reversed even though the legal saga over tariffs is far from over.
")
CrowdStrike (CRWD)
Description: CrowdStrike provides an AI-native, cloud-delivered cybersecurity platform that protects endpoints, identities, data, and cloud workloads.
Technical status: Earnings whipsawed CRWD. The stock plunged as much as 7% after hours, opened the next day at 200DMA support, ripped to a 4.6% gain, then reversed 4.1% the next day. The 200DMA below and 50DMA above define the near-term battleground.
Trade commentary: I could not find a news driver for the two-day round-trip. A binary trade rule applies here: a breakdown below the 200DMA is (very) bearish; a breakout above the 50DMA is (very) bullish.
")
Duolingo (DUOL)
Description: Duolingo offers a mobile platform for language learning.
Technical status: DUOL confirmed its downtrend with a 7.7% high-volume drop and remains in a broader decline from the May all-time high. I am watching support around 289 and then 271. I could not find any news to explain the resumption of strong selling pressure.
Trade commentary: If support fails, I will assume DUOL has topped for the foreseeable future, like the end of a bubble. I have yet to determine a good risk/reward trade for DUOL, but I keep watching. I am particularly wary about shorting the stock (or buying puts) only to get caught in a sharp relief rally. Buying shares (or calls) here is almost as dangerous given the catalyst of fear over AI replacing the platform.
Ironically, there have been numerous options for AI language learning through the majority of DUOL’s rebound and rally to all-time highs earlier this year. Moreover, Duolingo is using generative AI to expand its offerings.
Etsy, Inc (ETSY)
Description: Etsy operates a global marketplace connecting buyers and sellers of unique and creative goods.
Technical status: After wild swings, ETSY is now testing 200DMA support, a critical line between wide-ranging churn and outright bearish territory.
Trade commentary: I bought call options assuming the 20DMA (the blue line) would hold as support. With some hindsight I can see that I should have flipped bearish after ETSY sliced right through 50DMA support with an 8.4% loss. I only recently realized that ETSY is falling because of the end of the de minimis rule which allowed for duty-free imports under $800. ETSY is a large marketplace of small scale retailers who now face higher costs that will likely reduce trade.
Elastic N.V. (ESTC)
Description: Elastic provides a search-powered platform for search, observability, and security built on Elasticsearch.
Technical status: ESTC gapped up roughly 15% at its post-earning open, just barely above its 200DMA. Sellers took over from there and pushed ESTC into 3.1% post-earnings loss and ugly gap and crap.
Trade commentary: I bought a speculative call spread because the headline earnings numbers did not explain the reversal to me. I had a bullish bias going into earnings, so I am predisposed to interpret this pullback as a buying opportunity.
")
Snowflake (SNOW)
Description: Snowflake provides the AI Data Cloud, a platform for data engineering, analytics, applications, and AI across multiple public clouds.
Technical status: Post-earnings, SNOW jumped roughly 20%, cleared its early-2024 high, and closed well above its upper Bollinger Band. Gains held on Friday.
Trade commentary: The post-earnings surge is bullish. Still, I am wary of the profit-taking dynamics I have noted here and in previous blog posts. I will likely buy into a post-earnings fade toward or to 50DMA support (the red line).
")
MongoDB (MDB)
Description: MongoDB develops a multi-cloud document database platform used for a wide range of applications.
Technical status: MDB soared 38% post-earnings on Wednesday and added 7.6% the next day before resting on Friday. Despite huge moves, the stock has essentially gone sideways for years.
Trade commentary: The back-to-back breakouts in MDB are encouraging, especially in the context of what I thought was a dying technical fad for NoSQL databases. I will just keep watching this one.
")
Phreesia (PHR)
Description: Phreesia provides software that automates patient intake and supports patient activation for healthcare organizations.
Technical status: As I anticipated back in March, PHR broke out above the top of its previous trading range. The stock now has strong momentum going into earnings this week.
Trade commentary: While I welcome the fresh momentum in PHR, I am a little wary of the near parabolic runup after the breakout. Clearly “someone” is anticipating big news. However, this kind of run-up can setup major disappointments and a sharp sell-off. If the news is indeed good, I will look for entry points to add to my shares.
Hormel Foods (HRL)
Description: Hormel Foods is a global branded food company that manufactures and markets a wide range of food products.
Technical status: The stock crashed 13.1% after earnings, plunging back to prices last seen around 2014–2015. On the weekly view, a long-term secular uptrend looks at risk of transitioning to a secular downtrend.
Trade commentary: It seems Hormel still has good top-line performance but increased input costs compressed margins. Declining margins are like death for a food business that already runs on thin margins. Thus, I expect HRL to trade poorly for quite some time. With a 4.5% dividend yield, the stock looks tempting. However, if I still held shares, I would actually sell here and wait for a recovery back into the prior trading range before reconsidering owning shares. This kind of risk management prevents clinging on to increasing losses during an extended secular downtrend.
")
Dollar General (DG)
Description: Dollar General operates neighborhood stores focused on affordable everyday essentials and convenience.
Technical status: After beating tariff scares, DG has gone nowhere for nearly three months. The stock now looks like it is topping out after a faded earnings gap and follow-through selling resulting in a 2.6% drop on Friday.
Trade commentary: I am assuming DG will be “dead money” for a while. I could get interested again on a test of 200DMA support. That kind of calamity is of course not in my expected range of potential outcomes.
Dollar Tree (DLTR)
Description: Dollar Tree is a North American value retailer offering consumables, variety, and seasonal merchandise.
Technical status: DLTR looks worse than DG. The stock dropped 3.0% on Friday and cracked 50DMA support. The move accentuates an unfolding downtrend from a 15-month high.
Trade commentary: DLTR shot upward like a rocket from the April tariff drama, trauma, and noise. The stock served as an early sign that the market was quickly moving past the tariff turmoil. Now, DLTR, like DG, is showing signs of exhaustion. With earnings coming up next week, DLTR looks particularly vulnerable to that exhaustion expanding into a major reversal of past gains.
")
Oracle (ORCL)
Description: Oracle provides cloud applications and infrastructure along with industry-leading database technologies.
Technical status: ORCL lost its 50DMA support after pivoting for 7 trading days. A downtrend is now unfolding from the same exhaustion engulfing big cap tech. Friday’s 5.9% loss took ORCL to a 2-month low.
Trade commentary: I want to be a long-term buyer if ORCL falls to its 200DMA, but I doubt the stock’s exhaustion will lead to such a deep calamity. Instead, I am watching to see whether ORCL’s descent stops at higher support like $215 where ORCL experienced its first post-earnings pause. Regardless, the bullish AI narrative took a hit last week, and NVDA’s topping will likely increase nervousness throughout the sector.
")
Five Below, Inc (FIVE)
Description: Five Below is a value retailer offering trend-right products for tweens, teens, and beyond.
Technical status: From the April lows, FIVE has been an absolute rocket, nearly a triple. The stock survived earnings last week with a 3.9% gain. However, profit-takers eliminated all the gains on Friday.
Trade commentary: FIVE’s exhaustion may lead to an extended period of price consolidation similar to the consolidation and slight upward drift that followed the positive reaction to the previous earnings. I am considering the potential for a trade at 50DMA support.
Best Buy (BBY)
Description: Best Buy is a specialty consumer electronics retailer focused on enriching lives with technology across stores, online, and in homes.
Technical status: BBY gapped above its 200DMA in response to earnings only to reverse sharply into a 3.7% post-earnings loss. An uptrending 20DMA could dampen further losses for now.
Trade commentary: The risk/reward is not compelling here. BBY looks more or less like dead money as it flails around in a range. I do not expect much more downside given the company maintained guidance. However, the sharp fade signals a kind of exhaustion. Overall, BBY has gone nowhere for over 3 years and was even trading at current prices from 2018 to 2020.
")
")
Be careful out there!
Footnotes
Subscribe for free to get email notifications of future posts!
“Above the 50” (AT50) uses the percentage of stocks trading above their respective 50-day moving averages (DMAs) to measure breadth in the stock market. Breadth defines the distribution of participation in a rally or sell-off. As a result, AT50 identifies extremes in market sentiment that are likely to reverse. Above the 50 is my alternative name for “MMFI” which is a symbol TradingView.com and other chart vendors use for this breadth indicator. Learn more about AT50 on my Market Breadth Resource Page. AT200, or MMTH, measures the percentage of stocks trading above their respective 200DMAs.
Active AT50 (MMFI) periods: Day #53 over 20%, Day #51 over 30%, Day #46 over 40%, Day #19 over 50%, Day #6 over 60% (overperiod), Day #26 under 70% (underperiod)
Source for charts unless otherwise noted: TradingView.com
Full disclosure: long IWM shares and call options, long GLD call spread, long PHR, long CAT put spread, long SPY put spreads, long DELL
FOLLOW Dr. Duru’s commentary on financial markets via StockTwits, BlueSky, and even Instagram!
*Charting notes: Stock prices are not adjusted for dividends. Candlestick charts use hollow bodies: open candles indicate a close higher than the open, filled candles indicate an open higher than the close.
* Blog notes: this blog was written based on the heavily edited transcript of the following video that includes a live review of the stock charts featured in this post. I used ChatGPT to process the transcript.