

Stock Market Commentary
Last week delivered one of the most bullish one-day expansions of market breadth I have ever seen. On Friday, August 22nd, Federal Reserve Chair Jerome Powell spoke at the Jackson Hole confab and gave financial markets sufficiently dovish signals to reignite a rally that had waned most of the week. Big cap tech wavered the most (perhaps due to talk about an AI bubble from Sam Altman, the godfather of today’s AI), yet the market’s celebration turned its attention to the market’s laggards as well as rate sensitive stocks. SwingTradeBot confirmed the fresh bullish momentum with technical scans showing overwhelmingly positive signals, no new lows, and advancers far outpacing decliners. Even the equal weighted S&P 500, Invesco S&P 500 Equal Weight ETF (RSP), jumped 2.0% to an all-time high. RSP is like the icing on the cake as the bull market rally reignites.
The volatility index (VIX) hit a new low for the year, one more confirmation of the reignited rally. The VIX collapsed 14.4% on Friday as the market celebrated Fed Chair Powell’s gift.
The Stock Market Indices
S&P 500 (SPY)
The S&P 500 gained 1.5% on Friday and notched a marginal new all-time high. The 20-day moving average (DMA) (the dotted line below) once again served as reliable support. The index now has runway for more upside with room underneath and beyond its upper Bollinger Band (BB).
")
NASDAQ (COMPQX)
The NASDAQ gained 1.9% on Friday, but its short-term trend is flat due to recent weakness in big-cap tech stocks. Thursday’s close below the 20DMA weighed on the tech-laden index. While Friday’s rebound was strong, the NASDAQ failed to challenge its all-time high.
")
iShares Russell 2000 ETF (IWM)
The iShares Russell 2000 ETF (IWM) stole the spotlight with an astounding 3.9% surge, reaching a new high for the year. The ETF of small-caps perfectly bounced off its 20DMA support, leaving both its 50DMA and 200DMA behind. IWM has finally turned the corner. However, just like last week, I left a lot of money on the table with my last round of IWM call options. I was sitting on expiring $230 strike calls and, ahead of Powell’s speech, I decided to roll them into expirations for this coming week. Early in the subsequent surge, I rushed to take profits. Just being patient with the expiring calls could have resulted in 4-5x the gains.
With IWM surging above its upper Bollinger Band, I decided to wait for the next dip before the next set of call options. I continue to hold my long-term core holding of shares in IWM.
")
The Short-Term Trading Call When Rally Reignites
- AT50 (MMFI) = 67.8% of stocks are trading above their respective 50-day moving averages (first overbought day)
- AT200 (MMTH) = 61.4% of stocks are trading above their respective 200-day moving averages
- Short-term Trading Call: neutral
AT50 (MMFI), the percentage of stocks trading above their respective 50DMAs, closed the week just under the overbought threshold (70%). The pace and magnitude of breadth expansion stunned me, as AT50 leapt 12 percentage points for a 22% gain. This pop was almost as powerful by itself as the 2-day moving the prior week that created a revival in bullish momentum. Friday was another version of what can happen when a rally reignites.
AT200, the percentage of stocks above their 200DMAs, jumped seven percentage points to 61.3%, its highest level since December. This surge added yet more validation of the bullish bias and reinforced the strength beneath the market’s surface. I can no longer be wary of a simmering bearish divergence between market breadth and the major indices.
Even with all these bullish confirmations and tailwinds, I am keeping my short-term trading call at neutral. I am both deferring to the stock market’s most dangerous months (we are almost through the first one of three), AND my creeping wariness of the fundamentals (I know, dangerous territory for swing trades). The Fed will be cutting rates because of looming weakness in the labor market. Meanwhile, inflation is creeping higher thanks to tariffs and lingering stickiness from the last economic cycle of inflation. I think this combination is economic toxin, but I am willing to go along with the market’s celebration as long as the technicals confirm the euphoria.
The Equities: Rally Reignites
iShares U.S. Home Construction ETF (ITB)
Description: The iShares U.S. Home Construction ETF tracks the performance of U.S. companies involved in homebuilding and related construction industries.
Technical status: ITB soared 5.3% to a new yearly high, breaking out to levels not seen since December. The bullish turn in homebuilders is now complete (no bearishness), with the sector firmly trending upward.
Trade commentary: I have been consistently bullish on homebuilder stocks during the bearish to bullish turn. Friday’s move validated my assessments. Despite weak housing data, the market is pricing in better days ahead with anticipated rate cuts. I consider these stocks solid buy-the-dip opportunities especially starting October when the seasonal strength for these stocks begins.
Caterpillar (CAT)
Description: Caterpillar is a global manufacturer of construction and mining equipment, engines, and industrial turbines.
Technical status: Caterpillar surged 4.3% and approached its all-time high. The chart is fully bullish with momentum supported by rate-cut expectations and a weaker dollar.
Trade commentary: I typically use CAT puts as a hedge on bullishness, but this is no time for hedging with CAT given its compelling bullishness. I expect further gains on a breakout to new all-time highs.
")
Target Corporation (TGT)
Description: Target Corporation is a U.S. retailer offering a wide assortment of general merchandise and food products.
Technical status: TGT dropped 6% after disappointing earnings, dropping below 50DMA support. However, it bounced sharply off its intraday low and held above lows for the year.
Trade commentary: Despite the earnings miss, I continue to hold TGT as a contrarian play. My shares are getting paid to wait with a 4% dividend yield. The stock remains in a sideways pattern for now. I rolled the short side of a calendar call spread at the $105 strike. It was interesting to see the position go from a small loss to flat despite the stock dropping. A lesson in the value of selling options premiums.
")
TJX Companies (TJX)
Description: TJX Companies operates off-price retail stores including T.J. Maxx, Marshalls, and HomeGoods.
Technical status: TJX gapped higher on earnings but faded into a 2.7% gain on the day. Despite a new all-time high, sellers weighed heavily, creating a gap-and-crap setup.
Trade commentary: While I admire TJX as a long-term retail winner, I remain cautious after the post-earnings fade. Sellers may attempt to close the gap given the persisting weakness the last two days. I am surprised TGT benefited from the Fed but TJX did not. Could be a case of profit-taking.
")
Walmart (WMT)
Description: Walmart is the world’s largest retailer, offering groceries, apparel, and general merchandise through stores and e-commerce.
Technical status: Walmart sold off 4.5% post earnings and continued lower, signaling weakness despite overall market strength.
Trade commentary: Retail is caught in a tug-of-war. Rate cuts are bullish for some sectors, but economic weakness looms as a threat to consumer stocks like WMT. The stock market could vacillate between despair over potential economic weakness and euphoria over the prospects of easier money to bolster consumer spending (borrowing) power.
")
JM Smucker Company (SJM)
Description: The JM Smucker Company is a leading manufacturer of food and beverage products including spreads, coffee, and pet food.
Technical status: SJM broke above its 200DMA but remains a laggard well below all-time highs. Despite a bullish setup with a recent 200DMA breakout, it has underperformed during the broader rally.
Trade commentary: I exited my SJM position, deciding it made little sense to hold a lagging stock in such a bullish market. I rotated into ADM instead (see below). I was hoping to keep SJM has a dividend-paying contrarian play on consumer discretionary.
Archer Daniels Midland (ADM)
Description: Archer Daniels Midland is a global agricultural processor and food ingredient provider.
Technical status: ADM rallied 6% post earnings and followed up with another 3% gain, holding firmly in a bullish breakout.
Trade commentary: I swapped SJM for ADM earlier in the week and was rewarded with strong follow-through gains. ADM’s 3%+ dividend yield and the current uptrend should make the stock a good addition to my dividend-paying portfolio.
")
James Hardie Industries (JHX)
Description: James Hardie Industries manufactures fiber cement siding and related building materials.
Technical status: JHX crashed 34% post earnings to new multi-year lows but bounced 3.7% on Friday. The stock remains in a bearish technical setup.
Trade commentary: While JHX is not investable long-term (a long-term double-top is in play), it could offer short-term trade opportunities. Any position would require a very tight stop. JHX caught my interest because it diverged so dramatically from the bearish to bullish reversal that is now complete for home builders. I am “intrigued” by the sharp rebound to a close above the post-earnings intraday high.
Intuit (INTU)
Description: Intuit develops financial management and tax preparation software including TurboTax, QuickBooks, and Credit Karma.
Technical status: INTU dropped 5% post earnings and closed just below its 200DMA. A move higher could trigger a gap-fill or even a move toward 50DMA resistance.
Trade commentary: I am watching INTU closely for a bounce that could offer a trade to close the post-earnings gap. I just need a higher close. INTU was on shaky ground given rising fears that AI is going to eat software. Tax preparation is likely ripe for disruption with an AI that somehow accurately “understands” the madness that is the U.S. tax code. However, I personally would not trust my taxes to such a system.
")
Zoom Communications (ZM)
Description: Zoom Communications provides cloud-based video conferencing and collaboration software.
Technical status: ZM surged 12.7% post earnings, reclaiming both the 50DMA and 200DMA. However, the stock is now overextended near prior highs.
Trade commentary: I did not buy ZM ahead of earnings but will monitor closely for a more favorable entry point. I still want a signal that long-term momentum is returning. This post-earnings surge reignited my hopes and expectations that ZM will one day regain favor with traders at least one last time.
Microsoft (MSFT)
Description: Microsoft develops software, cloud services, and AI solutions, including the Windows operating system and Azure cloud platform.
Technical status: MSFT suffered a gap-and-crap post earnings and sellers soon closed the remaining gap. The stock now clings to 50DMA (the red line) support.
Trade commentary: I bought weekly call options at the $520 strike, expecting a bounce at least back to the 20DMA. Microsoft remains part of my generative AI basket, but this is the first time in a very long time I jumped back in. Given I missed a clear and obvious uptrend after the April post-earnings gap higher, I am worrying that my late trade is running right into a persisting rotation away from big cap tech.
")
Mastercard (MA)
Description: Mastercard is a global payments technology company facilitating electronic transactions worldwide.
Technical status: MA reached a new all-time high after steadily climbing through resistance levels and overcoming minor post-earnings weakness.
Trade commentary: Despite fears of crypto payment competition, Mastercard shows no signs of weakness. The consumer spending narrative remains strong here. Euphoria over imminent rate cuts understandably pushed MA to a fresh all-time high.
")
Visa (V)
Description: Visa is a global payments technology company that provides electronic payment solutions and services.
Technical status: Unlike Mastercard, Visa has lagged and failed to break out to new highs.
Trade commentary: I remain cautious on Visa as it lags behind Mastercard with plenty of catching up to do. I have no interest in a trade here.
Broadcom (AVGO)
Description: Broadcom is a global semiconductor company specializing in chips for networking, broadband, and AI infrastructure.
Technical status: AVGO bounced off 50DMA support and on Friday briefly challenged its 20DMA before fading. The technical setup remains fragile.
Trade commentary: I bought a call spread before Friday’s close, but the fade left the trade in trouble. I need AVGO to reclaim the 20DMA as support to confirm bullish strength. The stock is heavily dependent on sentiment over the AI trade. Nvidia (NVDA) earnings on Wednesday could deliver an important flashpoint.
")
Shopify (SHOP)
Description: Shopify provides an e-commerce platform enabling merchants to create and manage online stores.
Technical status: SHOP gained 22% post earnings but retraced lower until perfectly testing its 20DMA last week. The stock rebounded 4% on Friday.
Trade commentary: I entered SHOP with a calendar call spread at the $150 strike, expecting a sustained rally from the 20DMA bounce.
")
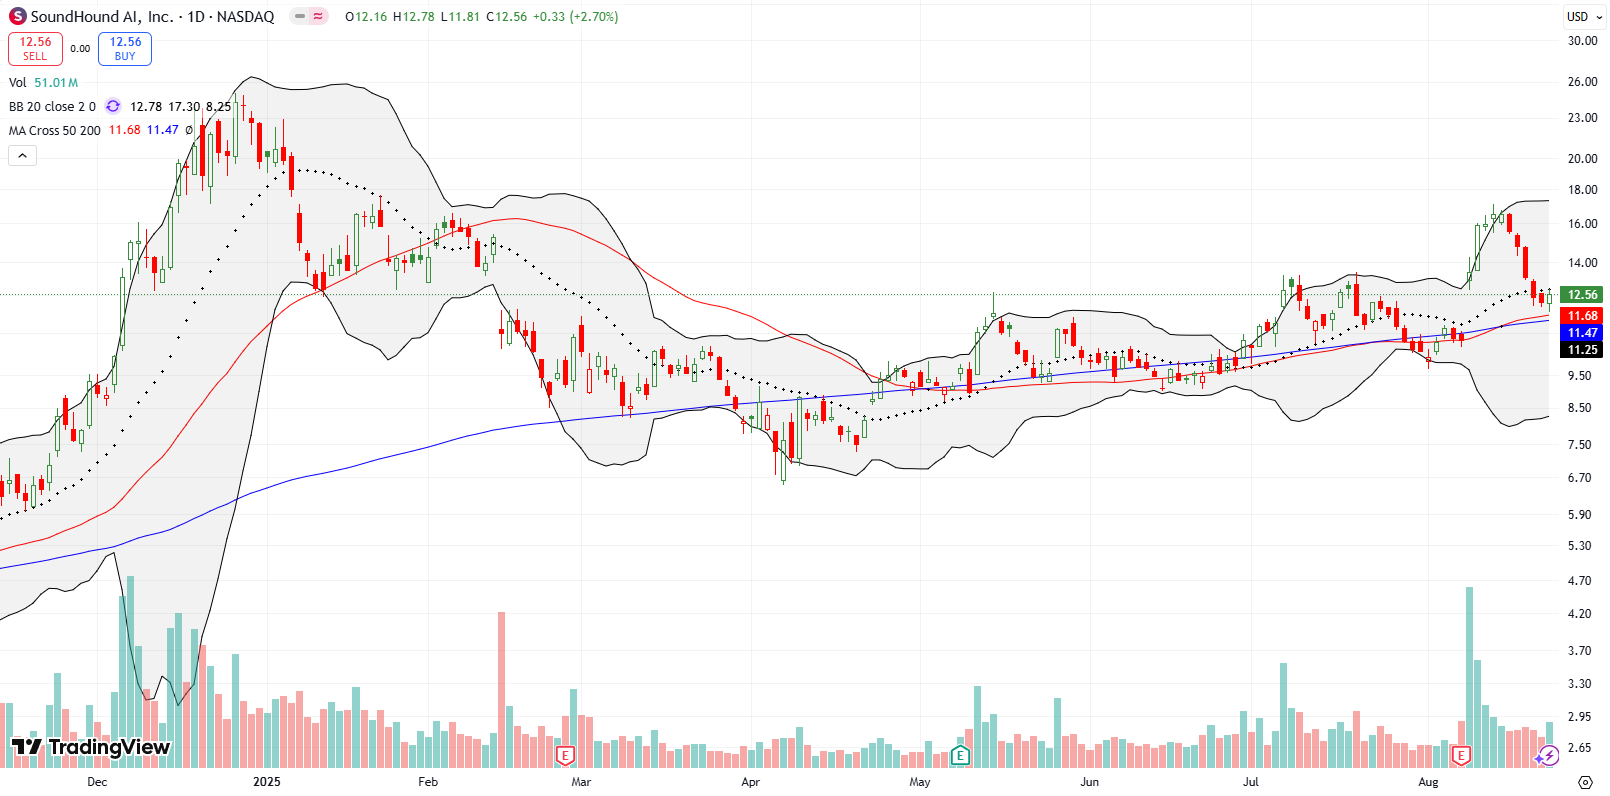
SoundHound AI, Inc (SOUN)
Description: SoundHound AI develops conversational artificial intelligence and speech recognition technologies.
Technical status: SOUN surged 26% post earnings and followed with another 17% gain before selling off for five straight days. The stock rebounded on Friday.
Trade commentary: I narrowly missed my Friday buy price at $12.45. SOUN remains on my watchlist for a breakout above the 20DMA and rush toward the post-earnings high.
Cloudflare (NET)
Description: Cloudflare provides cloud-based networking and cybersecurity services, including content delivery and DDoS protection.
Technical status: NET loosely held 50DMA support after earnings but remains below pre-earnings levels and 20DMA resistance.
Trade commentary: I bought NET shares and plan to hang around for the long-term its leadership in protecting web data from AI scraping and creating a platform for publishers to monetize content in the AI era.
")
SPDR Gold Shares (GLD)
Description: SPDR Gold Shares is an ETF designed to track the price of gold bullion.
Technical status: GLD gained 1.1% in the wake of post Powell euphoria but remains stuck in a four-month consolidation range pivoting around its 20DMA and 50DMA.
Trade commentary: I hold a calendar call spread at the $308 strike. If the current short call expires worthless, I may close the trade or restructure into a call spread. I have flipped two or three short calls already during this extended consolidation period.
")
")
Be careful out there!
Footnotes
Subscribe for free to get email notifications of future posts!
“Above the 50” (AT50) uses the percentage of stocks trading above their respective 50-day moving averages (DMAs) to measure breadth in the stock market. Breadth defines the distribution of participation in a rally or sell-off. As a result, AT50 identifies extremes in market sentiment that are likely to reverse. Above the 50 is my alternative name for “MMFI” which is a symbol TradingView.com and other chart vendors use for this breadth indicator. Learn more about AT50 on my Market Breadth Resource Page. AT200, or MMTH, measures the percentage of stocks trading above their respective 200DMAs.
Active AT50 (MMFI) periods: Day #48 over 20%, Day #46 over 30%, Day #41 over 40%, Day #9 over 50%, Day #1 over 60% (overperiod), Day #21 under 70% (underperiod)
Source for charts unless otherwise noted: TradingView.com
Full disclosure: long IWM shares, long GLD call spread, long SHOP calendar call spread, long SPY put spread, long ITB, long TGT shares and calendar call spread, long ADM, long MSFT calls, long AVGO call spread, long SHOP calendar call spread, long NET
FOLLOW Dr. Duru’s commentary on financial markets via StockTwits, BlueSky, and even Instagram!
*Charting notes: Stock prices are not adjusted for dividends. Candlestick charts use hollow bodies: open candles indicate a close higher than the open, filled candles indicate an open higher than the close.
* Blog notes: this blog was written based on the heavily edited transcript of the following video that includes a live review of the stock charts featured in this post. I used ChatGPT to process the transcript.
1 thought on “Bullish Surge In Market Breadth As Fed Chair Powell Reignites Rally – The Market Breadth”