

Stock Market Commentary
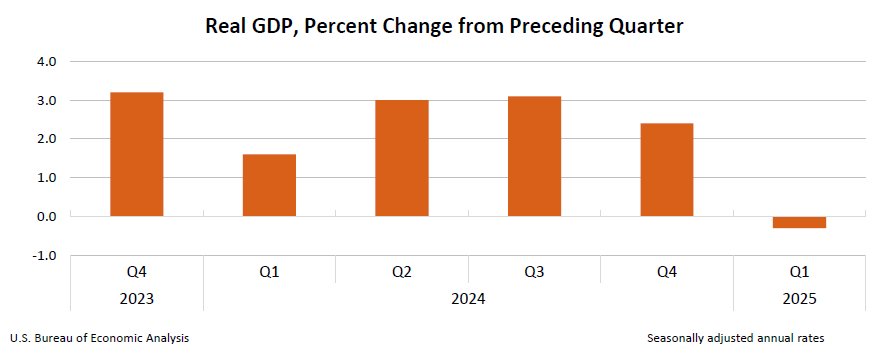
The stock market experienced a hiccup in an otherwise strong post-oversold bounce. The Q1 GDP report revealed a small contraction that surprisingly caught the market off guard. However, this contraction was driven primarily by a surge in imports as businesses rushed to get ahead of anticipated tariffs. I assume a lot of traders were looking for an excuse to sell given the proximity of overhead resistance to the major indices.
The early morning gap down shook confidence, but buyers stepped in throughout the day, pushing indices off their lows and into strong closes. What’s more promising is the after-hours action: Microsoft (MSFT) and Meta Platforms (META) rallied on earnings beats, lifting Nvidia (NVDA) as well. This sets the stage for a strong open on May 1st and potentially a strong start to the month of May…with key resistance setting the stage for a major proving ground for this strong bounce from oversold conditions.
The Stock Market Indices
S&P 500 (SPY)
The S&P 500 experienced a sharp gap down, erasing all of Monday’s gains and falling as much as 2% intraday before sharply rebounding into the close. This set up the first major test—resistance at the downtrending 50-day moving average (DMA) (red line). A potential gap up driven by strong tech earnings could take SPY above that resistance. A break above would set up a challenge of the more significant 200DMA (blue line).
I won’t increase my bullishness on a gap up because of the close proximity of that 200DMA test. A fall back below the 50DMA would force me into a more cautious stance, potentially prompting put option hedges.
NASDAQ (COMPQ)
The NASDAQ posted a marginally negative close but showed an intraday recovery similar to the S&P 500. Like SPY, the tech laden index faces resistance at its 50DMA. If the NASDAQ clears that level, the gap to the 200DMA is wider than SPY’s, presenting a more tempting short-term trade setup to the upside.
The iShares Russell 2000 ETF (IWM)
IWM is once again teasing its bear market line. I entered call options after a second higher close above that level. Despite the pullback on the hiccup, I was unable to add to the position. I might try again before IWM tests its 50DMA resistance. After a breakout, IWM becomes especially attractive given the wide gap between its 50DMA and 200DMA—greater than those for SPY or the NASDAQ.
The Short-Term Trading Call With A Hiccup
- AT50 (MMFI) = 38.2% of stocks are trading above their respective 50-day moving averages
- AT200 (MMTH) = 31.1% of stocks are trading above their respective 200-day moving averages
- Short-term Trading Call: cautiously bullish
AT50 (MMFI), the percentage of stocks trading above their 50DMAs, closed the day at 38.2% after a sharp rally from the morning’s gap down. Despite the day’s GDP-fueled hiccup, buyers erased the morning losses, continuing an impressive pattern of strength. However, with resistance looming overhead, now is a good time to take my aggressive bullishness down to a short-term trading call of cautiously bullish. I do not plan to flip to neutral/bearish until AT50 approaches or tests the overbought threshold at 70%.
The longer-term indicator of market breadth, AT200 (MMTH), the percentage of stocks trading above their respective 200DMAs, is still trending higher from its recent low, but its movement is more sluggish and it remains in a broader downtrend. This longer-term caution added to my motivation to downgrade the short-term trading call to cautiously bullish.
The volatility index (VIX) continues to support bullish momentum. The VIX spiked on the morning hiccup, matching last week’s highs before fading again. The fade reaffirmed the current downtrend in volatility.
The Equities: Hiccup
Broadcom (AVGO)
AVGO broke below its 200DMA earlier, prompting me to exit. Now the stock is back above both its converged 200DMA and 50DMA—technically bullish—but with earnings coming soon, I am staying on the sidelines for now.
Spotify (SPOT)
SPOT rebounded 6.4% after a 3.5% post-earnings loss. The net move is now positive, and the stock looks set to resume its uptrend.
Okta, Inc (OKTA)
OKTA rebounded with the broader market after being “thrown out with the tariff baby water.” A recent addition to a midcap index sparked a 7.4% surge. A break above resistance from the previous highs should resume its post-earnings momentum.
Brinker International, Inc (EAT)
EAT broke down beow 50DMA support with a 14.8% post-earnings drop. I expect EAT to test its 200DMA support in short order.
Palantir Technologies Inc (PLTR)
PLTR remains strong and is approaching all-time highs. I hold a calendar call spread and expect continued strength into earnings.
Snowflake (SNOW)
SNOW broke out above both its 50DMA and 200DMA. I am watching for a breakout above $160.41, targeting a return to $192–193.
Logitech (LOGI)
LOGI did not benefit from all the buying of computer equipment per the GDP report. The stock gapped down 3.6% post-earnings and remains well below converged 50 and 200DMA resistance.
First Solar (FSLR)
FSLR dropped 8.3% on earnings and remains below important support from November 2023. I will wait for a move above $144 before considering the stock for a contrarian play.
Teladoc (TDOC)
TDOC continues its erratic behavior and is once again near all-time lows. I am avoiding this red-flag stock entirely. A stock that delivers such major fake breakouts is too dangerous for me. (I was fooled in February but fortunately I did not chase the stock higher).
Snap Inc (SNAP)
SNAP lost 12% after withdrawing guidance. Despite its bearish setup, I see a buying opportunity if it can hold April’s lows. Technically, it delivered a fake breakout above 50DMA resistance just ahead of earnings. SNAP is a reminder of the dangers of getting lulled into countertrend trading based on technicals ahead of a major event like earnings. As a reminder I am hanging on to SNAP on speculation of some kind of M&A deal down the road based on a member of Yahoo joining the SNAP board.
Caterpillar, Inc (CAT)
CAT gapped up, dropped 1.5%, and then rebounded for a 0.6% post-earnings gain. The stock is staring down 50DMA resistance as it now struggles to finish reversing its tariff-related losses. I may use CAT as a put-option hedge if it tests the 50DMA.
The Vita Coco Company (COCO)
COCO popped 4.8% post-earnings, clearing its 50DMA and 200DMA. I want to buy COCO on a higher close.
Freshworks Inc (FRSH)
FRSH had a volatile post-earnings day, ultimately gaining 3%. I bought call options and shares near the 200DMA. Strong earnings sets up a potential test of the last March high.
United States Oil Fund (USO)
USO fell 3.5%, nearing April’s tariff lows. A breakdown below could trigger a steep drop toward 2023 lows around $58.
Be careful out there!
Footnotes
Subscribe for free to get email notifications of future posts!
“Above the 50” (AT50) uses the percentage of stocks trading above their respective 50-day moving averages (DMAs) to measure breadth in the stock market. Breadth defines the distribution of participation in a rally or sell-off. As a result, AT50 identifies extremes in market sentiment that are likely to reverse. Above the 50 is my alternative name for “MMFI” which is a symbol TradingView.com and other chart vendors use for this breadth indicator. Learn more about AT50 on my Market Breadth Resource Page. AT200, or MMTH, measures the percentage of stocks trading above their respective 200DMAs.
Active AT50 (MMFI) periods: Day #4 over 20%, Day #2 over 30%, Day #41 under 40%, Day #53 under 50%, Day #78 under 60%, Day #179 under 70%
Source for charts unless otherwise noted: TradingView.com
Full disclosure: long IWM shares and call, long SPY put spread, long PLTR diagonal call spread, long SNAP, long FRSH shares and calls
FOLLOW Dr. Duru’s commentary on financial markets via StockTwits, BlueSky, and even Instagram!
*Charting notes: Stock prices are not adjusted for dividends. Candlestick charts use hollow bodies: open candles indicate a close higher than the open, filled candles indicate an open higher than the close.
* Blog notes: this blog was written based on the heavily edited transcript of the following video that includes a live review of the stock charts featured in this post. I used ChatGPT to process the transcript.