Stock Market Commentary
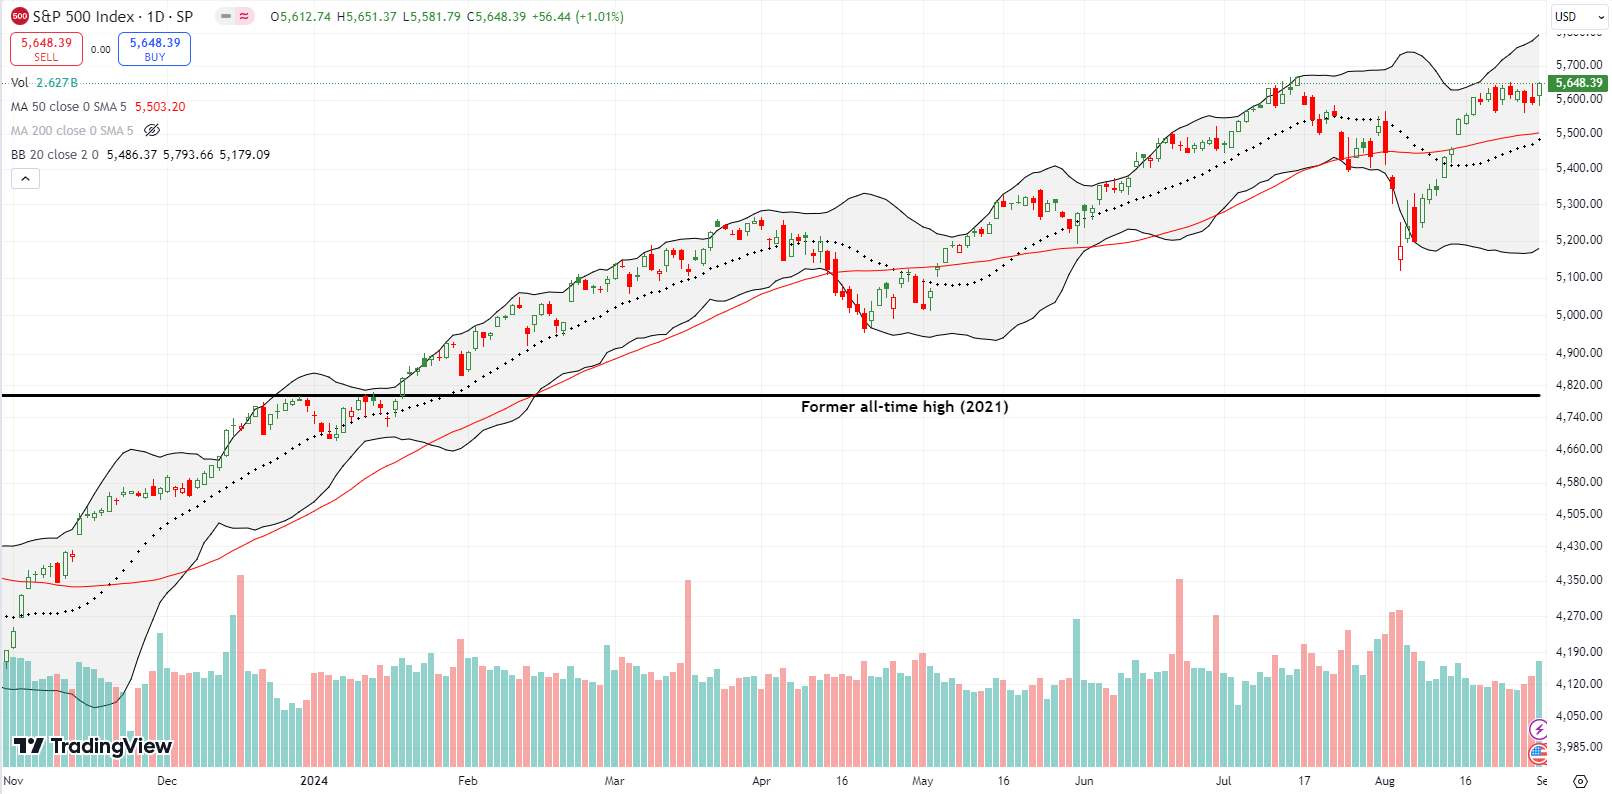
At the beginning of August, you might have looked uninformed predicting that the S&P 500 would end up printing its 4th straight monthly gain. At its lows, the index wiped out gains from the previous two months and almost reversed May as well. Now, the index hovers just below its all-time high and looks like it is waiting for the next buy signal. The sell in May and go away adage failed once again as a rule for stepping aside from summer trading. Instead, the new adage should tell traders to buy the summer swoons, especially the big ones.
Anyway, what carries enough potential to send a stock market already at or near all-time highs even higher? The Federal Reserve delivers its next pronouncement on monetary policy on September 18th. Since the Fed is widely expected to cut rates, the event itself has more potential to disappoint than to provide a fresh catalyst. Instead, this meeting is likely to keep traders and investors focused on buying going into the meeting.
Along the way to the Fed, the report on August jobs has the potential to deliver a buy signal. However, the room for error is small. The jobs report needs to be soft enough to justify rate cuts but not so soft to freak people out like last month’s episode. At the time, esteemed Wharton economist Jeremy Siegel piled into the stock market panic insisting that the Fed needed to cut 75 basis points (0.75%) immediately and cut another 75 basis points at the September meeting. It was a picture-perfect classic case of a sentiment extreme signalling the end of the catalyzing market move. As the stock market sharply rebounded, Siegel felt compelled to reverse himself and smooth out his panic. In other words, Siegel let the stock market sway his emotions and his interpretation of the economy; he over-extrapolated with a bias to shoot first.
The next CPI (consumer price index) report comes on September 11th. I suspect this report will be a non-event given the assumption that inflation is already dead and any outlier report will be dismissed as a singular data point. Still, if inflation comes in a lot softer than expected, the stock market could get giddy about receiving a 50 bps cut at the Fed meeting.
Finally, politics could be the stock market’s on-going wildcard going into the November elections. While I almost never allow politics to influence my trading, the market can at times react too quickly to political events and pronouncements. Perhaps the September 10th presidential debate between VP Kamala Harris and former President Donald Trump could deliver an excuse for more buying ahead of the Fed.
Putting aside the fundamentals, the technicals will likely offer the cleanest buy signals. This juncture is surreal given the Fed will be cutting rates with a sky-high stock market. Moreover, September is the second of the market’s three most dangerous months. August’s extreme sell-off increases the likelihood that September will also be worse than usual.
The charts below tell great poetry of tensions at resistance, support, and an on-going drama directly below the overbought period.
The Stock Market Indices
The S&P 500 (SPY) ended the week with a fractional gain over the previous week. Friday’s 1.0% gain reversed an ever so slight downward bias all week. The index marginally invalidated its bearish engulfing topping pattern with its second highest close ever. This perch just above a 2-week consolidation period makes the S&P 500 look like it is just one excuse away from soaring after the next buy signal.
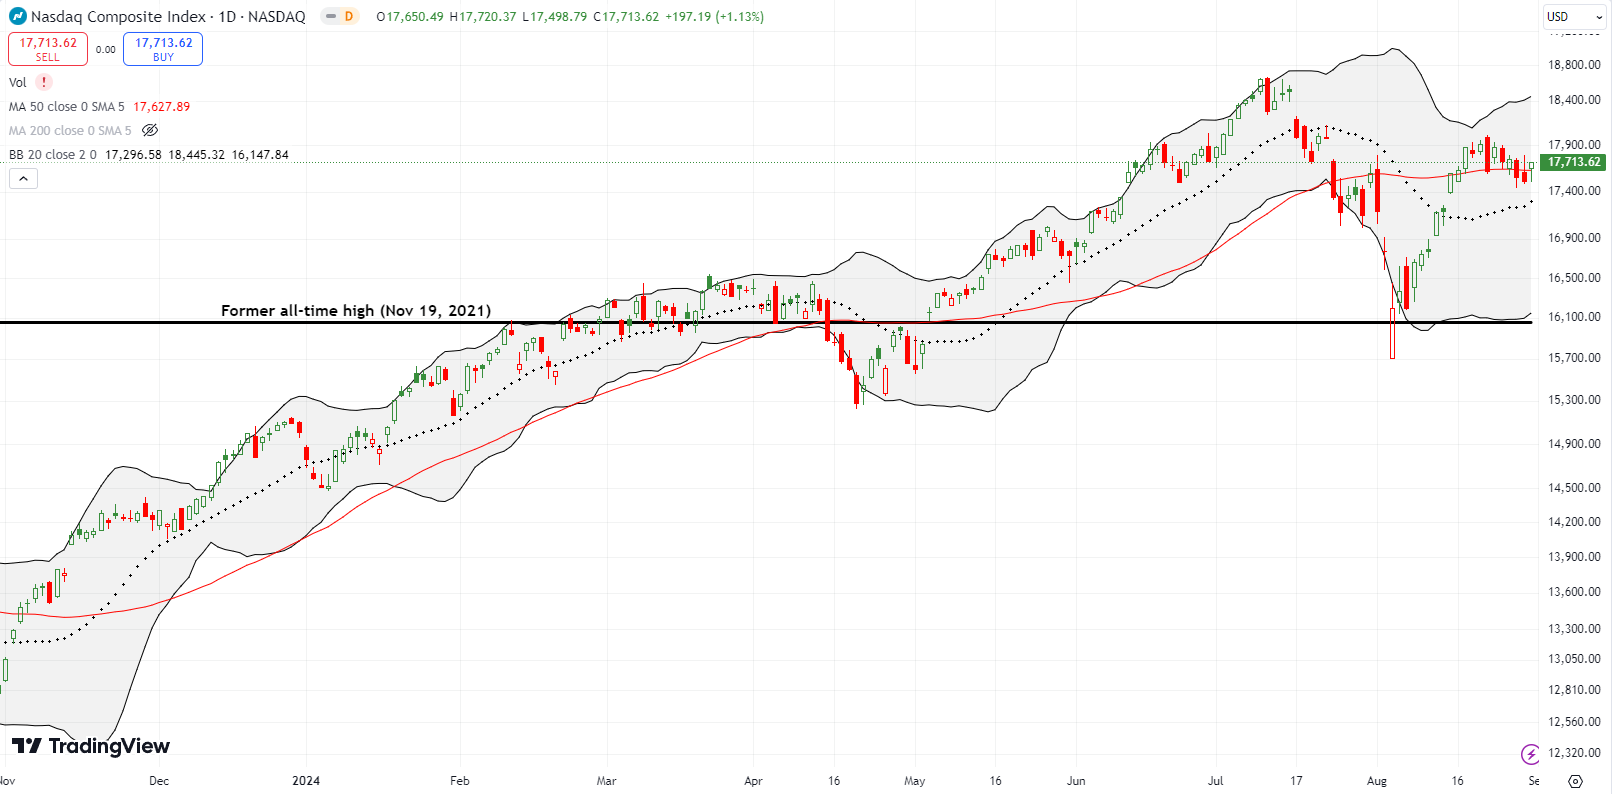
The NASDAQ (COMPQ) is notably lagging the S&P 500. The tech-laden index ended August 0.7% higher than its July close, but it remains well off its all-time high. The NASDAQ also meandered lower over the last two weeks with support at the 50-day moving average (DMA) (the red line) providing a tepid pivot. Perhaps the NASDAQ is waiting for an uptrending 20DMA to force it higher as its next buy signal.
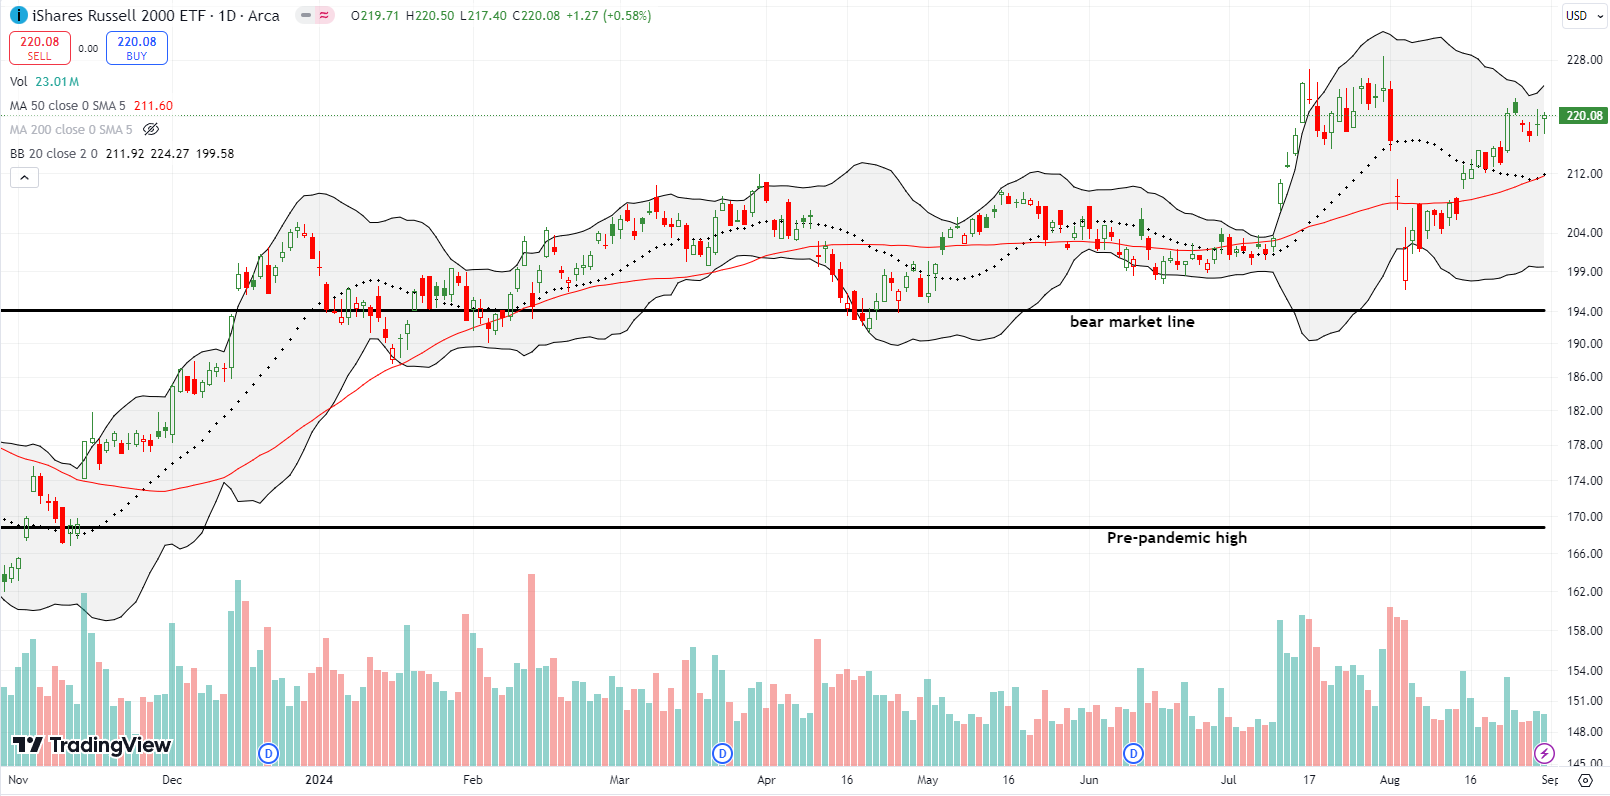
The iShares Russell 2000 ETF (IWM) is slowly but surely working to regain its former, albeit brief, glory from July’s market rotation. IWM ended flat on the week and failed to invalidate the July topping pattern. Still, momentum is pointing in the right direction. IWM continues to hold the key for market breadth.
The Short-Term Trading Call While Awaiting the Next Buy Signal
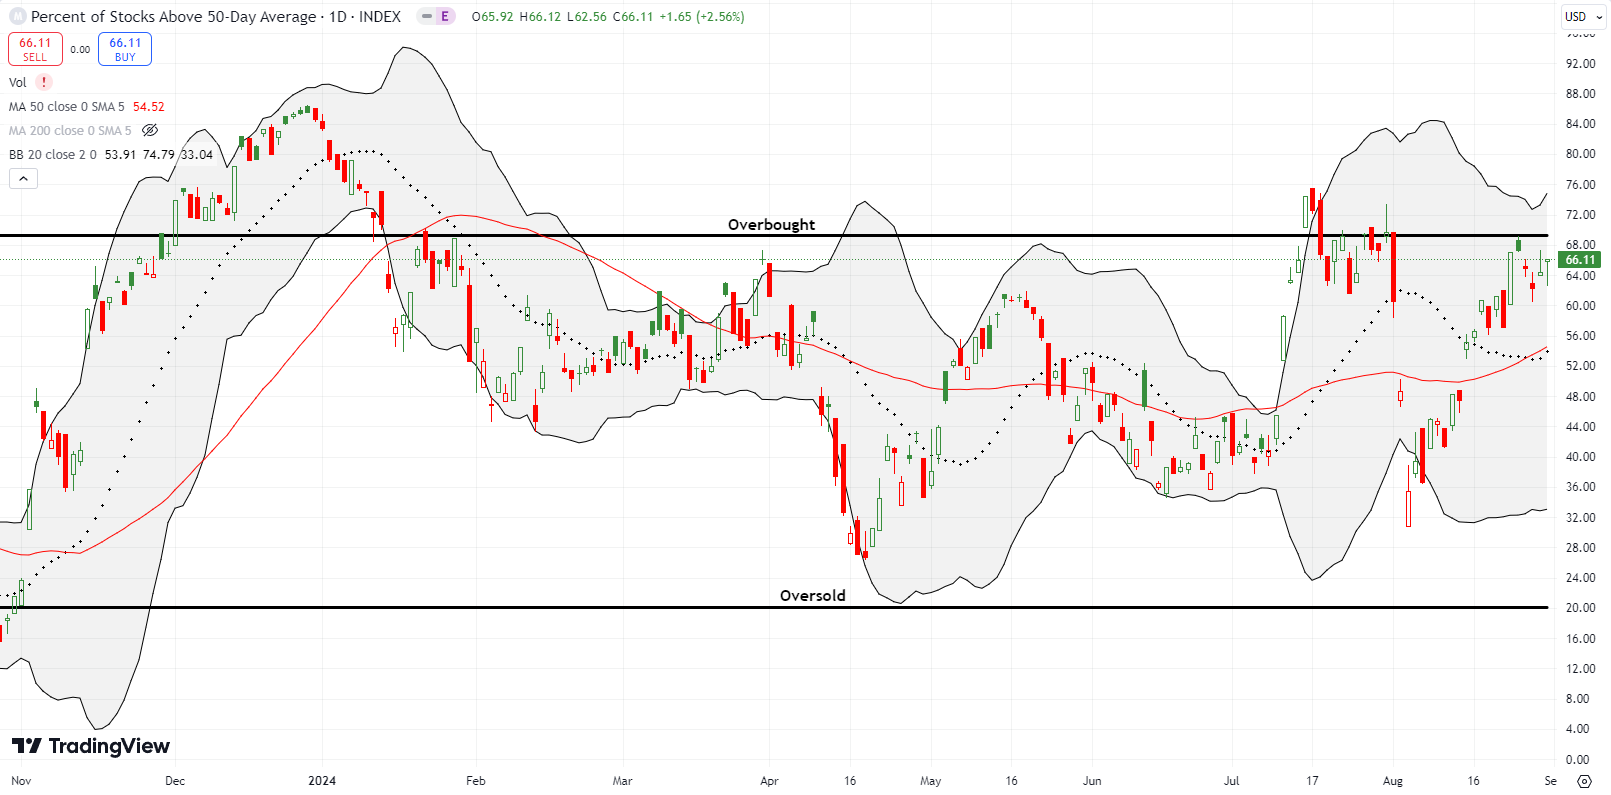
- AT50 (MMFI) = 66.1% of stocks are trading above their respective 50-day moving averages
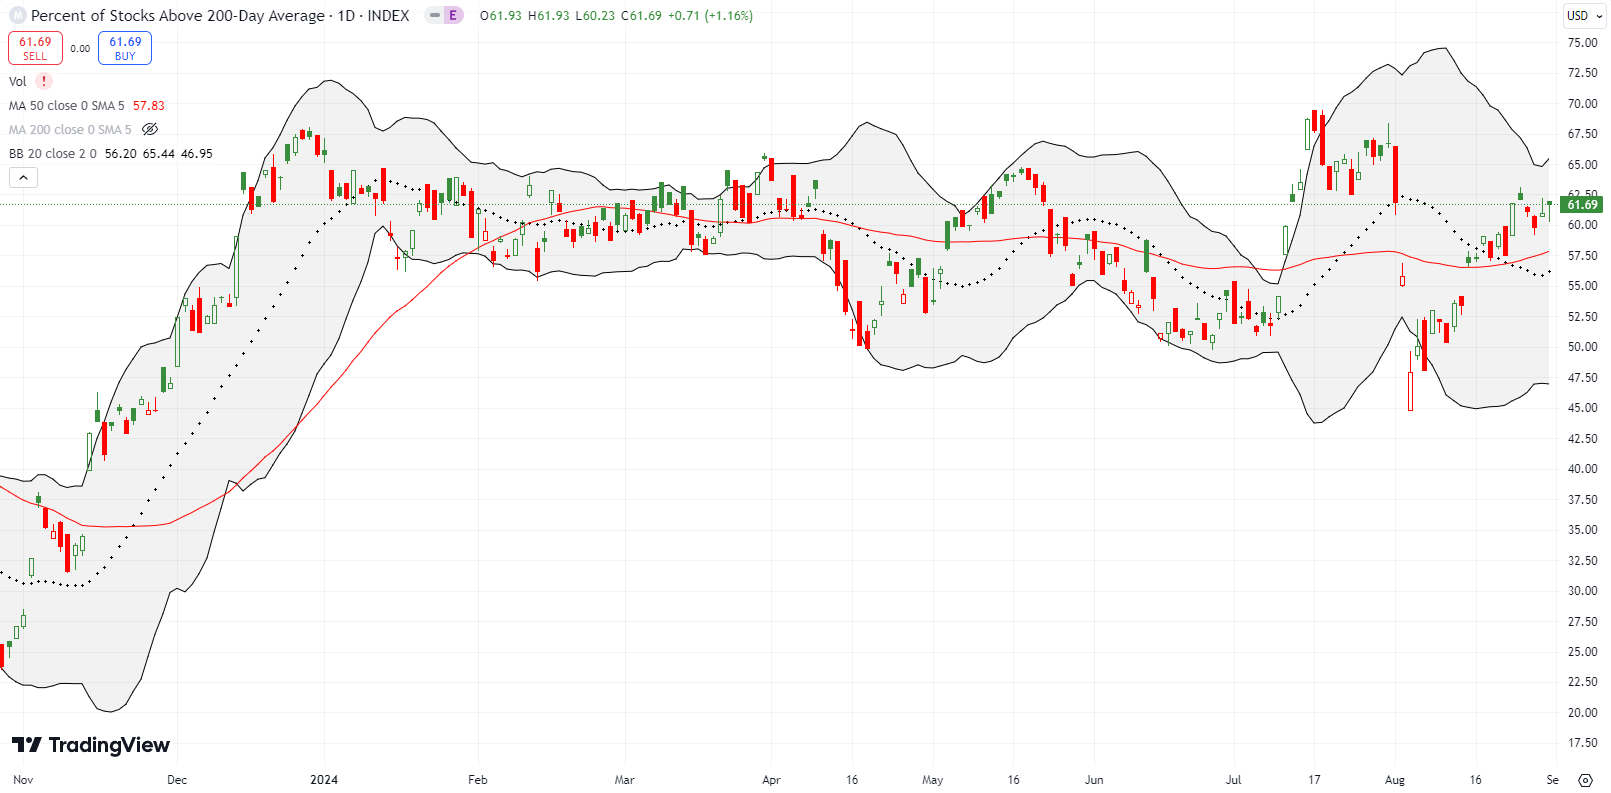
- AT200 (MMTH) = 61.7% of stocks are trading above their respective 200-day moving averages
- Short-term Trading Call: neutral
AT50 (MMFI), the percentage of stocks trading above their respective 50DMAs, closed the week at 66.1%, just one percentage point below its close from the prior week. Per the AT50 trading rules, my favorite technical indicator suffered a bearish rejection from the overbought threshold at 70%. Yet, nothing else flashed strong sell signals. So, I just purchased a fresh batch of SPY put options in order to be ready so I don’t have to get ready. I added strangles (calls and puts) on some individual stocks with decent setups that seem aligned with a neutral trading call: ROKU, DASH, and NVDA (see below). With the volatility index (VIX) back at 15, put protection is relatively cheap again. Still, the indices looked poised to go higher not lower, so I kept my short-term trading call at neutral while I wait like everyone else for the next buy signal. (Per my last analysis, that next buy signal may be a sizeable September drawdown).
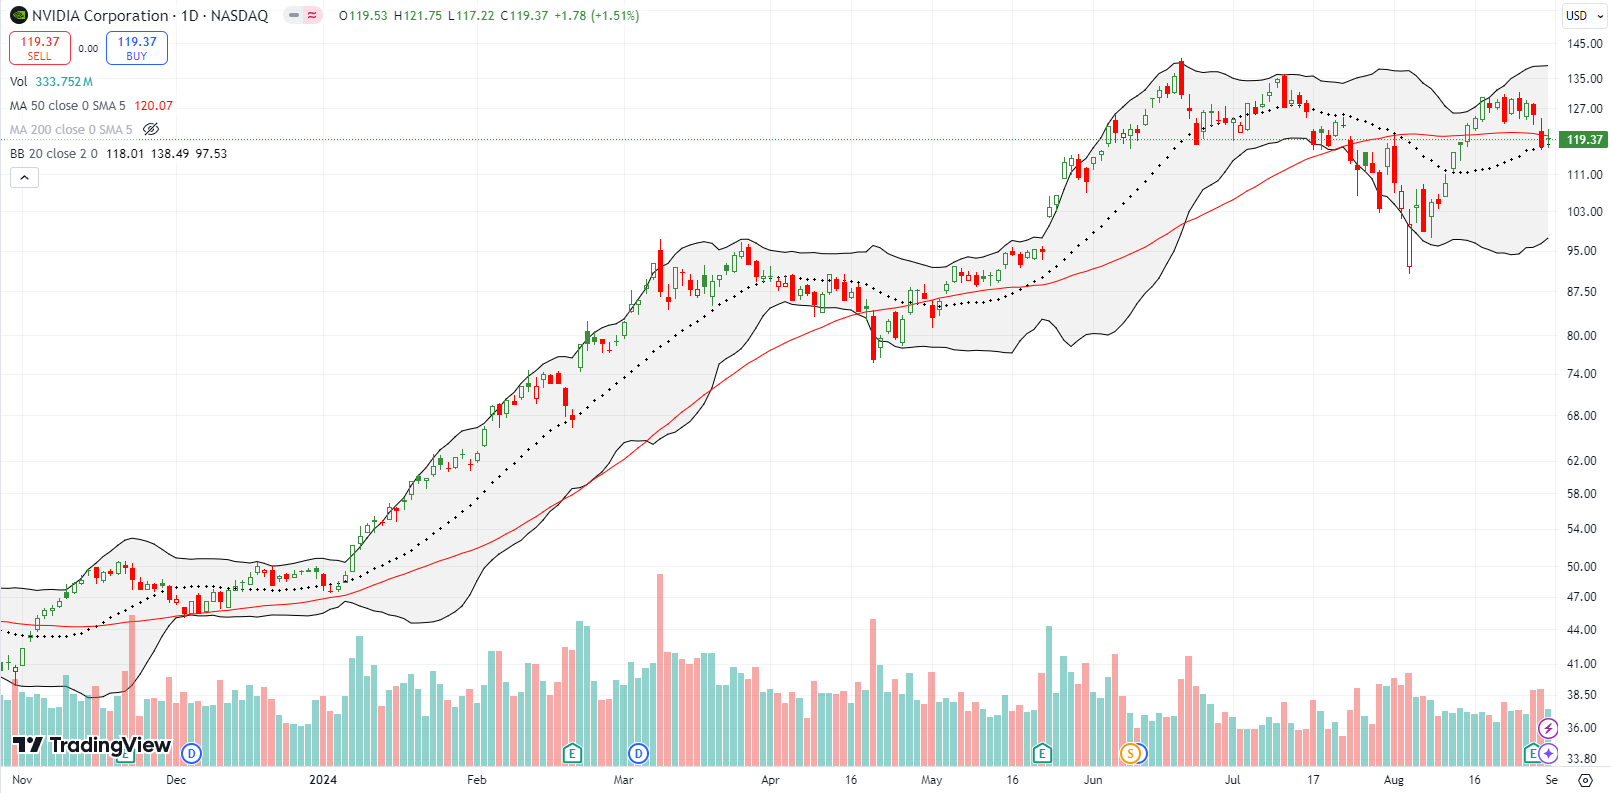
Earnings for NVIDIA Corporation (NVDA) were highly anticipated last week. The stock at one point almost closed its post-earnings gap down but ended up with a 6.4% loss on the day. While the 50DMA gave way as support, the 20DMA (the dashed line) hung in there. I expect NVDA to burst higher or lower from here. Note carefully that NVDA’s pre-earnings high is the second lower high for the stock. While I fully expect the August lows to hold, I will be on-guard for an NVDA calamity if the stock adds another lower low to its lower highs.
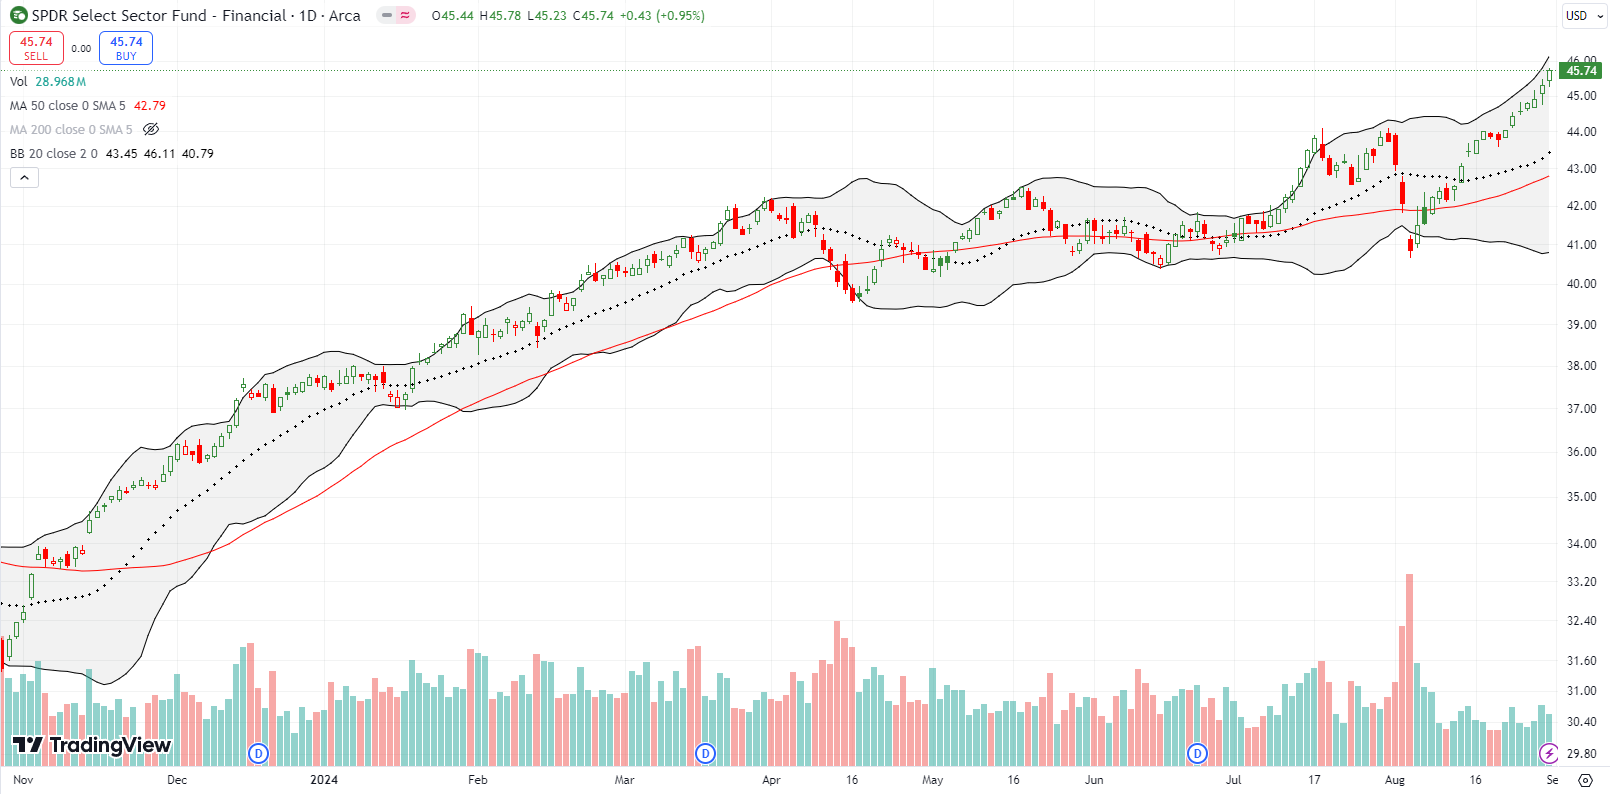
Financial stocks as a whole completely snuck by me after Wells Fargo (WFC) lost its earlier mojo. SPDR Select Sector Fund – Financial (XLF) has rallied nearly straight up since the August calamity. Talk about a giddy anticipation of rate cuts! XLF has set 6 straight new all-time highs since it broke out above the July double-top. Needless to say, XLF is at the top of my “buy the dip” shopping list.
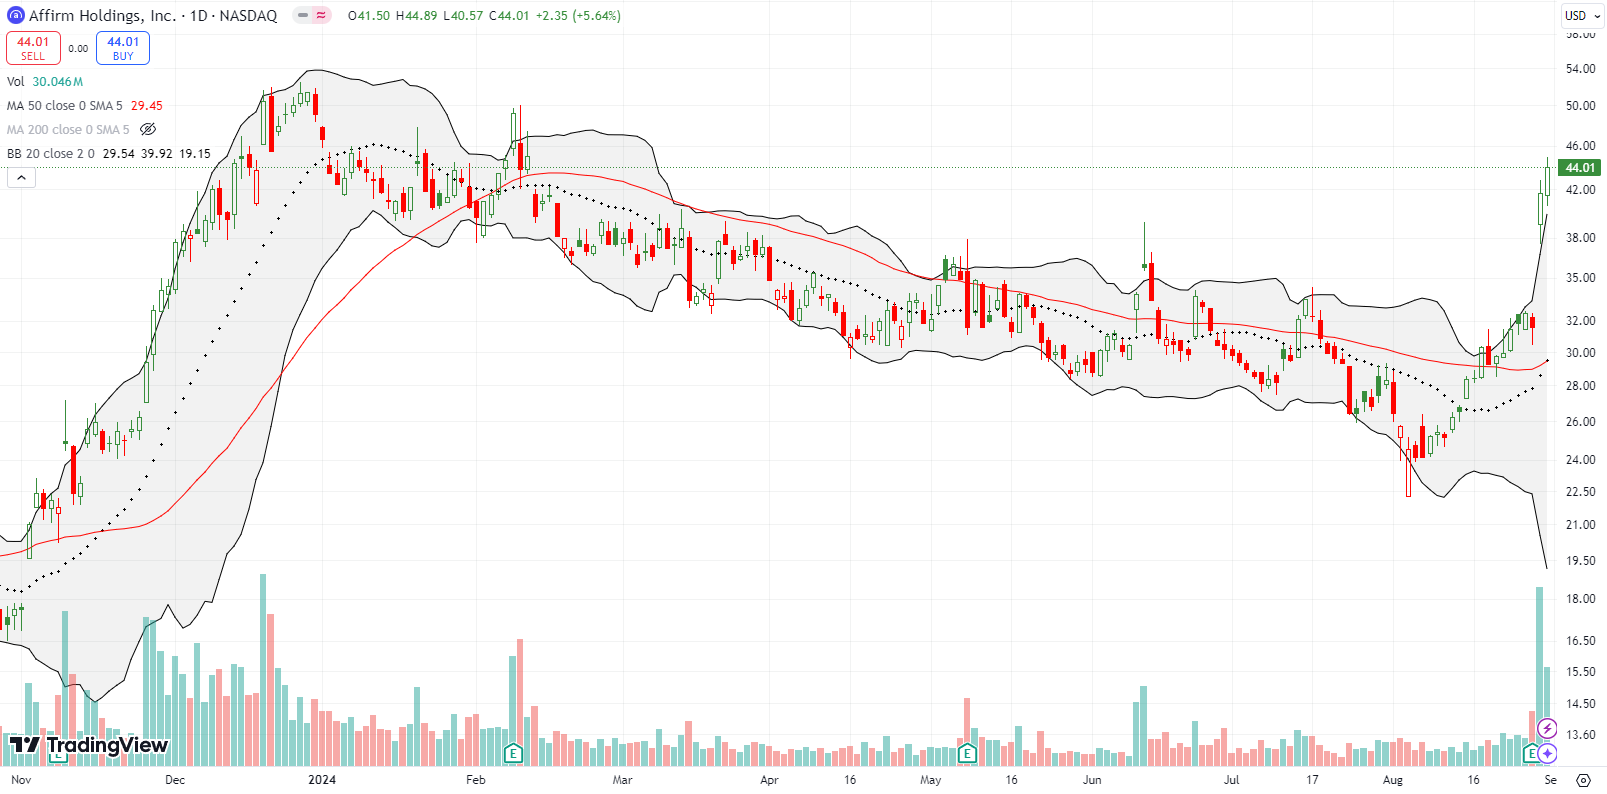
After sliding through a steady downtrend all year, Affirm Holdings Inc (AFRM) suddenly sprung to life post-earnings last week. The stock soared 31% post-earnings and hit a 7-month high last week. This move hardly has the look of a market anticipating economic weakness or even a recession. Stubbornly strong retail sales support AFRM but perhaps sky high debt levels also support a scramble by consumers to find alternative routes of financing.
The headline numbers hardly seemed impressive, with AFRM delivering a hike in revenue guidance, so I decided to scan the earnings transcript to identify any particular golden nuggets. I was quite surprised to find that management went almost right into Q&A after proudly announcing “Obviously, we had a killer quarter in fiscal year on both growth and profitability side of the ledger. So as is our custom, the better the results, the less comment I’ll offer.” Management went on talk about how they control the numbers and the high visibility into the business. I decided to stop there. Let’s see whether AFRM can pull off a repeat performance in three months. In the meantime, the stock is definitely in a bullish position.
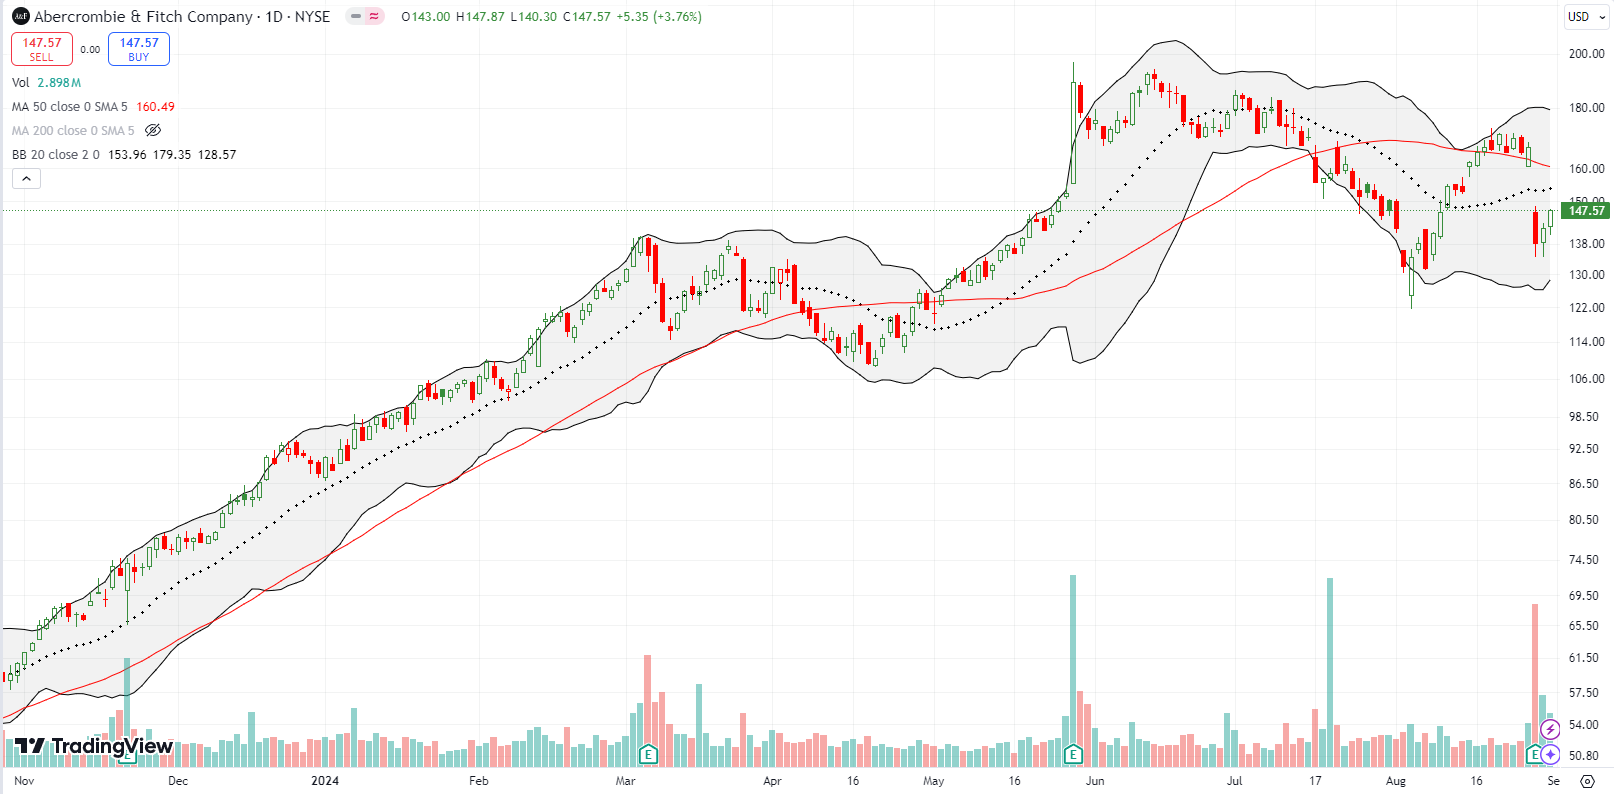
Affirm’s customers must be shopping less at Abercrombie & Fitch Company (ANF). ANF was a market darling until a 24.3% post-earnings surge in May created a blow-off top. ANF has not been the same since. Last week, the stock lost 17% from a post-earnings loss. The stock rallied a bit the last two trading days but seems like it is slowly but surely topping out.
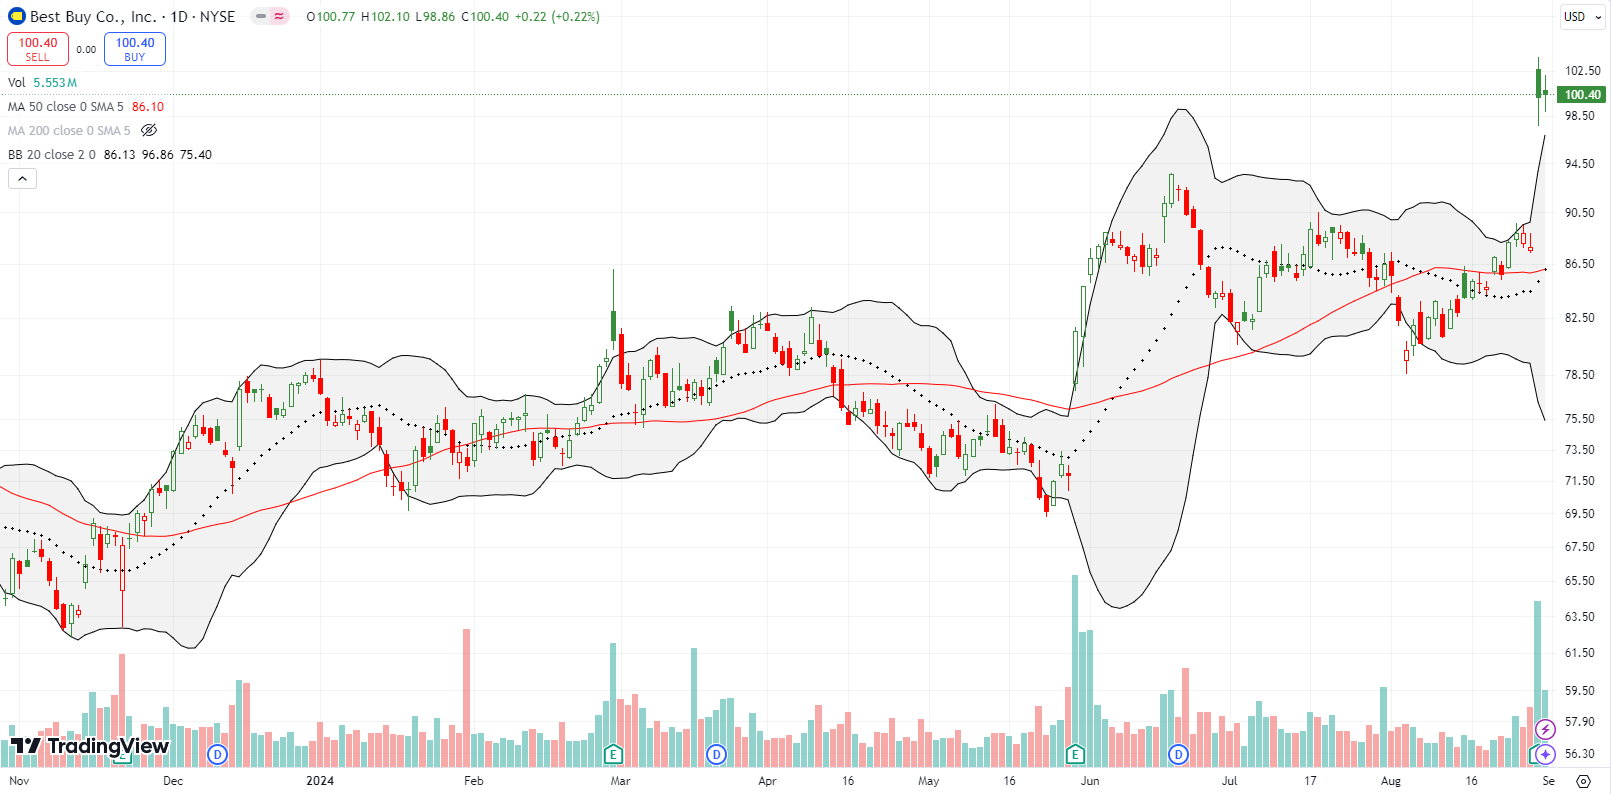
Affirm customers must be scrambling for electronics. Best Buy Co Inc (BBY) completely startled me with a 14.1% post-earnings gain last week. With the stock at an 18-month high and trading well above its upper Bollinger Band (BB), I felt compelled to close out my position. BBY is in a very bullish position and is a buy on the dips, surprisingly enough!
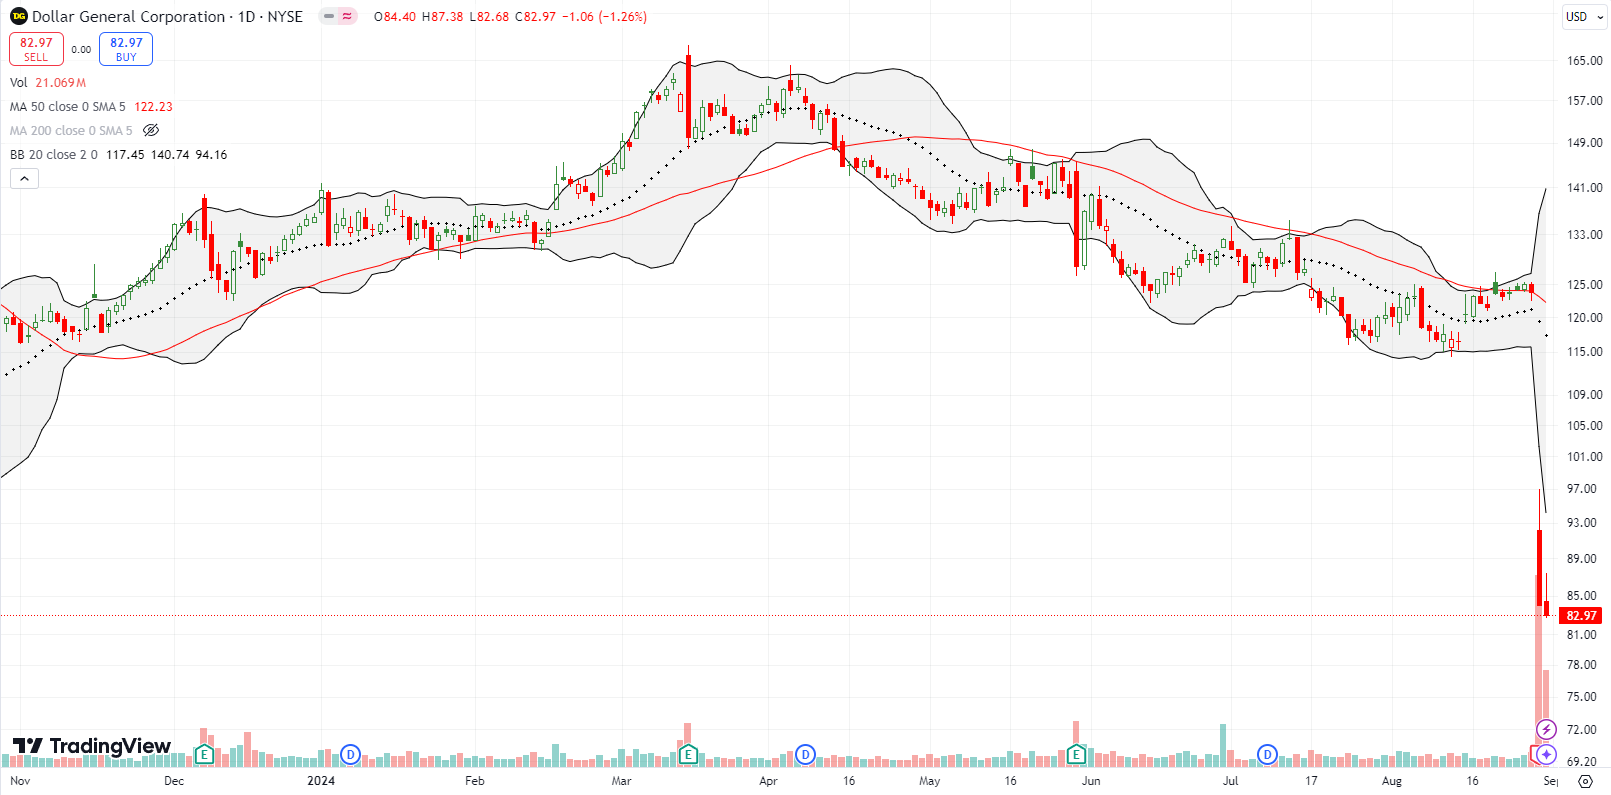
Perhaps the most surreal thing about the divergent fortunes of retailers is seeing the dollar/discount stores collapse. These stores are supposed to be the last refuge of strapped consumers. Instead, it looks like this business model is losing favor.
Last week, Dollar General Corporation (DG) collapsed 32% post-earnings and hit a 7-year low. Competitor Dollar Tree (DLTR) fell 10.2% in sympathy and traded to a near 3-year low. Moreover, discounter Big Lots, Inc (BIG) cratered 38.4%. At $0.55/share, BIG looks like it is on its way to bankruptcy. Perhaps Walmart (WMT), which made a new all-time high on Friday, is sucking all the air out the discount room. Perhaps the discount model is failing because of lingering inflationary pressures that these stores cannot pass along to their customers.
For more on Dollar General’s woes see Marketplace’s story: “At Dollar General, sales of “consumable” goods are up. But profits are down.”
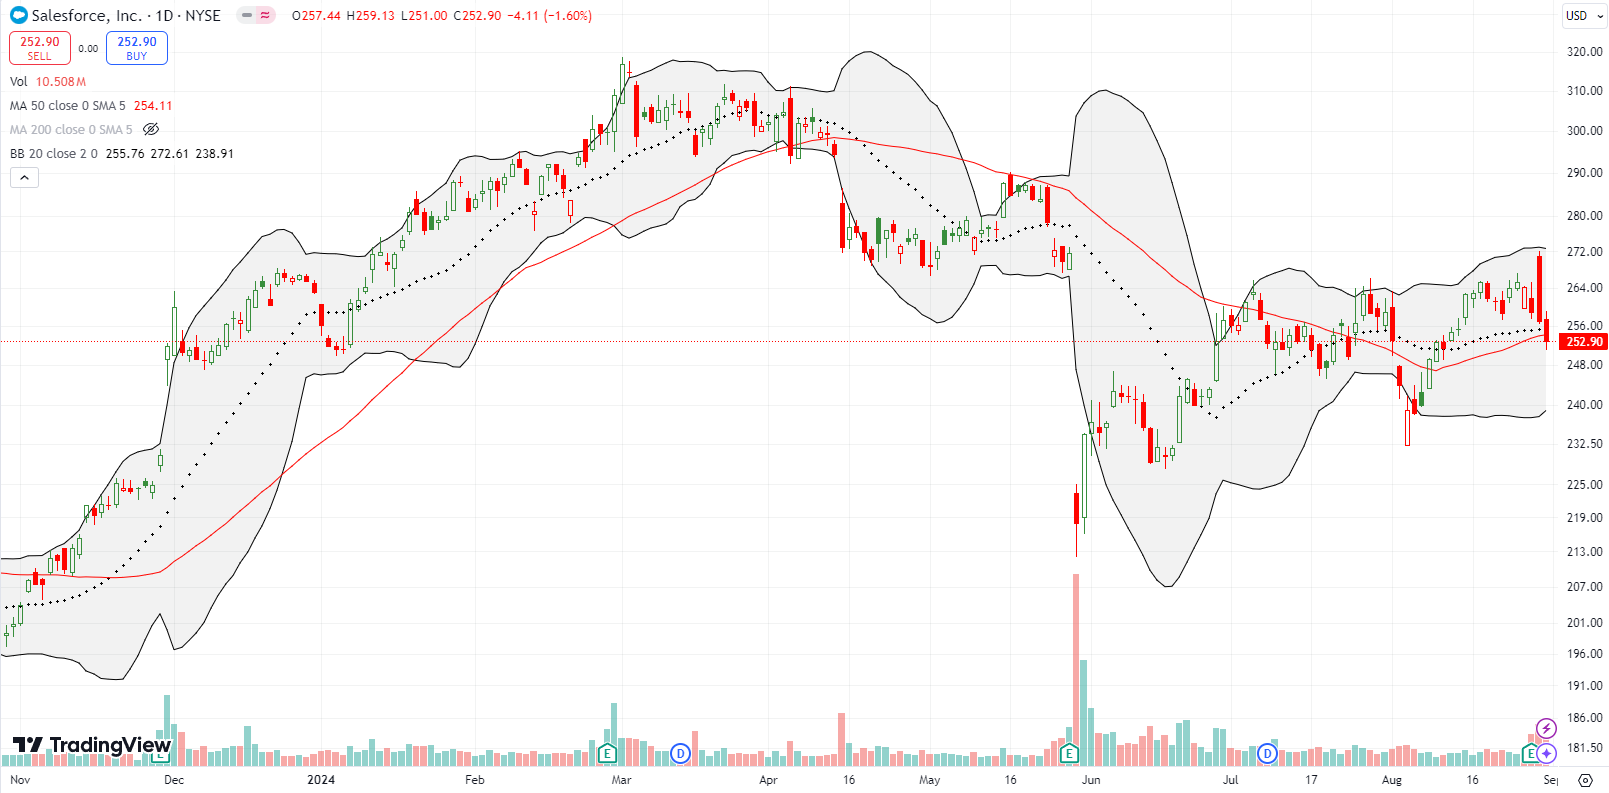
Salesforce, Inc (CRM) suffered a decent-sized post-earnings fade. The stock gapped higher only to lose fractionally on the day. CRM lost another 1.6% the next day. The momentum from the August bounce looks like it has come to an end. Is a test of the May lows over the horizon? Note how CRM has so far tried three times and failed to close the May post-earnings gap down.
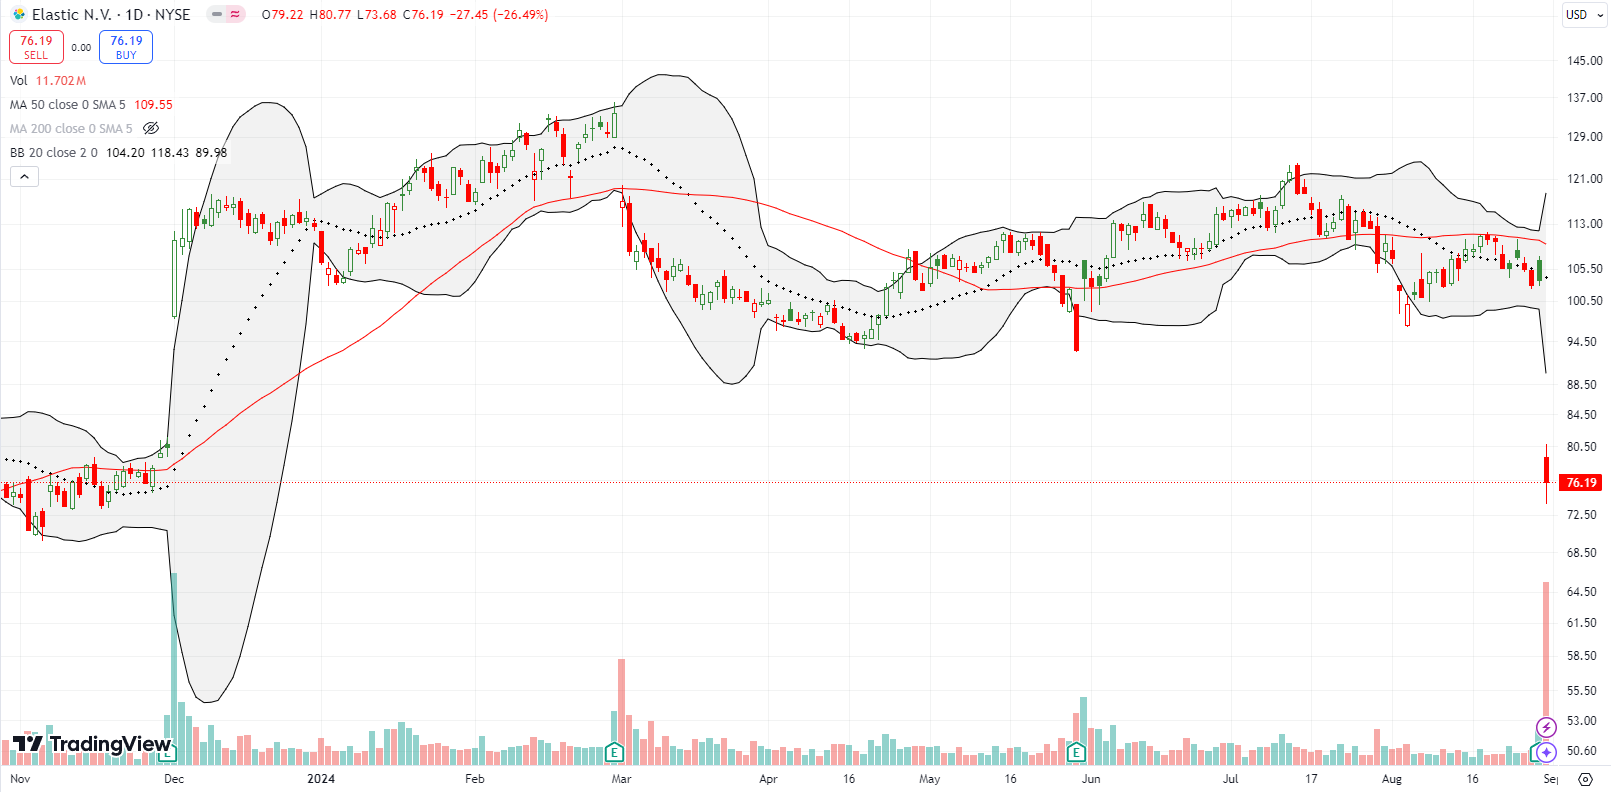
Elastic N.V. (ESTC) describes itself as a “a search artificial intelligence (AI) company.” I know the company by its ElasticSearch product. I imagine the advent of generative AI caused ESTC to scramble to remarket itself. The repositioning failed to include ESTC in the AI hype as the stock spent much of 2024 twisting in a trading range. Friday’s 26% post-earnings loss brought that trading range to an abrupt end. ESTC even finished filling a large gap higher from December earnings. Apparently, ESTC’s main problems were a reorganization in sales and soft international sales. Yet, the generative AI product is doing well.
ESTC is 60% off its all-time high set in 2021, and it looks like the stock may never regain its former glory. Count ESTC as one of many IT-spending victims from this last earnings cycle.
Be careful out there!
Footnotes
Subscribe for free to get email notifications of future posts!
“Above the 50” (AT50) uses the percentage of stocks trading above their respective 50-day moving averages (DMAs) to measure breadth in the stock market. Breadth defines the distribution of participation in a rally or sell-off. As a result, AT50 identifies extremes in market sentiment that are likely to reverse. Above the 50 is my alternative name for “MMFI” which is a symbol TradingView.com and other chart vendors use for this breadth indicator. Learn more about AT50 on my Market Breadth Resource Page. AT200, or MMTH, measures the percentage of stocks trading above their respective 200DMAs.
Active AT50 (MMFI) periods: Day #194 over 20%, Day #93 over 30%, Day #17 over 40%, Day #12 over 50%, Day #6 over 60% (overperiod), Day #32 under 70%
Source for charts unless otherwise noted: TradingView.com
Full disclosure: long SPY put spread and puts, long IWM shares, call spread; long NVDA strangle
FOLLOW Dr. Duru’s commentary on financial markets via StockTwits, Twitter, and even Instagram!
*Charting notes: Stock prices are not adjusted for dividends. Candlestick charts use hollow bodies: open candles indicate a close higher than the open, filled candles indicate an open higher than the close.


