Stock Market Commentary
The simple and quiet breakout for the stock market found follow-through last week. Both the S&P 500 and the NASDAQ hit fresh all-time highs during the week. The April CPI (consumer price index) report paved the way on Wednesday’s all-time highs. A softer than “expected” number revived hopes for a rate cut right after Federal Reserve Chair Jerome Powell decided not to discuss rate cuts in an interview on monetary policy. While the week ended quietly, the index all-time highs now look set up to prime the pump for upcoming NVDA earnings. The magic of all-time highs in March worked wonders for the rally until April’s pullback. A strong showing from NVDA could help the indices extend the latest magic.
Note well, the optimism and anticipation about rate cuts has been used to explain market rallies almost since the October lows. Seven months in, the Fed has yet to cut rates. In fact, the Fed essentially reversed itself after starting to telegraph rate cuts earlier this year. So at what point do rate cuts fail to matter as a market driver? Perhaps they have long since become a mere excuse to continue buying in a financial market already awash in liquidity.
The Stock Market Indices
The S&P 500 (SPY) climbed the stairs one more step last week and printed a fresh all-time high. While the index flatlined the next two days, the all-time high helps to prime the pump for earnings from NVDA next week. The S&P 500 is helping to set up a bullish context for interpreting the earnings. Note in the chart below how the index has effectively rallied in a straight, albeit slow-moving, line since the beginning of the month. This May looks like yet another month demonstrating how “sell in May and go away” is a throw away adage.
The rally in SPY was strong enough to take me out of a calendar call spread earlier than I wanted. So I refreshed the position with a call and vertical call spread both expiring in the coming week.
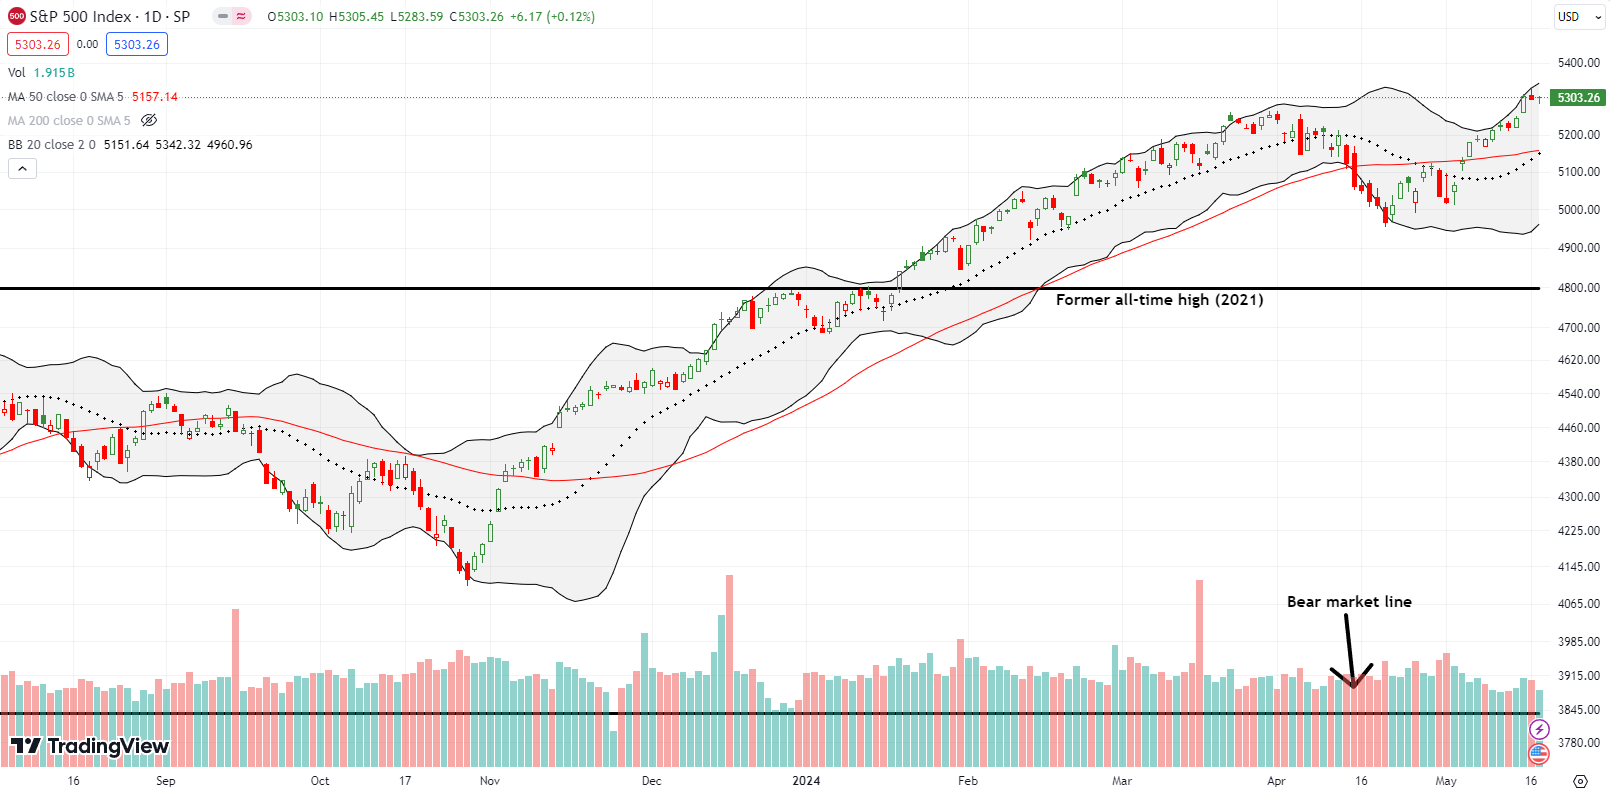
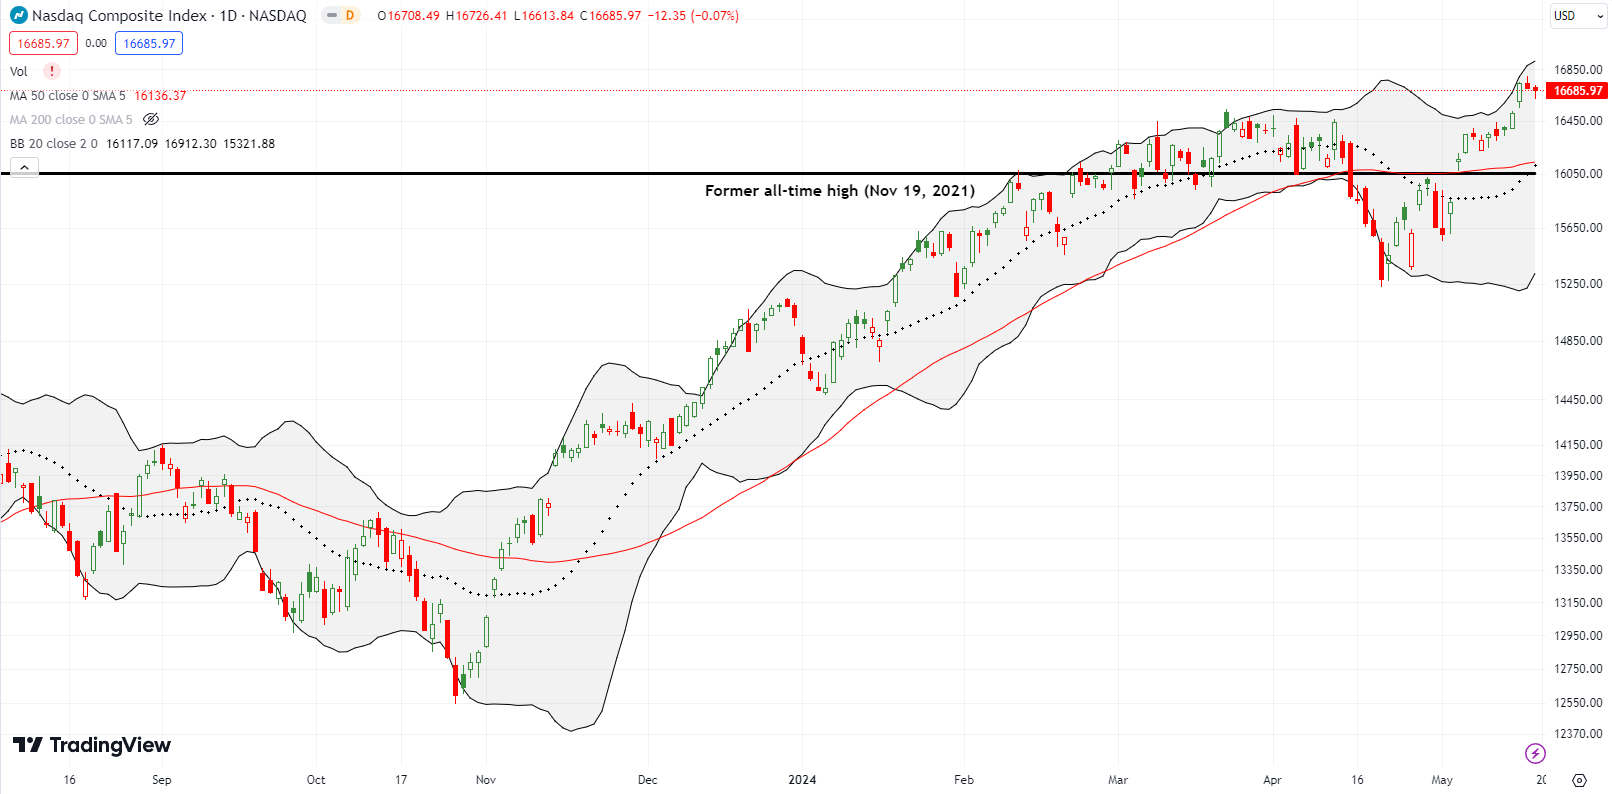
The NASDAQ (COMPQ) is also helping to prime the pump for NVDA earnings with two all-time highs last week. I took profits on a QQQ call spread, but I did not hit the refresh button for the coming week. I want to leave some spare powder to buy a dip; for example, if NVDA disappoints and causes a sympathetic pullback on Thursday and Friday.
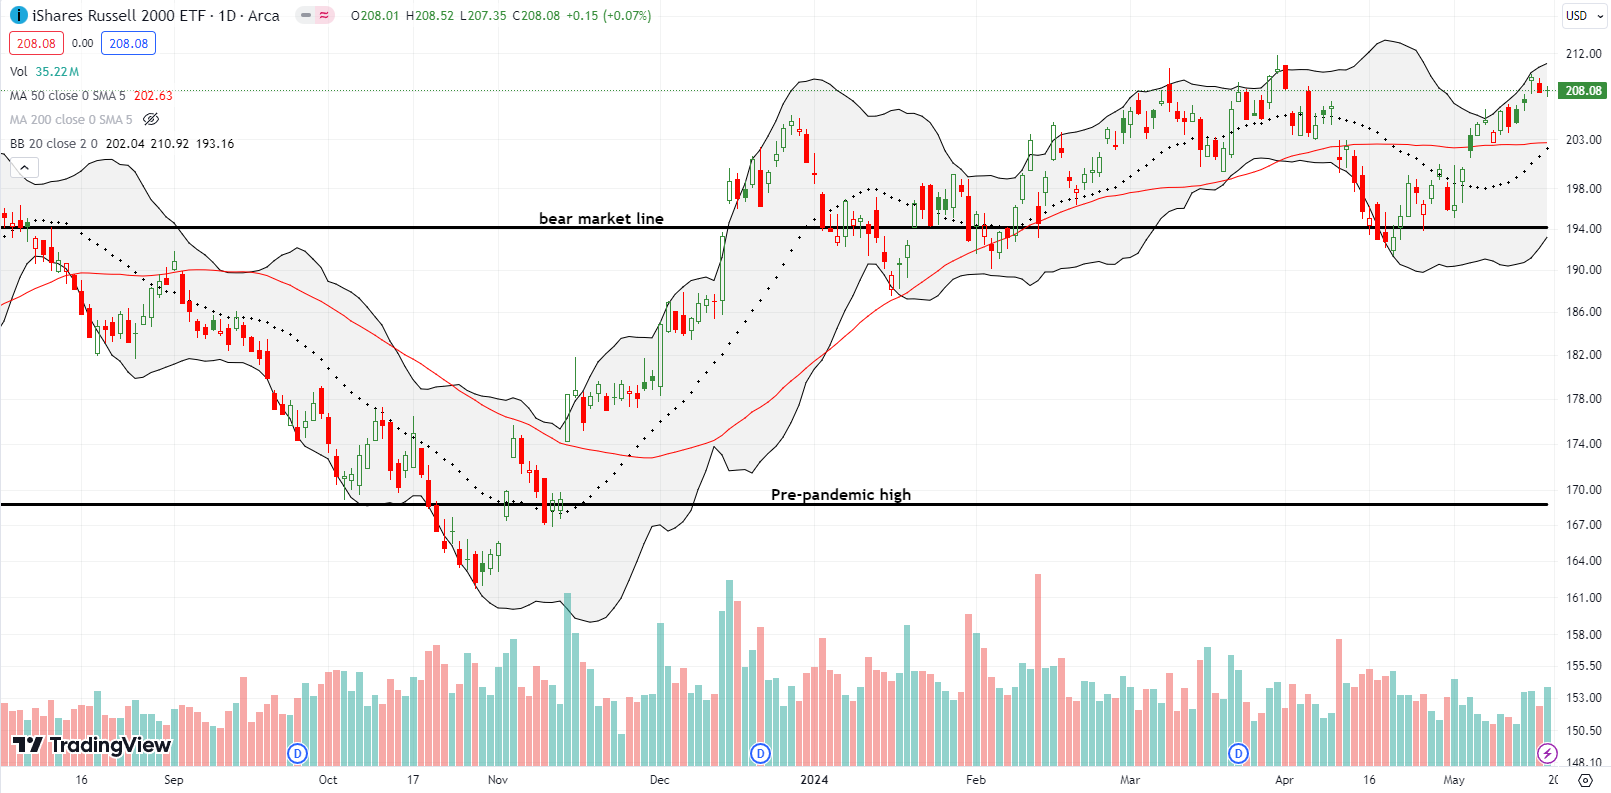
The iShares Russell 2000 ETF (IWM) fell just short of challenging its high for the year. Thus, the ETF of small caps did not enjoy breakout status like the S&P 500 and the NASDAQ. I took profits on an IWM call spread and refreshed my bullishness with a call option expiring in the coming week.
The Short-Term Trading Call With A Prime the Pump
- AT50 (MMFI) = 61.1% of stocks are trading above their respective 50-day moving averages
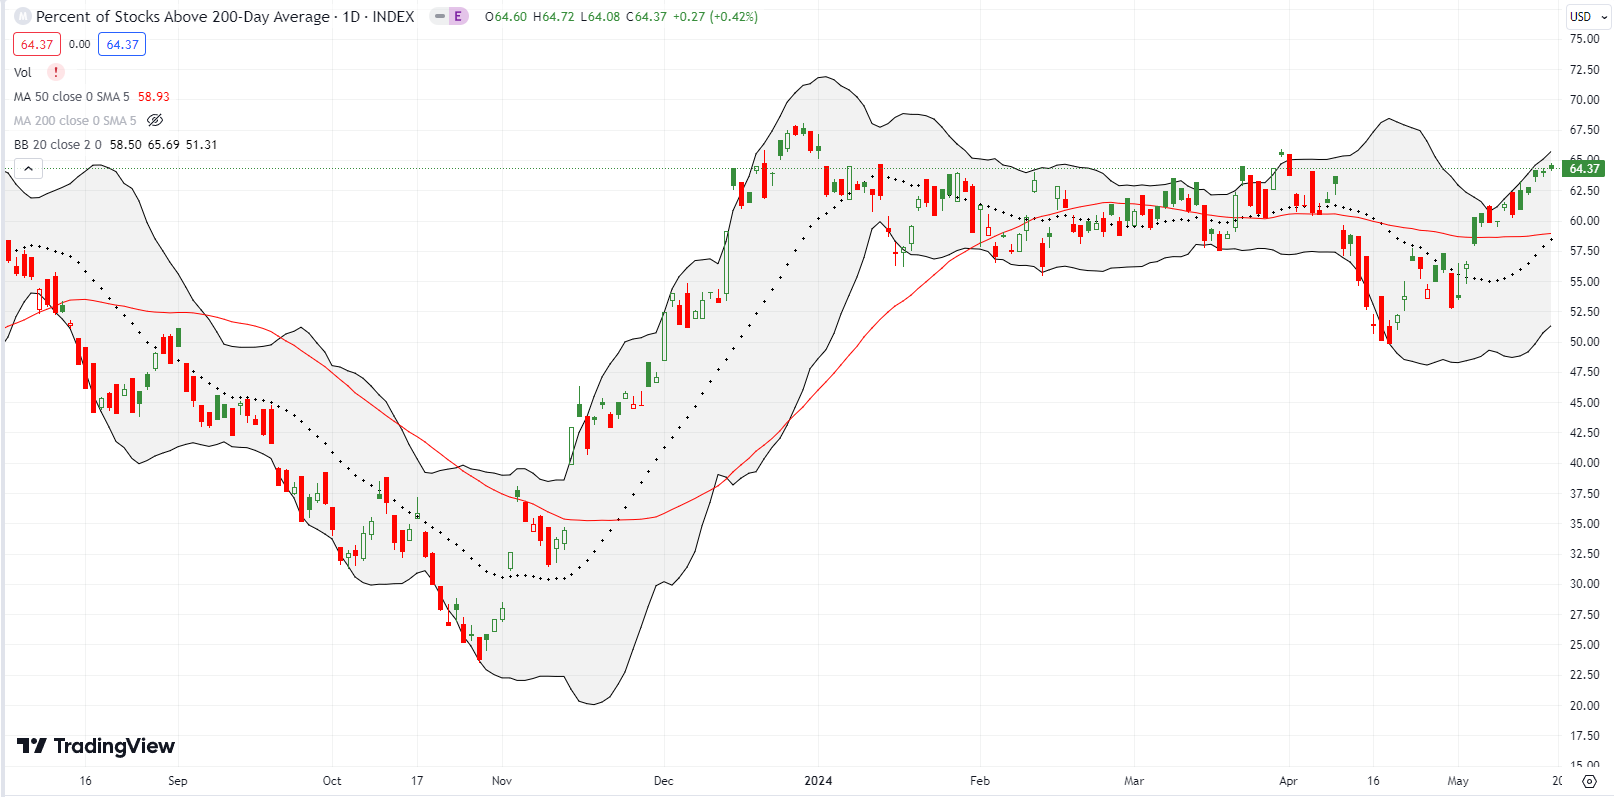
- AT200 (MMTH) = 64.4% of stocks are trading above their respective 200-day moving averages
- Short-term Trading Call: cautiously bullish
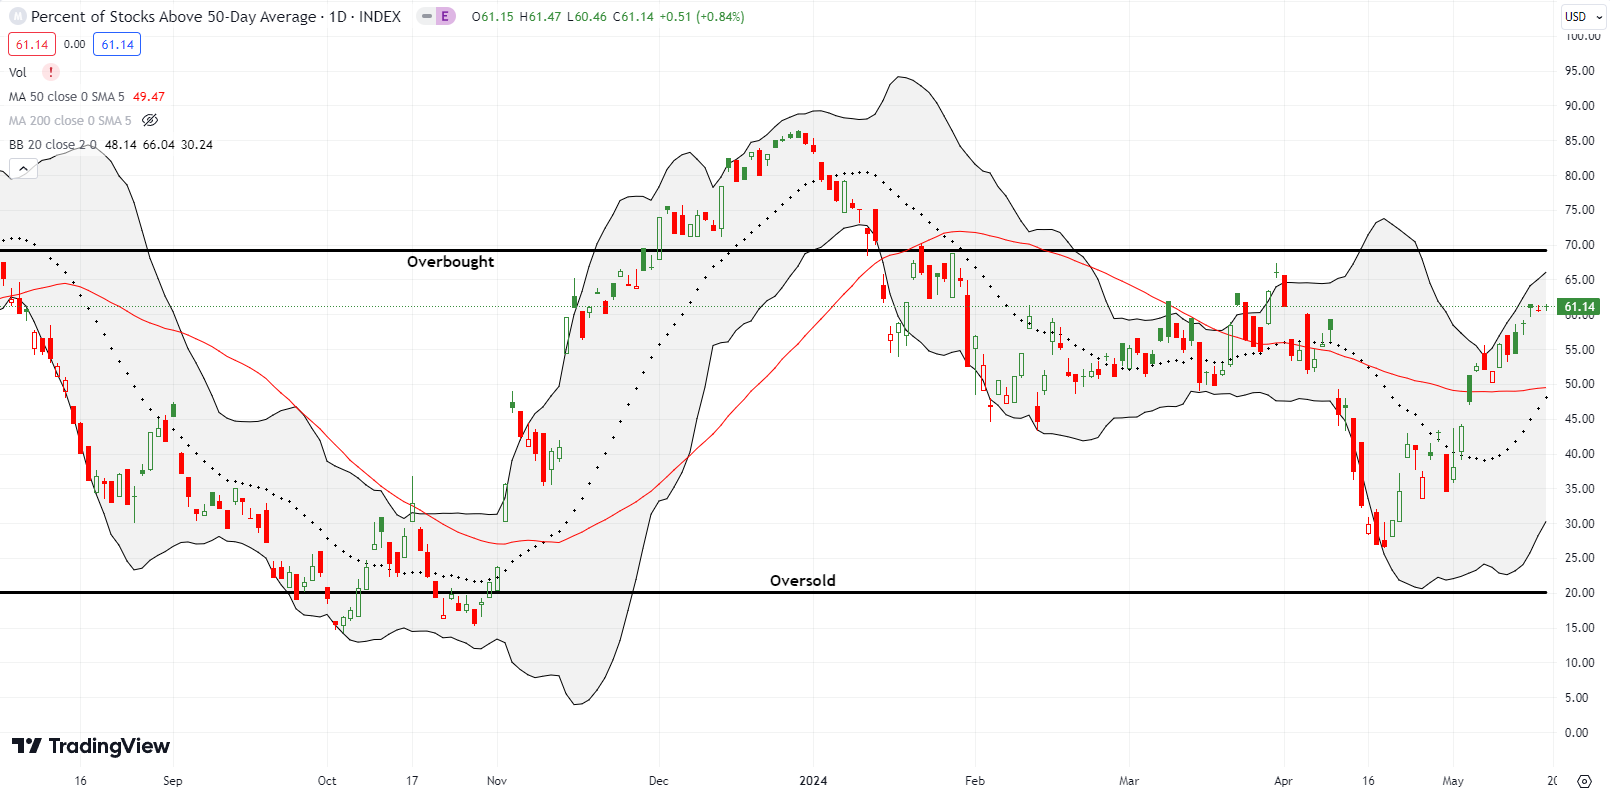
AT50 (MMFI), the percentage of stocks trading above their respective 50DMAs, closed the week at 61.1%. My favorite technical indicator is now within sight of the overbought threshold yet again. April’s failure at the overbought threshold presaged the April sell-off. If AT50 similarly fails at the overbought threshold, I expect another pullback. Regardless, time is ticking on this rally with the volatility index (VIX) descending to levels last seen in the “before times” (pre pandemic). So while all-time highs prime the pump for NVDA earnings, the extremes in the VIX make NVDA in particular vulnerable to even the slightest disappointment. In other words, I am cautiously bullish and bracing myself. As I mentioned last week, if the market continues to rally on a sinking VIX, I will dust off my bullish trading model for extremely low volatility.
The star of the coming week is NVIDIA Corporation (NVDA). I recorded a short video to summarize the technical setup. NVDA has yet to break from a topping pattern that started in early March. Yet, last week, NVDA finally confirmed a bullish breakout above its 50DMA. Thus, bearish and bullish signals are colliding just in time for earnings!
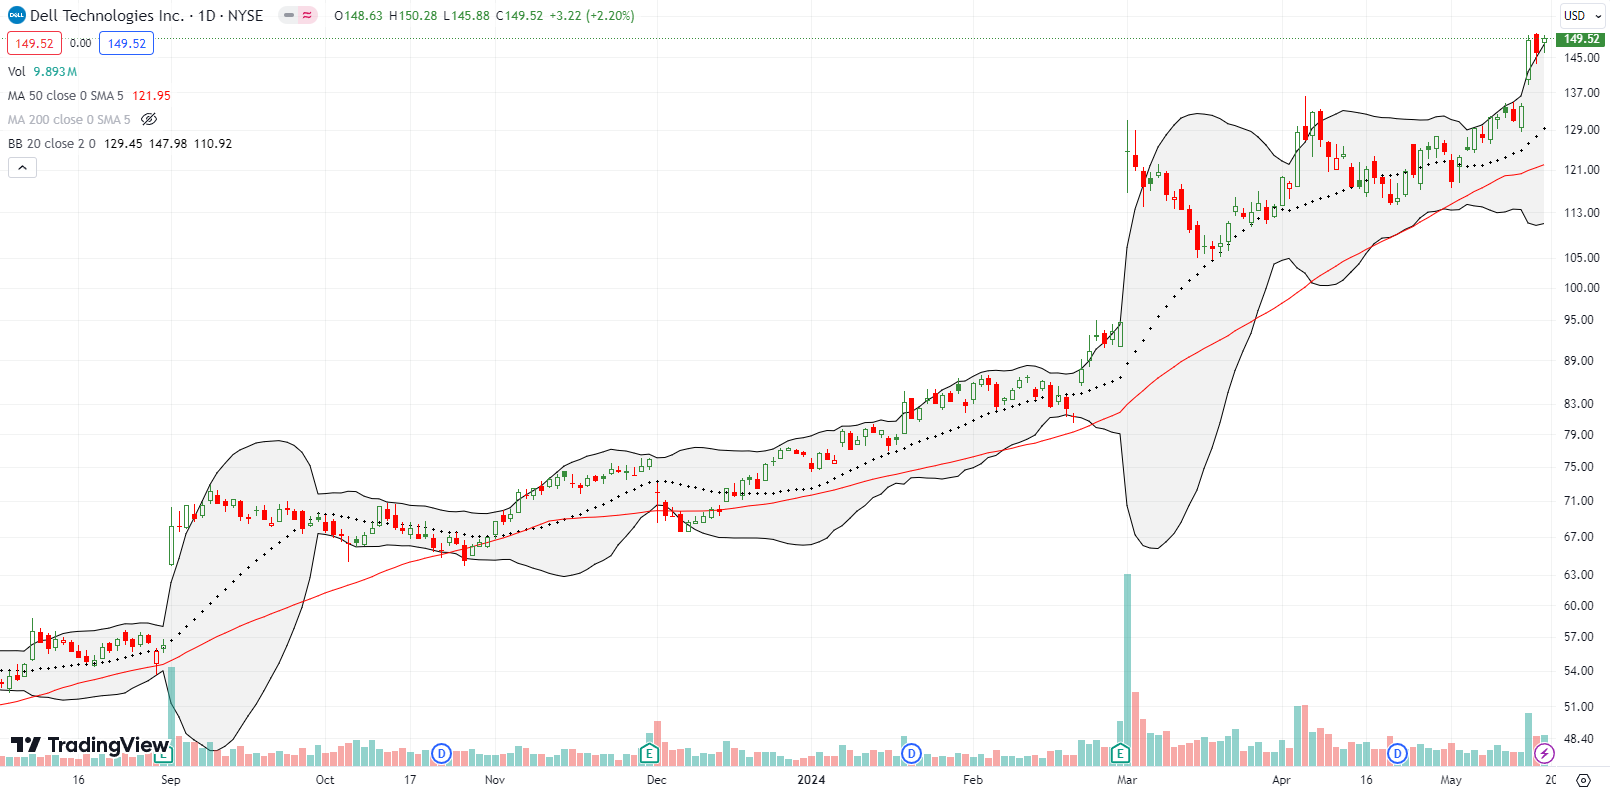
I entered Dell Technologies, Inc (DELL) into my generative AI trade back in March. Thus, I became a permabull on the stock with an aggressive entry strategy. Unfortunately, I forgot to button down my staying power. My resolve dissolved on Monday when DELL took a tiny step back from technical resistance at all-time highs. I sold my call spread to lock in a nice profit. Two days later, DELL soared; it was the kind of move I had been patiently awaiting. I profited greatly from a similar surge in early April. This time, I left a lot of money on the table. Yet one more trading lesson on the books for me!
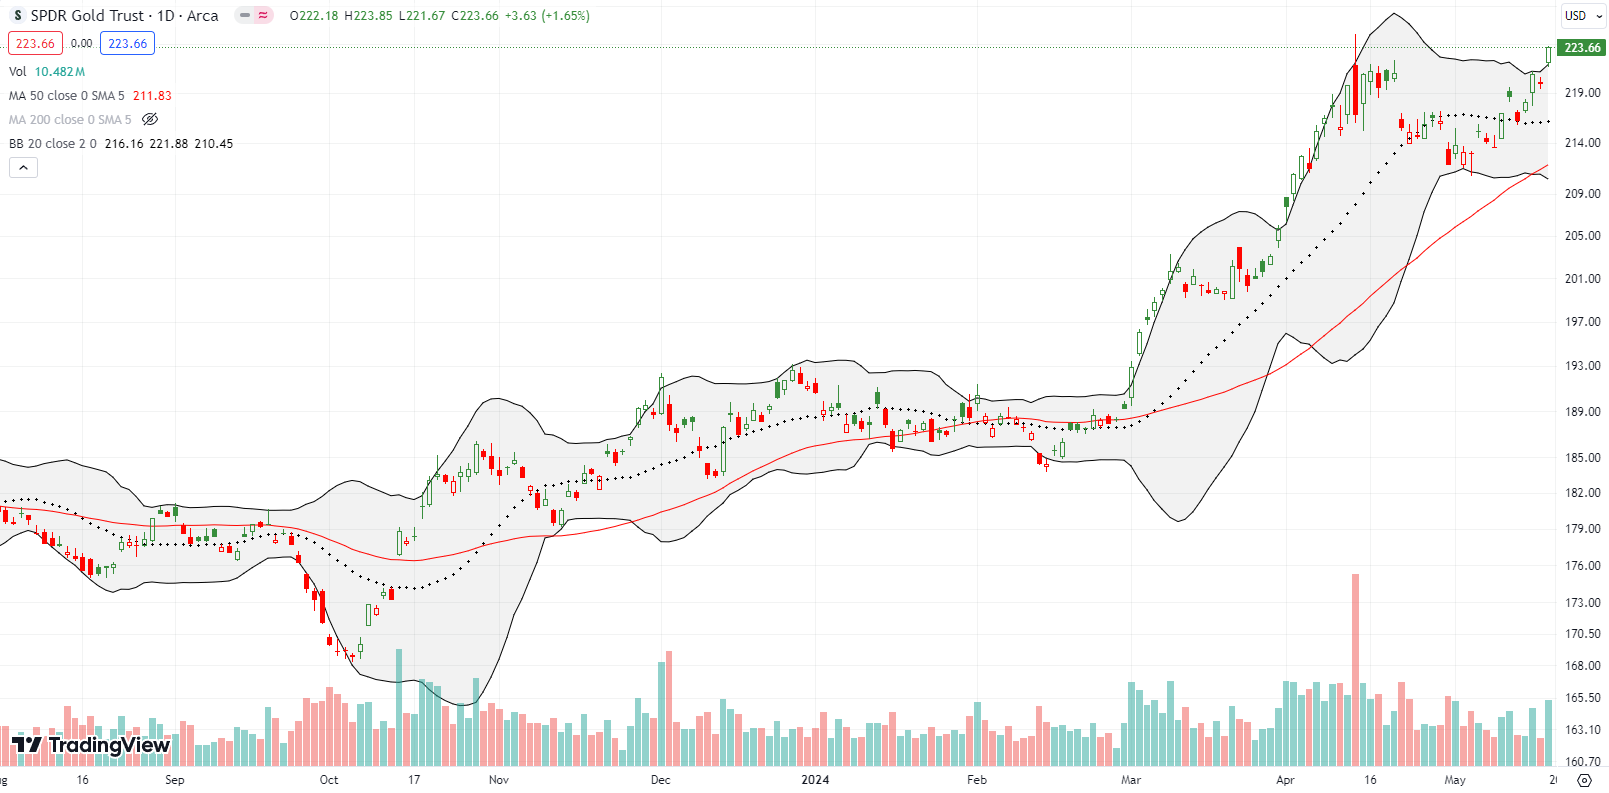
I have remained solidly resolute on gold since the great financial crisis. Last week, the SPDR Gold Trust (GLD) made a new all-time high and overcame last month’s topping pattern. While I did not trade around my core GLD position in this latest up-cycle, I did profit from Pan American Silver Corp (PAAS). From what I keep reading and hearing about Chinese gold buying and growing fears about America’s ballooning budget deficits, GLD (and by extension silver) should offer a lot of winning trades in coming months and perhaps years. And I can only imagine how high gold might go once the country finally cares about Social Security running out of money to fill all its commitments starting around 2035. From the Social Security Administration (emphasis mine):
“Currently, the Social Security Board of Trustees projects program cost to rise by 2035 so that taxes will be enough to pay for only 75 percent of scheduled benefits. This increase in cost results from population aging, not because we are living longer, but because birth rates dropped from three to two children per woman. Importantly, this shortfall is basically stable after 2035; adjustments to taxes or benefits that offset the effects of the lower birth rate may restore solvency for the Social Security program on a sustainable basis for the foreseeable future. Finally, as Treasury debt securities (trust fund assets) are redeemed in the future, they will just be replaced with public debt. If trust fund assets are exhausted without reform, benefits will necessarily be lowered with no effect on budget deficits.“
Good luck Congress!
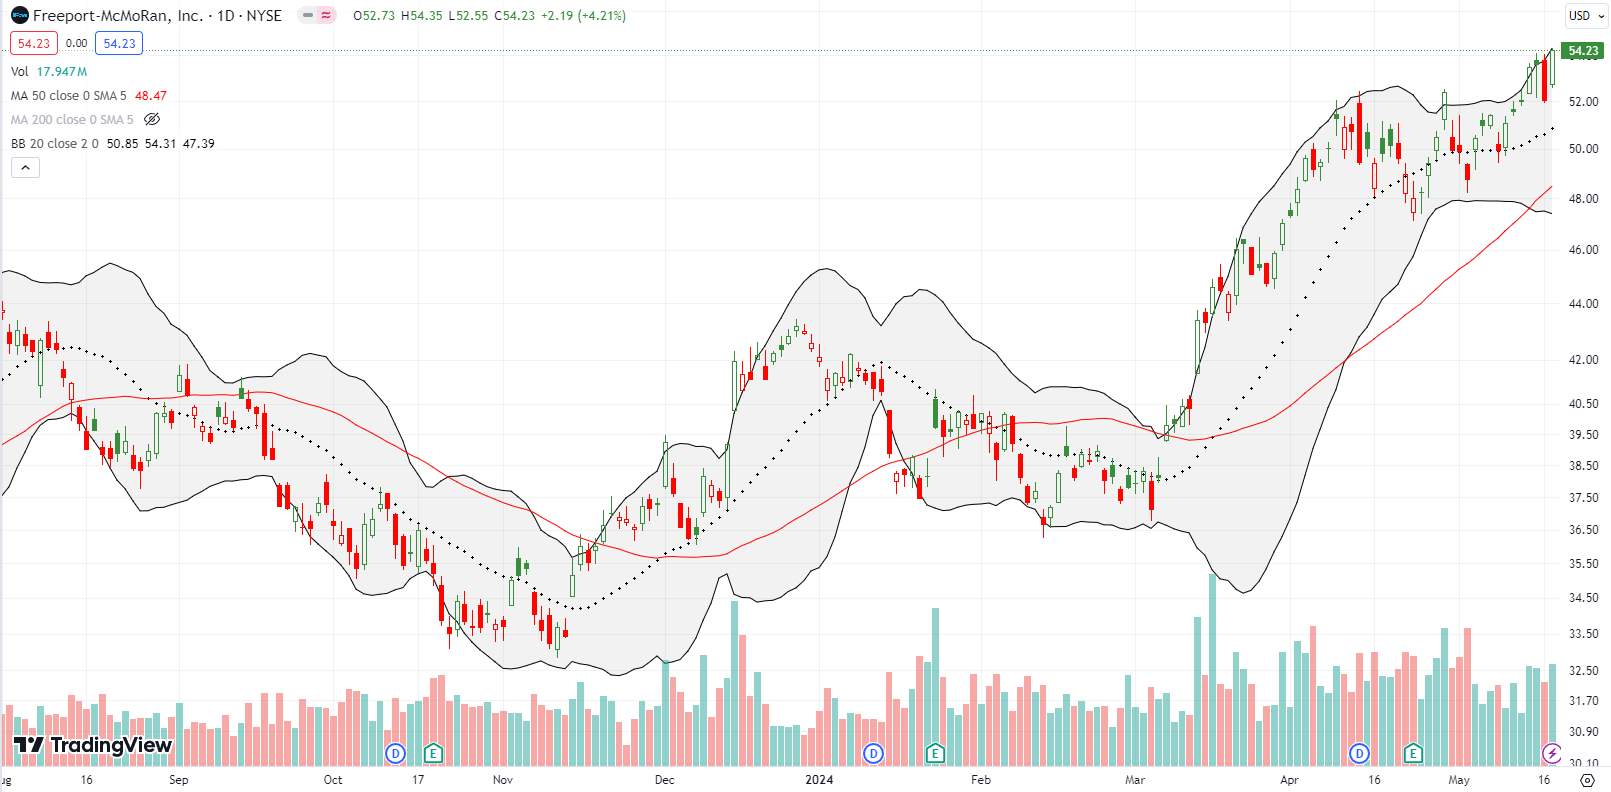
While financial circles endlessly discuss the timing for rate cuts, prices are happily rising and rising in the land of commodities. Gold is at all-time highs and copper is roaring right behind. Copper producer Freeport-McMoRan, Inc (FCX) hit a 14-year high last week. FCX needs to rally another 20% to hit all-time highs.
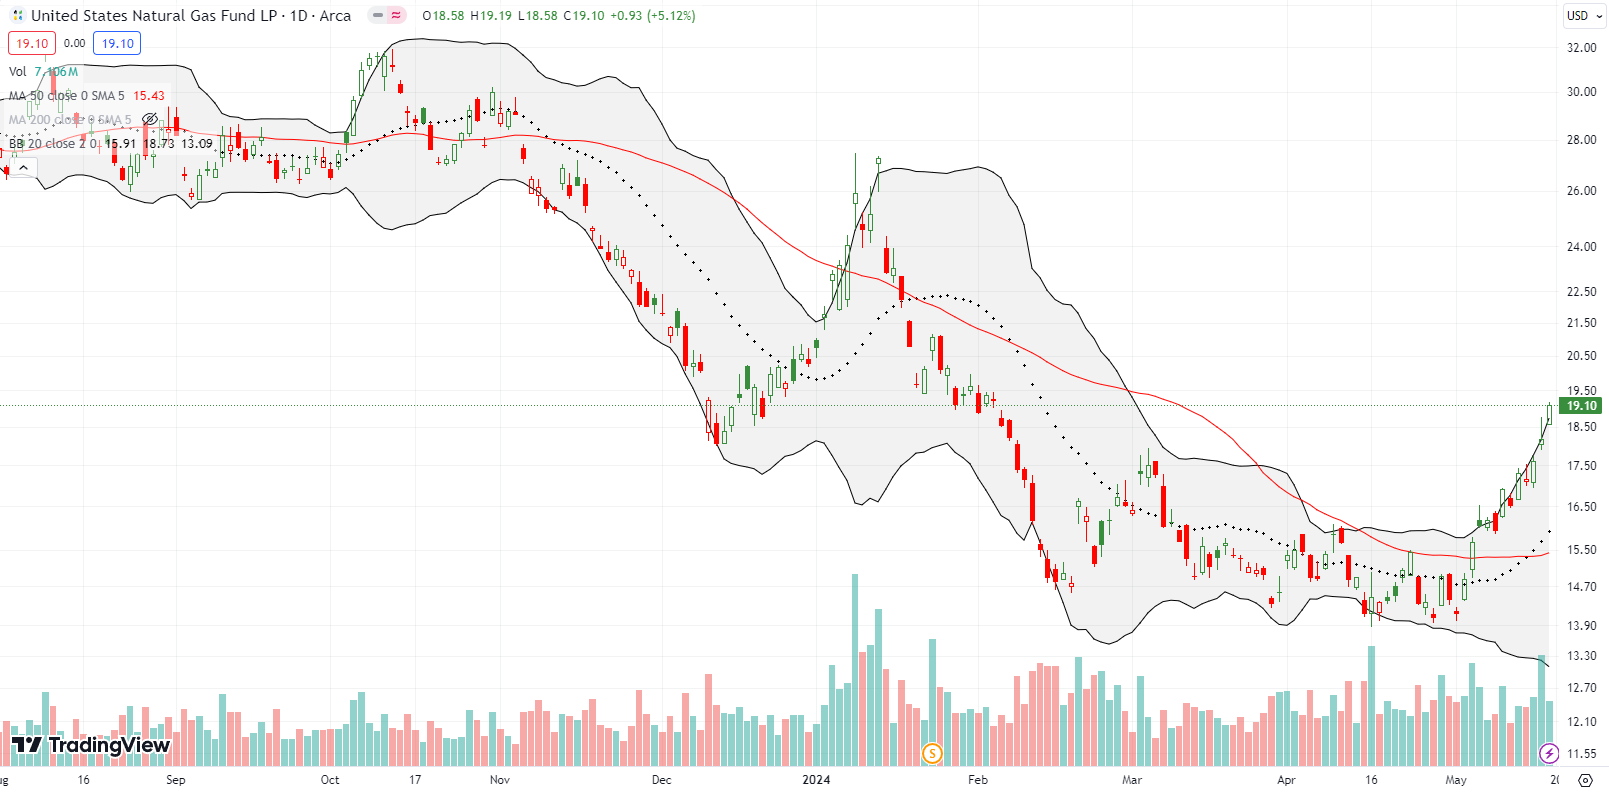
In my last Market Breadth post I described my satisfaction at profiting from a quick trade on the United States Natural Gas Fund LP (UNG). Well, UNG gained another 15.6% last week. Buyers are clearly rushing into natural gas as UNG has hugged its upper Bollinger Band (BB) ever since its bullish 50DMA breakout. Now all I can do is watch; pullbacks in UNG too often take the fund to new all-time lows.
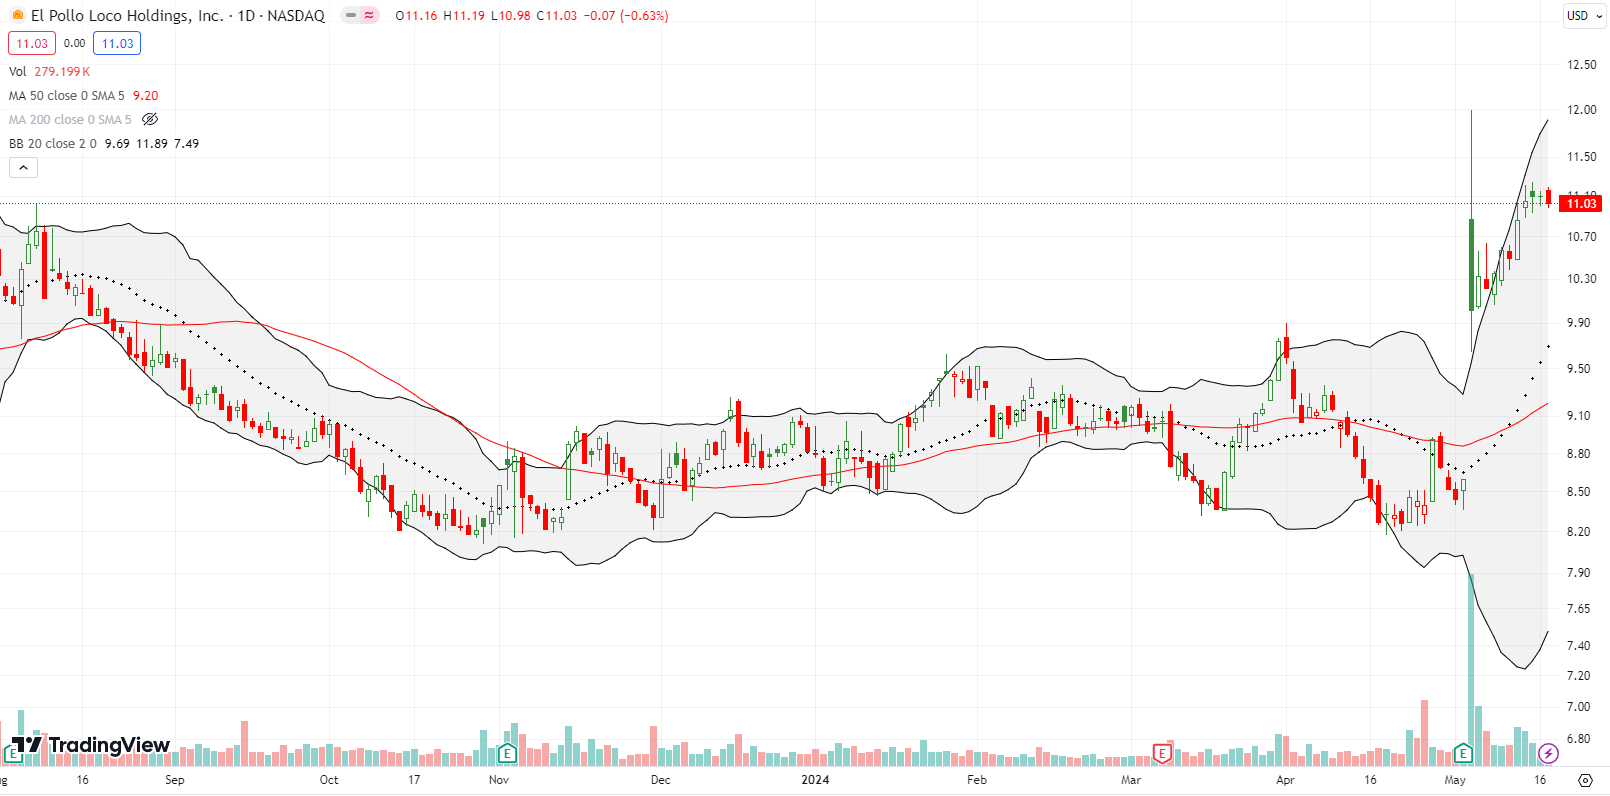
I have not talked about the chicken trade for a long time. My latest position in El Pollo Loco Holdings, Inc (LOCO) went dormant after the October lows. The chickens finally flew the coop, so to speak, with a 16.4% post-earnings pop this month. While sellers sharply faded the intraday high, buyers have slowly but surely continued to push LOCO higher. The malaise could be over if/once LOCO pops above the post-earnings intraday high.
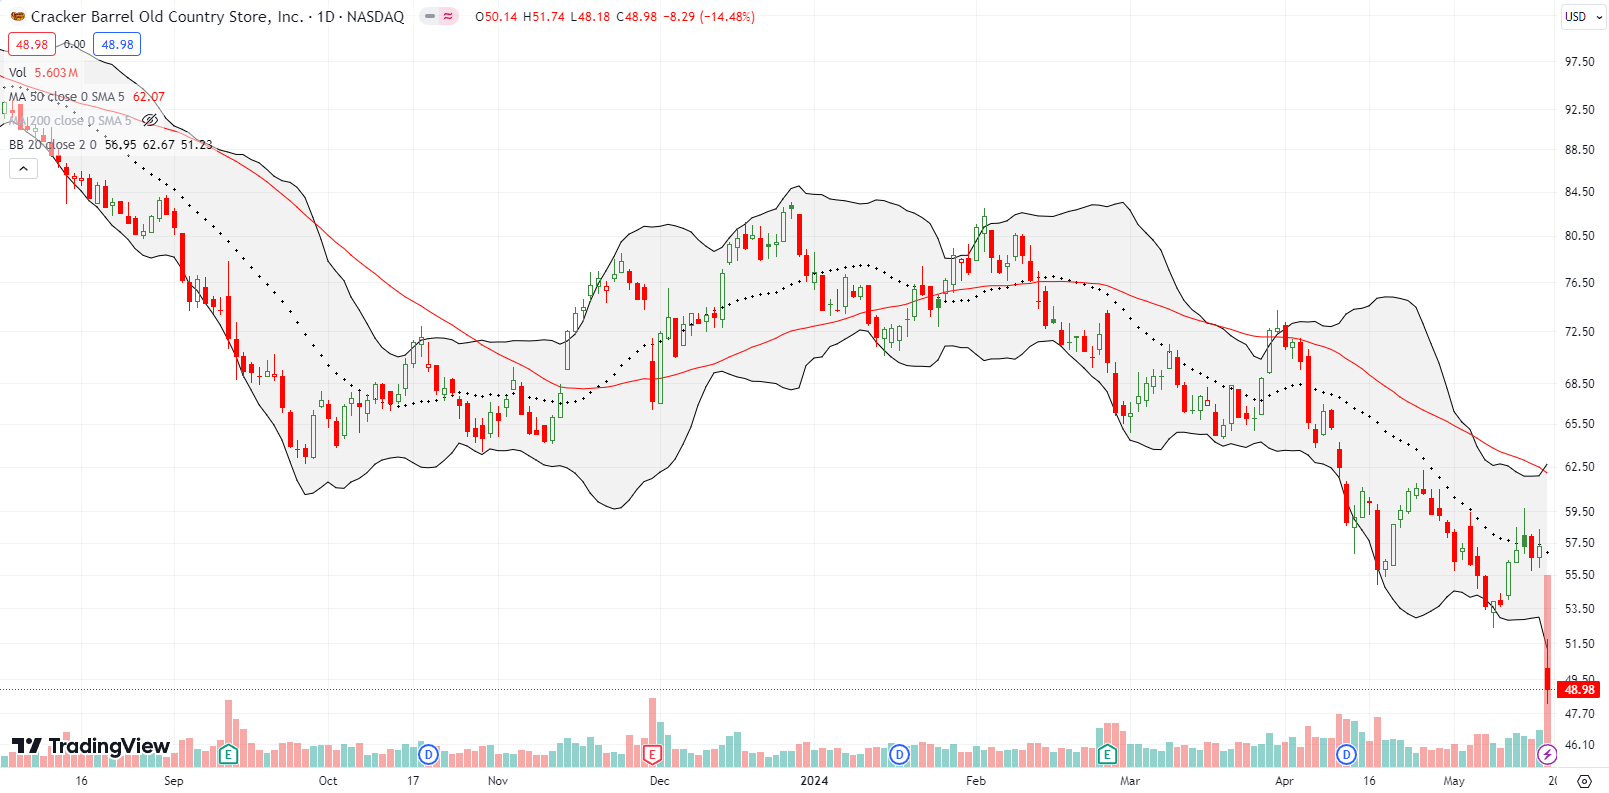
Back in December, I recorded a trade tutorial on how to bottom-fish for stocks. Cracker Barrel Old Country Store, Inc (CBRL) looked like a perfect setup especially being a favorite spot in the fast-growing U.S. South. Or so I thought. The bottom held for a little over a month, and I held the stock too long. After surviving the first 50DMA breakdown, I became over-confident in the trade. I finally dropped the position on Friday after Cracker Barrel reduced guidance and cut its dividend. While I have a rule against selling in the middle of a panic, this double-blow of bad news forced my hand. CBRL now trades at a 12 1/2 year low. Quite a fall from grace!
Be careful out there!
Footnotes
Subscribe for free to get email notifications of future posts!
“Above the 50” (AT50) uses the percentage of stocks trading above their respective 50-day moving averages (DMAs) to measure breadth in the stock market. Breadth defines the distribution of participation in a rally or sell-off. As a result, AT50 identifies extremes in market sentiment that are likely to reverse. Above the 50 is my alternative name for “MMFI” which is a symbol TradingView.com and other chart vendors use for this breadth indicator. Learn more about AT50 on my Market Breadth Resource Page. AT200, or MMTH, measures the percentage of stocks trading above their respective 200DMAs.
Active AT50 (MMFI) periods: Day #122 over 20%, Day #21 over 30%, Day #12 over 40%, Day #10 over 50%, Day #3 over 60% (overperiod), Day #89 under 70% (underperiod)
Source for charts unless otherwise noted: TradingView.com
Full disclosure: long SPY call spread and call, long IWM call, long NVDA diagonal call spread, long GLD, long FCX call, long LOCO
FOLLOW Dr. Duru’s commentary on financial markets via StockTwits, Twitter, and even Instagram!
*Charting notes: Stock prices are not adjusted for dividends. Candlestick charts use hollow bodies: open candles indicate a close higher than the open, filled candles indicate an open higher than the close.


