Stock Market Commentary
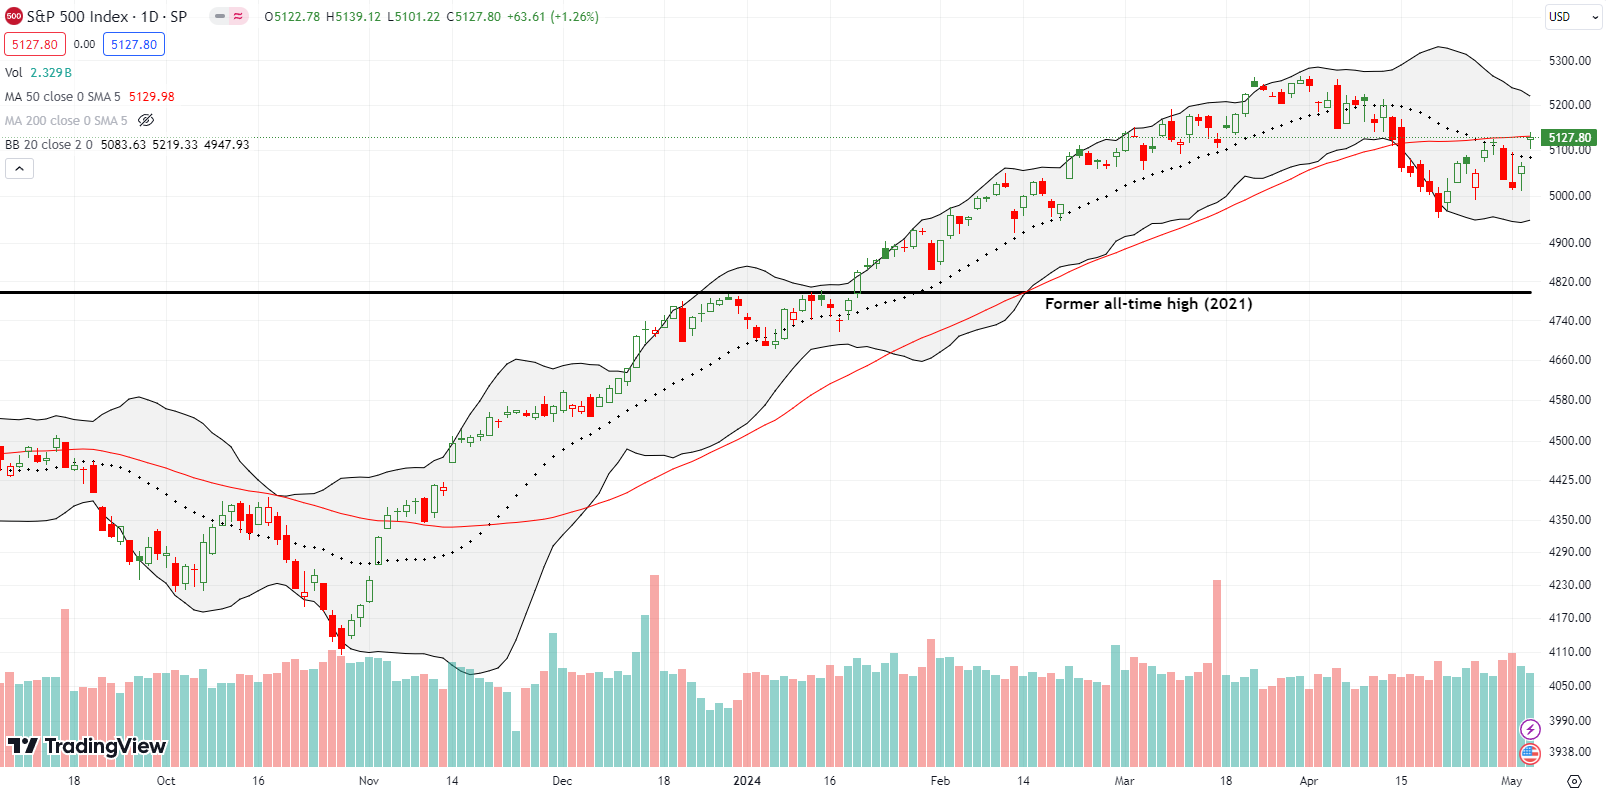
In the prior week a post-earnings pricequake from Meta Platforms (META) dominated the stock market headlines. Last week, an Apple buyquake dominated the headlines and week-ending trading after the company announced a record $110B buyback. The subsequent gain in AAPL turned my simple test dividing bearish and bullish trading action into a more complicated calculation. At the time, both the S&P 500 and the NASDAQ were testing resistance at their 50-day moving averages (DMAs). Both indices started the week failing the test, but their rebounds were too swift to allow for aggressive bearish trades. The week ended with a new and not so simple test thanks to the Apple buyquake helping to gap the indices higher. The test is complicated by a NASDAQ breakout that left the S&P 500 behind and still under 50DMA resistance.
The fundamental driver of the weak end of April is anyone’s guess. Sure, worker compensation costs increased in Q1 more than “expected”, but the Chicago PMI (purchasing manager’s index) for April was also weaker than expected. Pick a poison between inflation for longer and higher rates, weakening economic conditions and rate cuts on the way, or stagflation. The bond market chose higher rates and stocks complied with a sell-off.
May started with another Fed day. With so many murmurs about the small chance for rate hikes in the wake of a quarter of higher than desired inflation readings, the Fed meeting was set up well for major market relief. Fed Chair Jerome Powell delivered by taking rate hikes off the table and announcing a slowdown in quantitative tightening. The market initially rallied, but sellers soon faded stocks as their last stand of the week. Buyers took back control from there especially after a weaker than “expected” jobs report for April seemed to confirm rate hikes are off the table. Perhaps rate cuts are even still on schedule.
The Stock Market Indices
The S&P 500 (SPY) ended April with a 1.6% pullback and a 4.2% total loss for the month – the index’s largest monthly loss since last September. The drop confirmed resistance at the converged 50-day moving average (DMA) (the red line) and the 20DMA (the dashed line). Yet, the 0.3% post-Fed loss was not convincing follow-through. Sure enough, buyers ran the S&P 500 through the 20DMA and into 50DMA resistance to close the week. Just one more nudge higher and the index could soon test its all-time high set on March 28th.
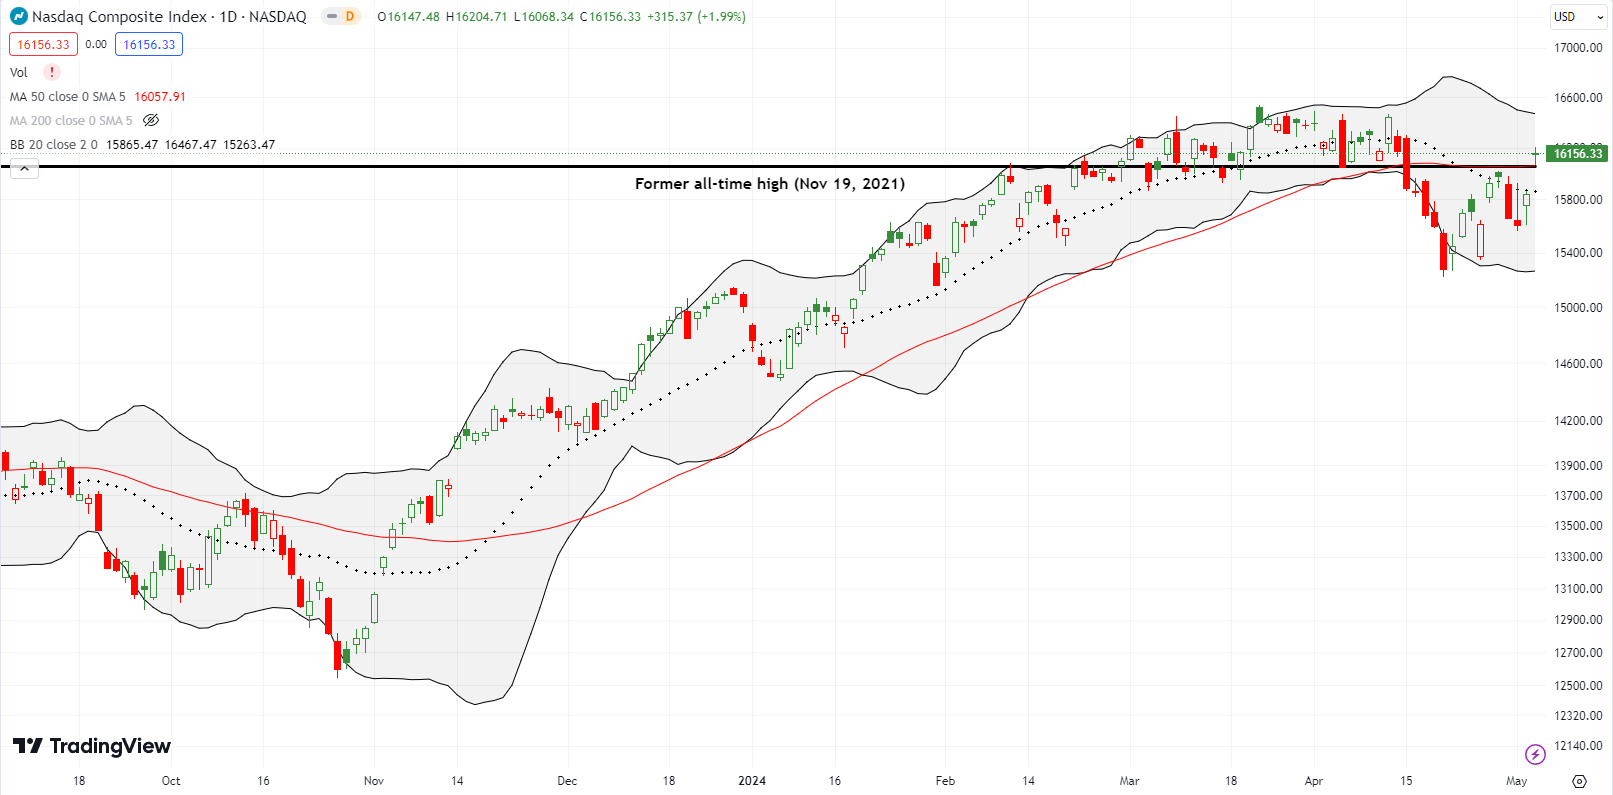
The Apple buyquake cleared the NASDAQ (COMPQ) above its 50DMA hurdle on Friday with a gap up and 2.0% gain. Resistance at the 50DMA neatly coincided with the former all-time high from November 19, 2021. An easy path is open for challenging the all-time high and rallying further.
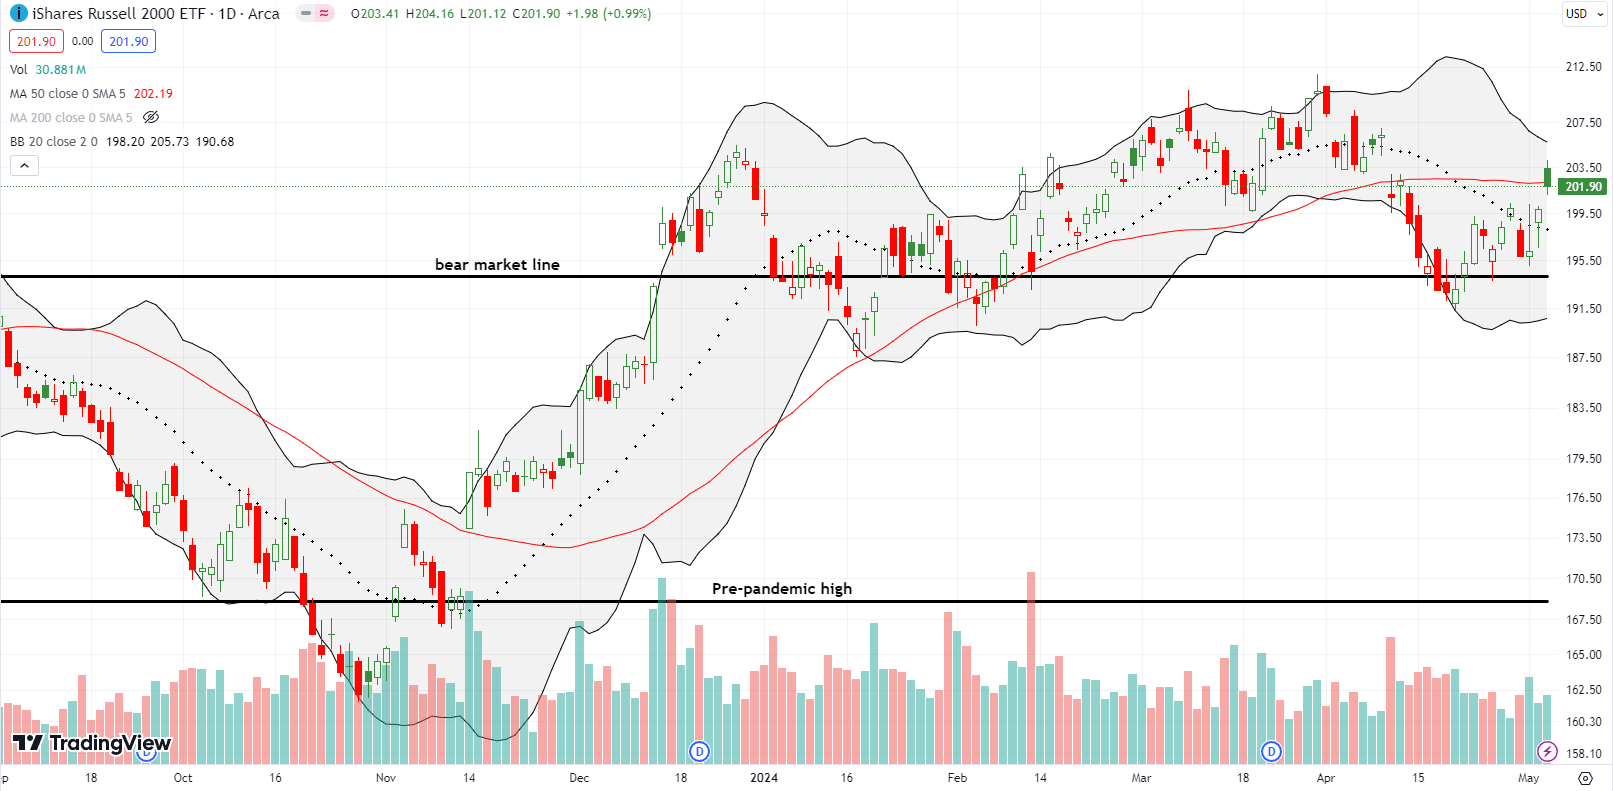
The iShares Russell 2000 ETF (IWM) also cleared its 50DMA hurdle, more or less. Sellers faded the gap open but the ETF of small caps held its own at 50DMA support. My IWM call spread hit its initial profit target and closed out. I think I can simplify IWM’s test to a higher close confirms fresh bullishness, and a lower close creates a bearish fake out.
The Short-Term Trading Call With An Apple Buyquake
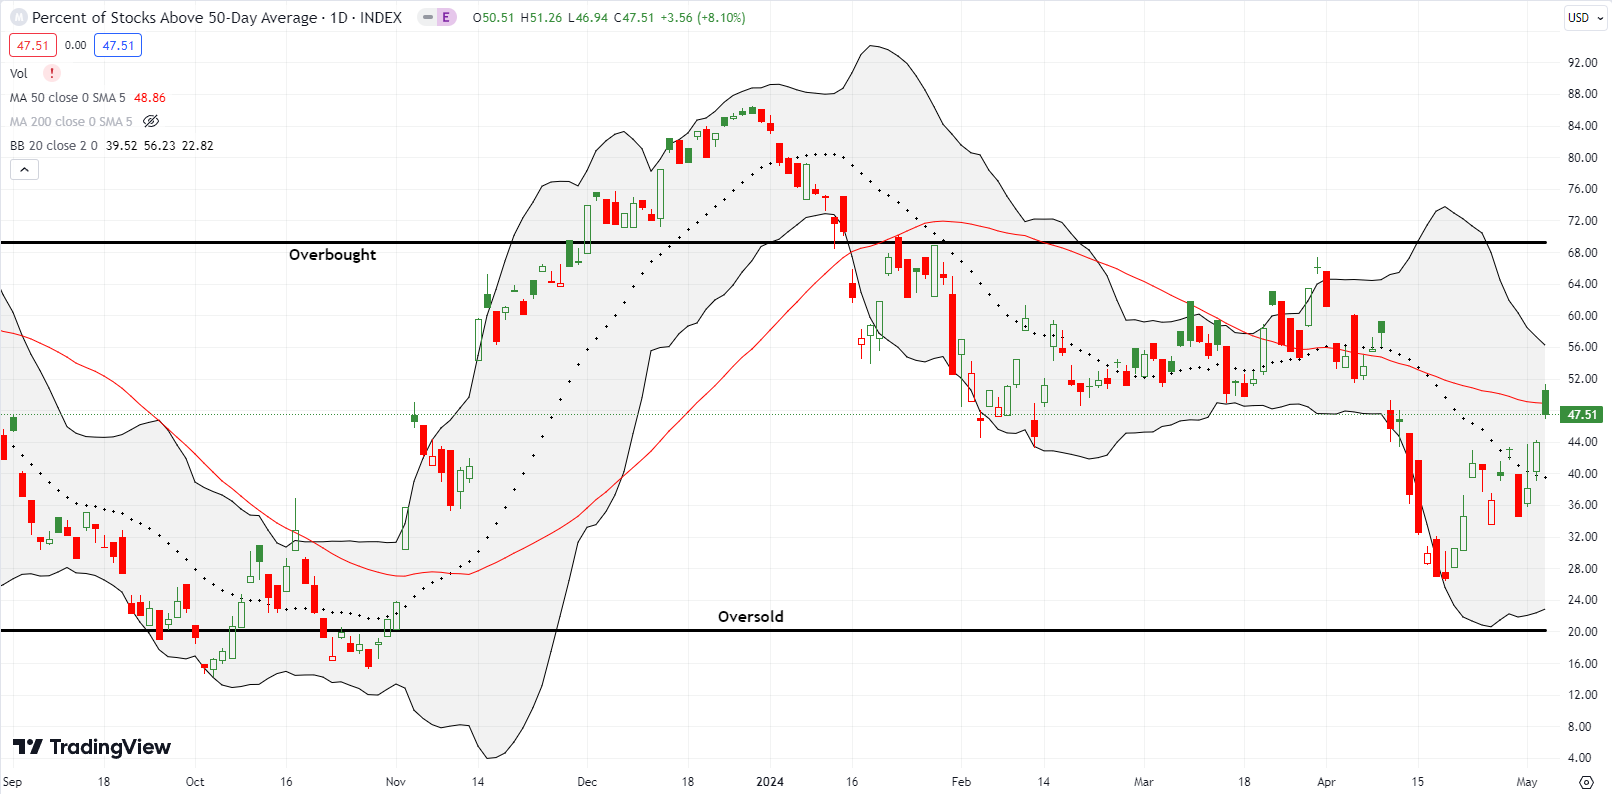
- AT50 (MMFI) = 47.5% of stocks are trading above their respective 50-day moving averages
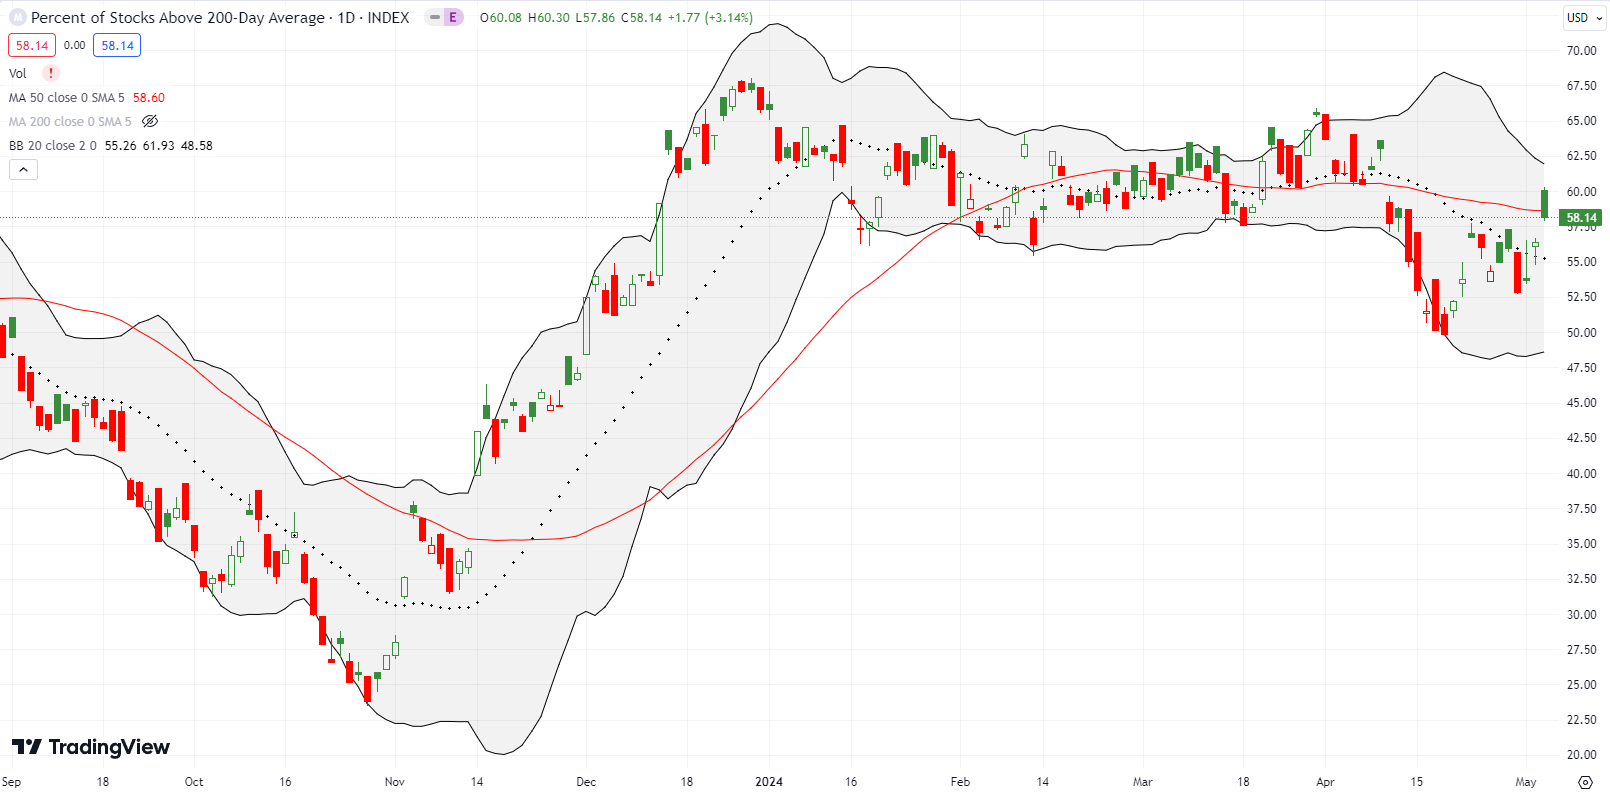
- AT200 (MMTH) = 58.1% of stocks are trading above their respective 200-day moving averages
- Short-term Trading Call: neutral
AT50 (MMFI), the percentage of stocks trading above their respective 50DMAs, closed at 47.5%. My favorite technical indicator resumed the rebound that began just above the oversold threshold at the April low. By responding with an “oversold enough” bounce, the market reaffirmed its bullish bias even with the stain of April still fresh in the rearview mirror. My short-term trading call stays at neutral until the now not so simple test resolves.
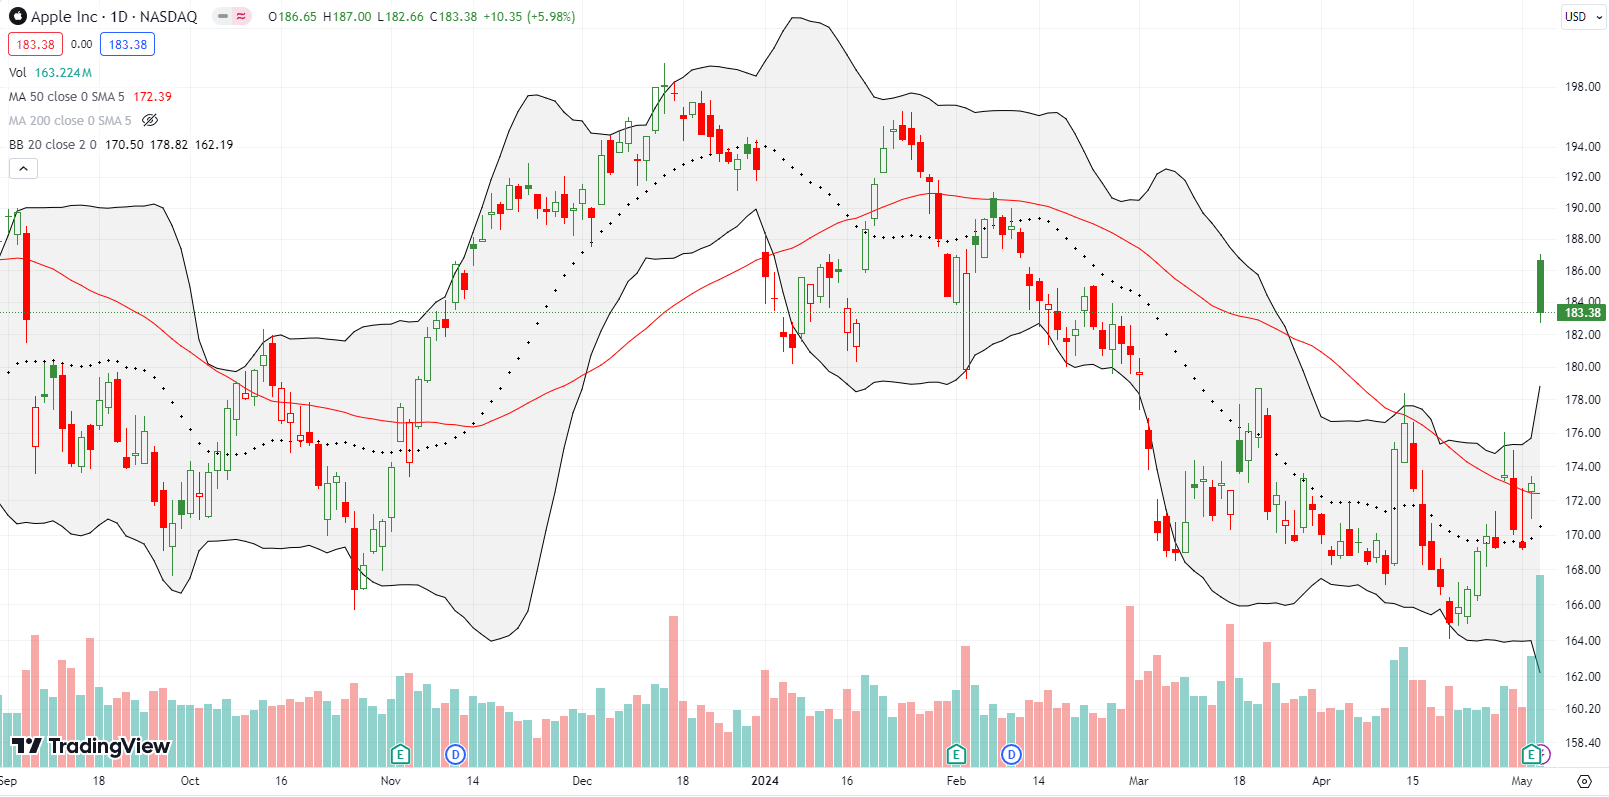
The AAPL buyquake added an exclamation point to the over-extended negativity. Apple Inc (AAPL) made a bid to recapture the hearts and minds of traders and investors with a massive $110B buyback and an increase in its dividend. The subsequent cheer sent AAPL higher by 6.0% and stretched well above its upper Bollinger Band (BB).
Next up is an Apple event on May 7th at 7am Pacific (right after Disney earnings…hmmm). The news will need to be exceptionally good to keep AAPL levitating in this over-stretched condition. Still, this confirmed 50DMA breakout is a bullish development for AAPL. I recorded a YouTube short to explain the impact of AAPL’s buybacks over the years….
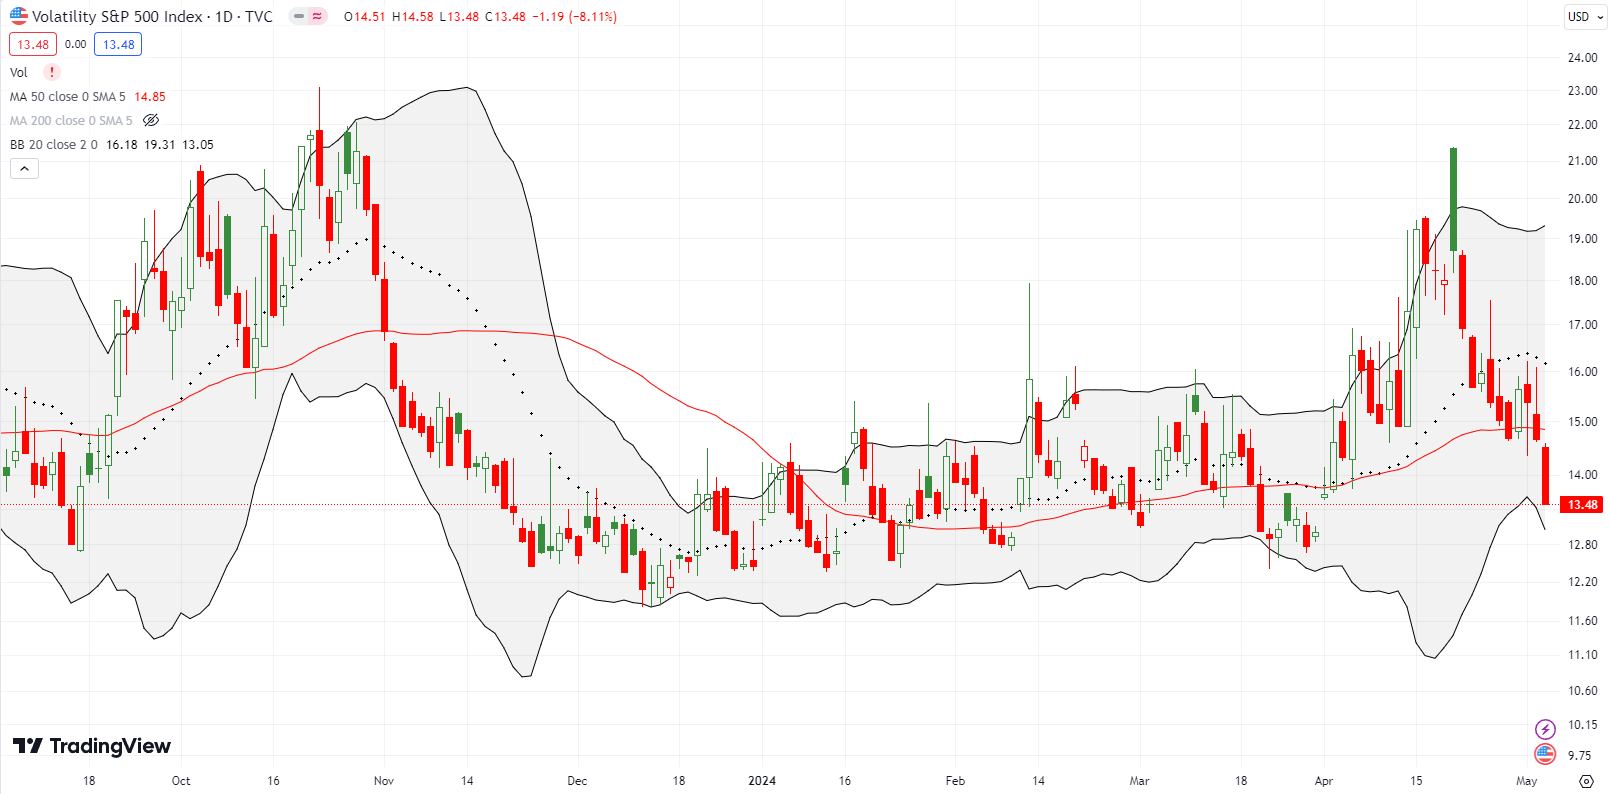
The Apple buyquake contributed to the week’s relief that sent the volatility index (VIX) packing to the basement. Faders and volatility sellers were in full control most of the week. The VIX finished reversing almost all its gains from April. This reversal also brings an end to the VIX’s 2024 uptrend. Now I expect the VIX to return to obscurity. I will look back wistfully on the day I noticed the VIX mattered again.
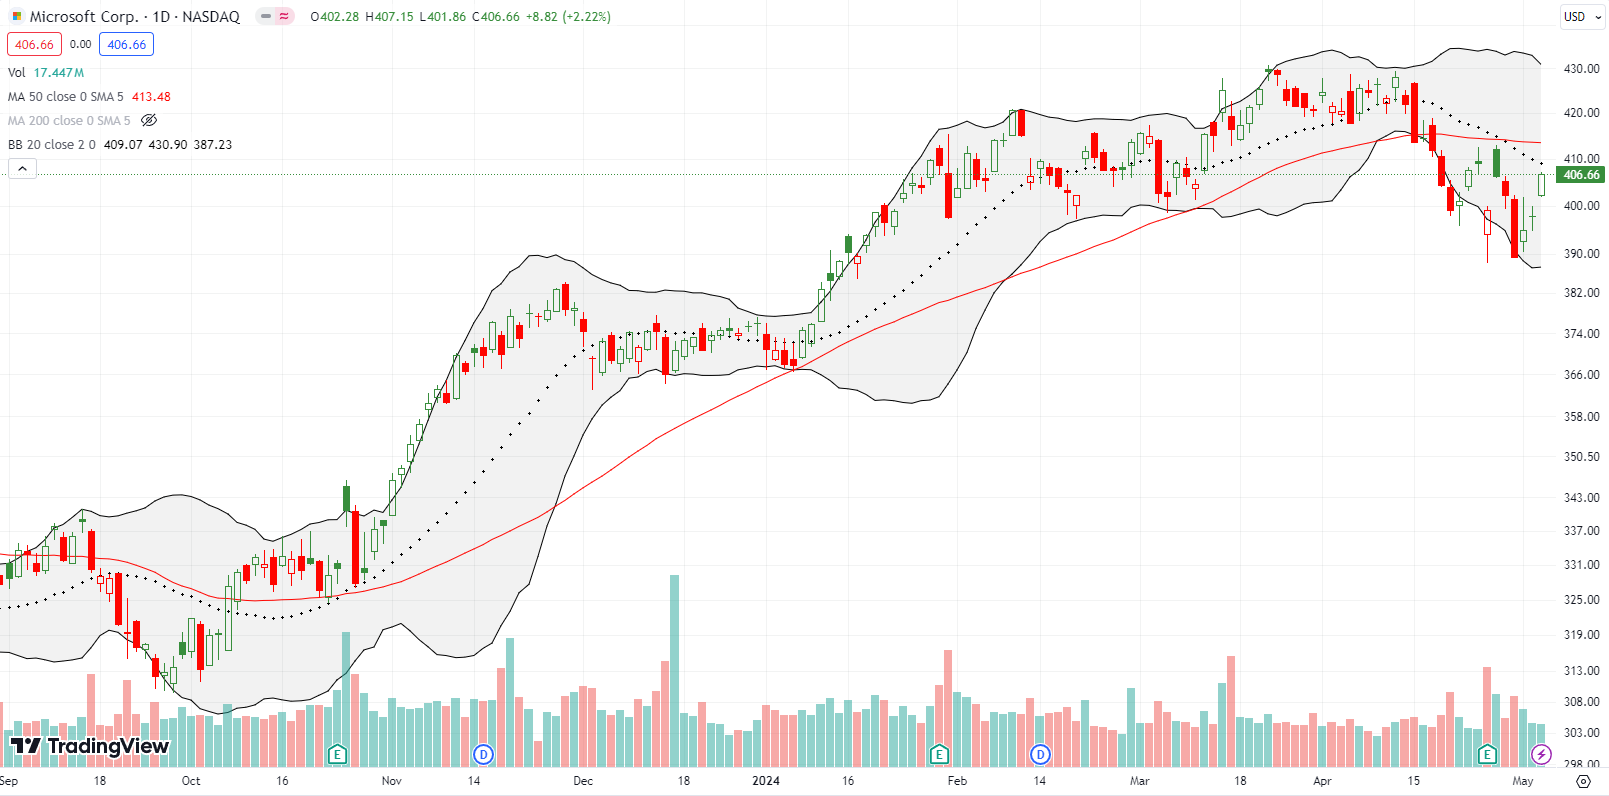
Microsoft Corp (MSFT) is doing its best to drag on S&P 500 performance as expected. In the previous week, MSFT gapped higher 1.8% post-earnings but failed at converged 20DMA and 50DMA resistance. Sellers were persistent enough to reverse those gains and then some. MSFT ended April at a 3 1/2 month low. The rebound from there has yet to break through the downtrending 20DMA much less the 50DMA. I have not bought into MSFT in a while as part of the generative AI trade. I will get aggressive again on a close above the 50DMA.
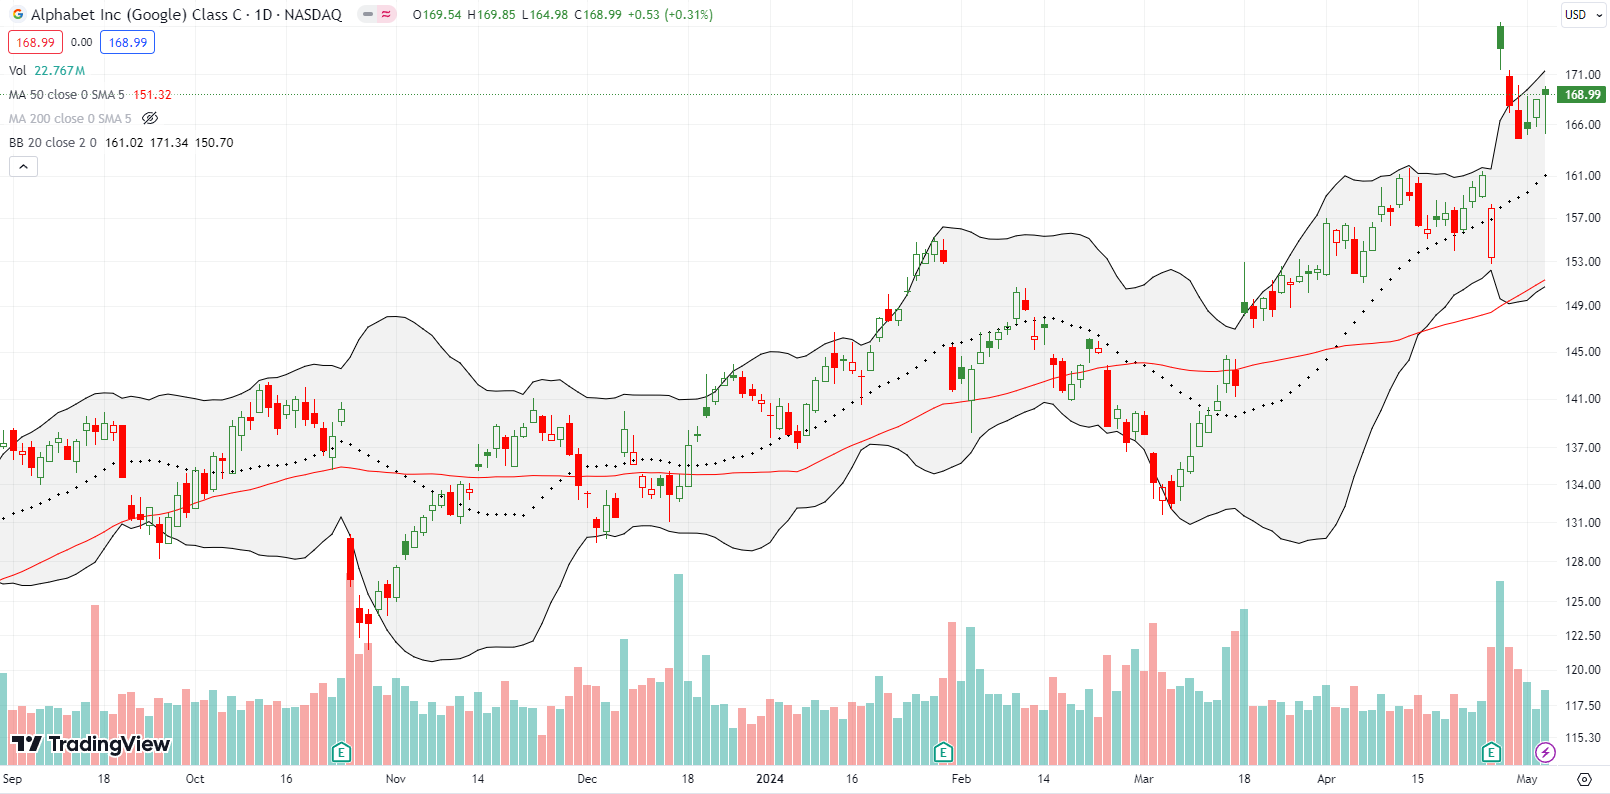
I stayed aggressive on Alphabet (GOOG) and grabbed call options and spreads to buy into its post-earnings fade before a test of 20DMA support. So far, so good, but the gains look tenuous with GOOG struggling to close higher on Friday. The market is understandably nervous about the imminent outcome of Alphabet’s “monopoly power” case with the U.S. Justice Department. Note also that the gap down from the post-earnings pop created a kind of bearish abandoned baby top.
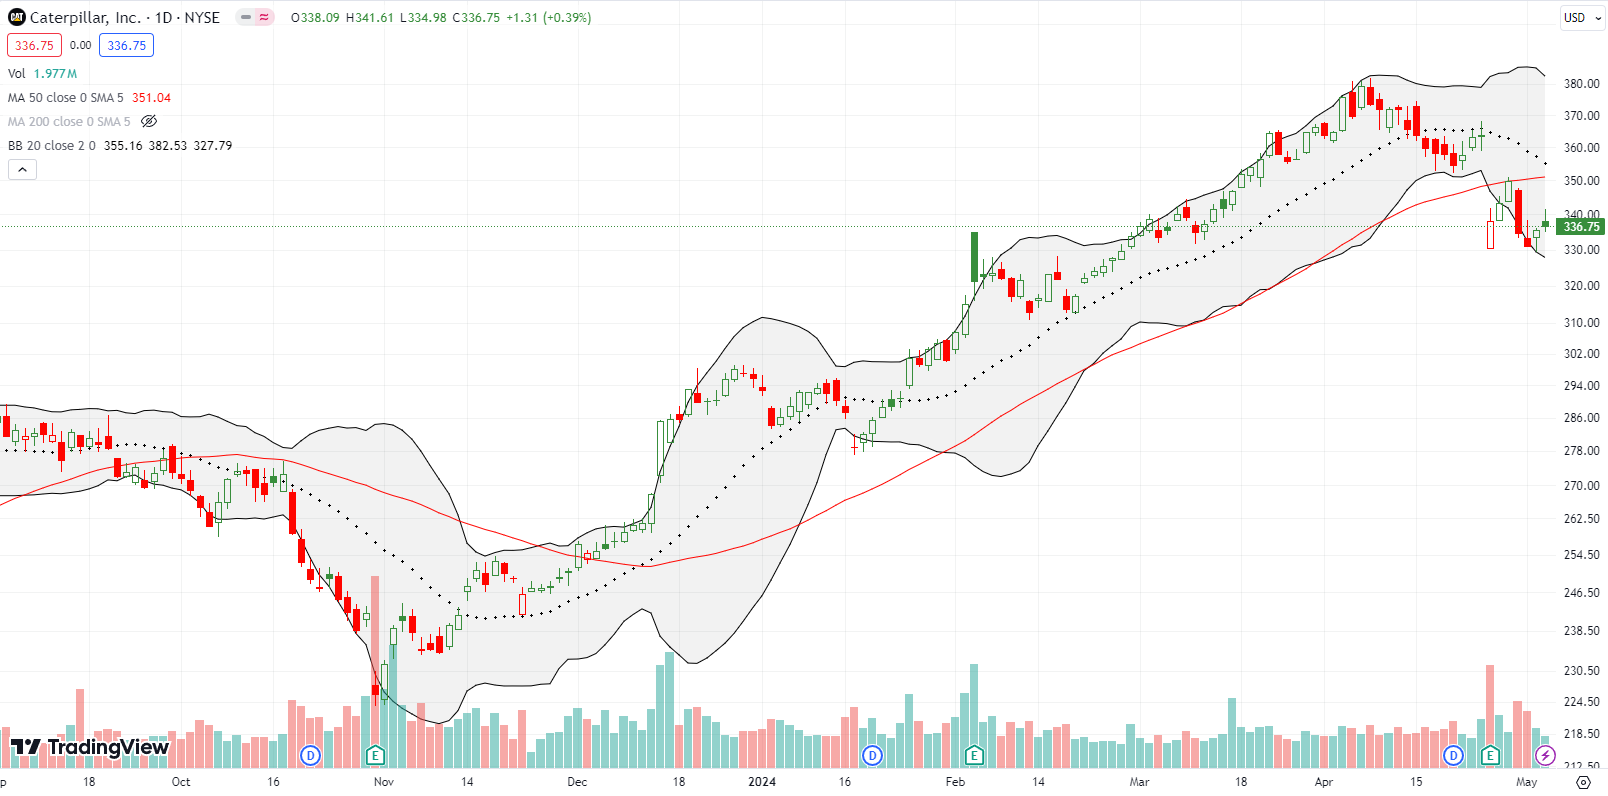
I was primed to jump back into my favorite hedge against bullishness after missing a deep post-earnings sell-off; I did not even wait for confirmation of resistance. I bought a fresh put spread right at 50DMA resistance. CAT promptly reversed 4.4% the next day. I took profits there given the upcoming Fed meeting. I kept a put option left over from a calendar put spread I bought in the wake of earnings. After the weak post-Fed follow-through failed to crack the intraday post-earnings low, I just took what I could get from the put. I am primed next to chase CAT lower on a fresh post-earnings low. I suspect another test of 50DMA resistance will precede a breakout given the market is turning more bullish.
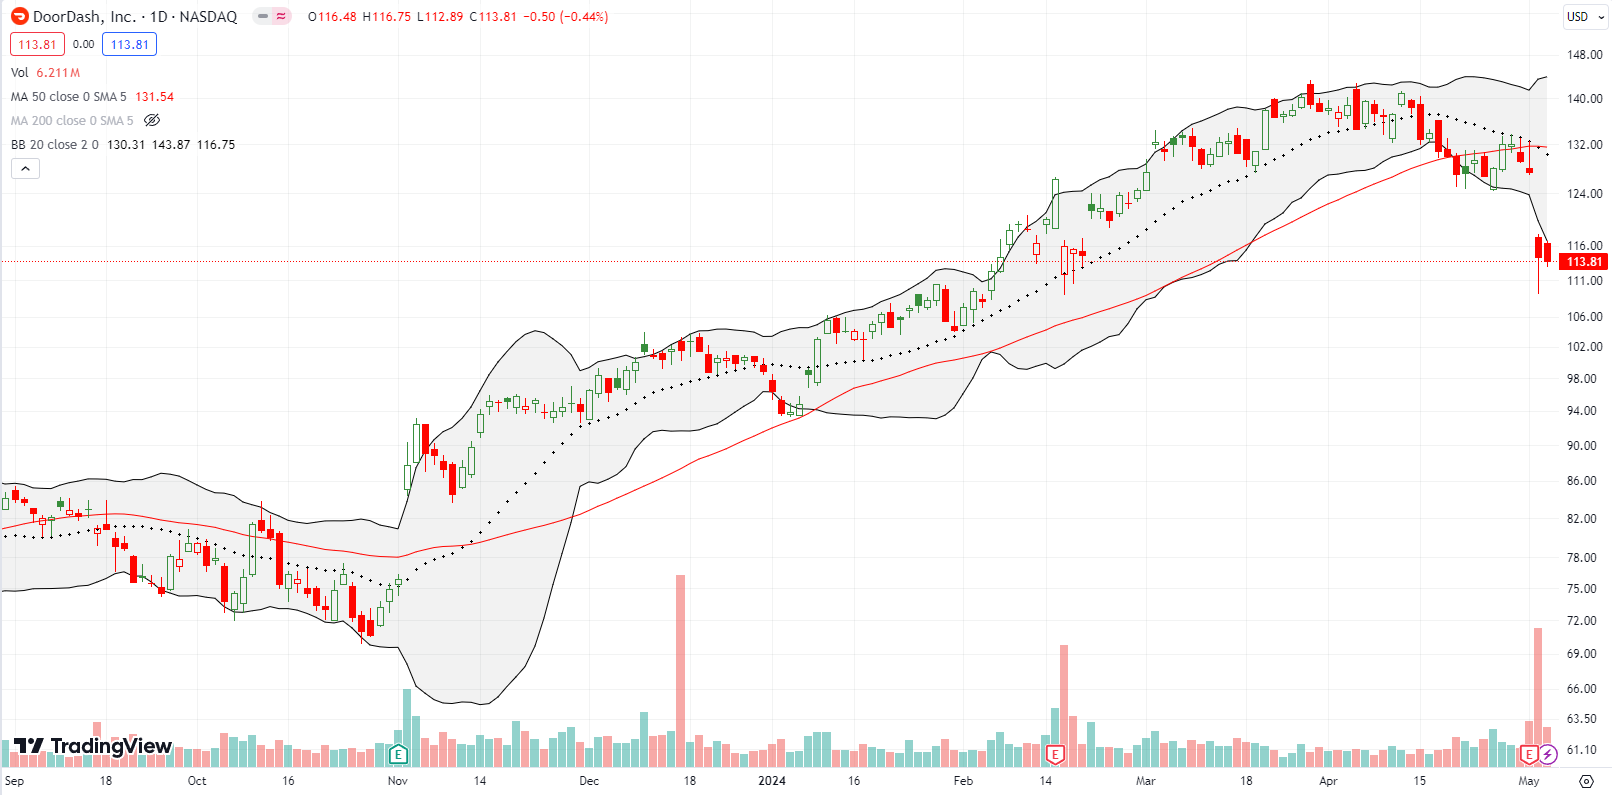
Two weeks ago I tagged DoorDash, Inc (DASH) as a stock to watch as an indicator of market sentiment. Well, DASH fell 10.3% post-earnings and failed to participate in Friday’s rally. Thus, DASH is bracing against the Apple buyquake. DASH also finished reversing its entire rebound from its last earnings report. Normally, I would assume DASH is headed lower and the general market as well. However, I need to await the outcome of the current not so simple test. If DASH closes above its intraday post-earnings high, I will assume a gap fill is in the cards.
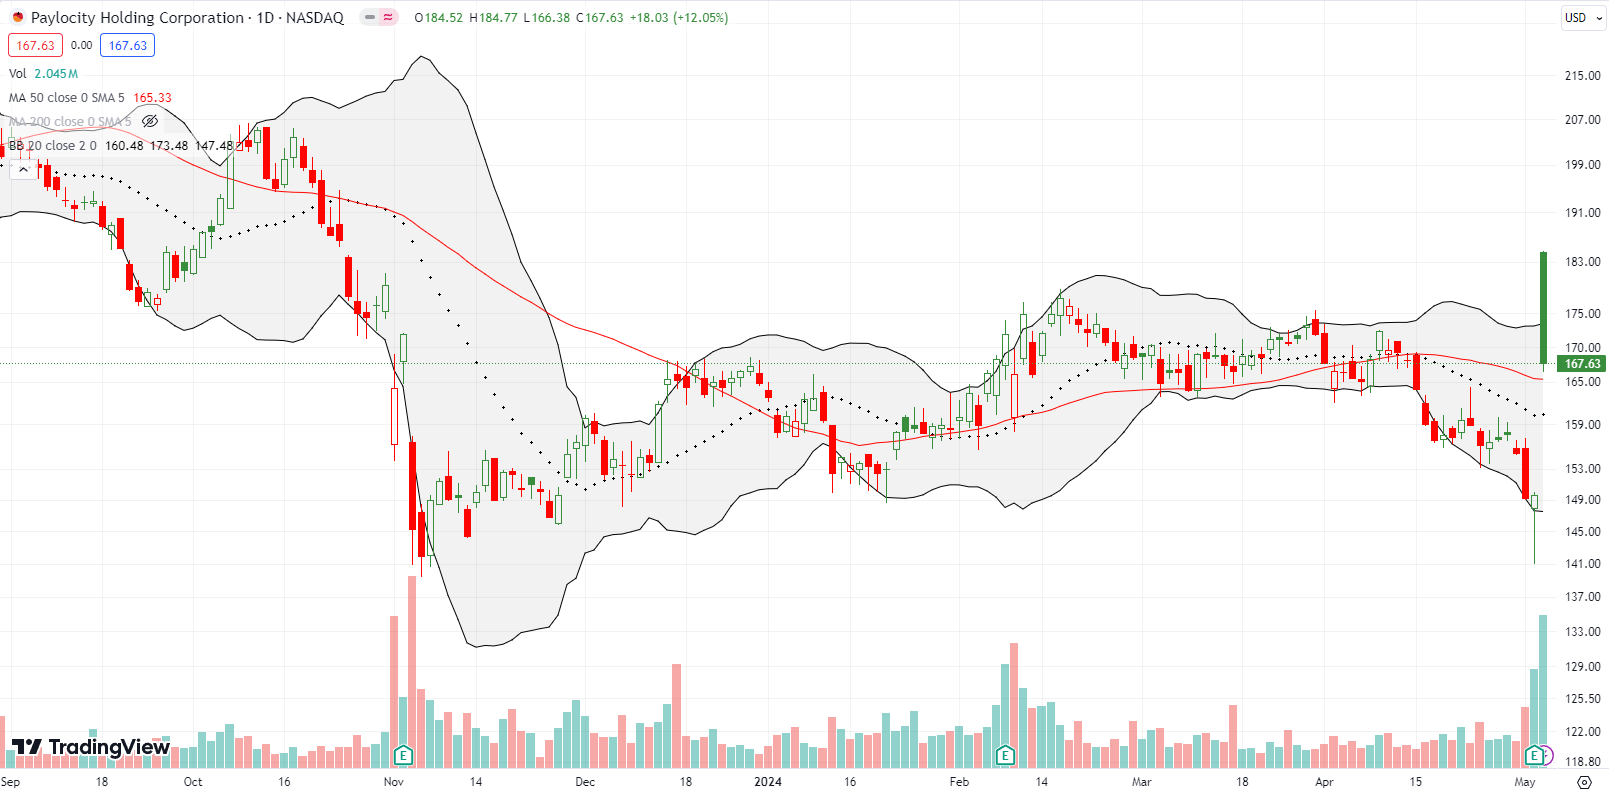
HR software company Paylocity Holding Corporation (PCTY) could not hold its massive post-earnings open and faded all day. It still closed with a 12.8% post-earnings gain and held its 50DMA breakout. I speculated a little early on a rebound from here by buying a May $175 call option. The magic of technicals was in full display ahead of earnings as buyers rushed into the stock right at the post-earnings low from November. In other words, the price action suggests PCTY is slowly bottoming out.
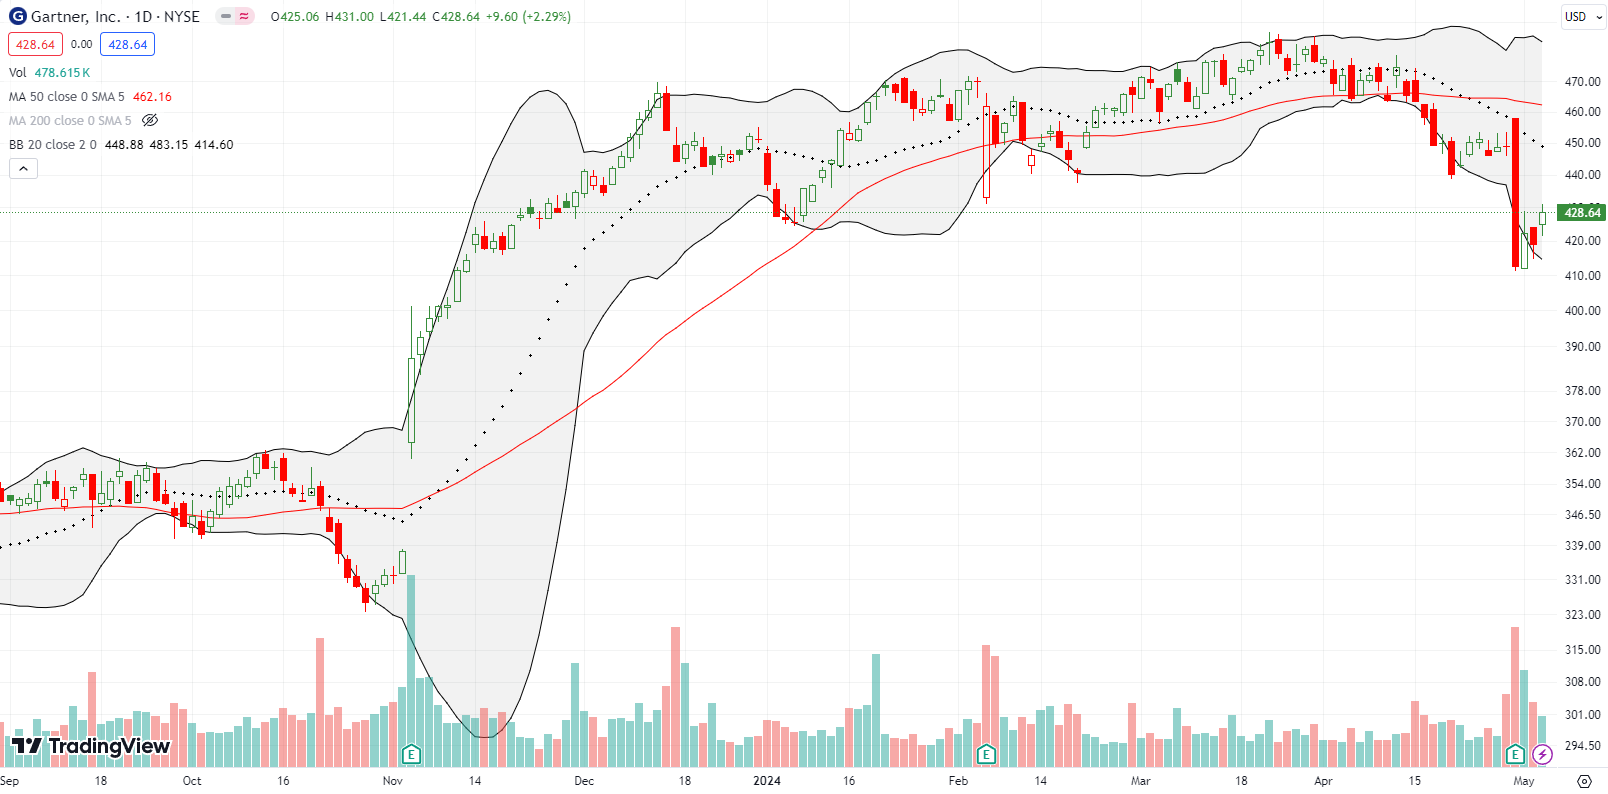
Well-known information technology research and advisory company Gartner, Inc (IT) hit all-time highs this year but struggled to make progress. Thus, its 8.0% post-earnings loss last week looks ominous. From a technical standpoint, IT looks like a short with a stop above 50DMA resistance. However, given Gartner RAISED guidance, it is very possible that last week’s tumble was simple profit-taking. From the transcript of the conference call: “We are increasing our revenue, profit and free cash flow guidance on an operating basis, and updating for the stronger US dollar. We have a lot of capacity for share repurchases and remain eager to buy back stock opportunistically.” I also duly note that since the lows of the financial crisis, IT has delivered eye-popping performance. IT bottomed out below $9/share! I do not even know how to pronounce 5267% gain. This is the kind of stock to retire on with purchases almost anywhere along this 15-year trajectory…if only someone flagged this one for me….
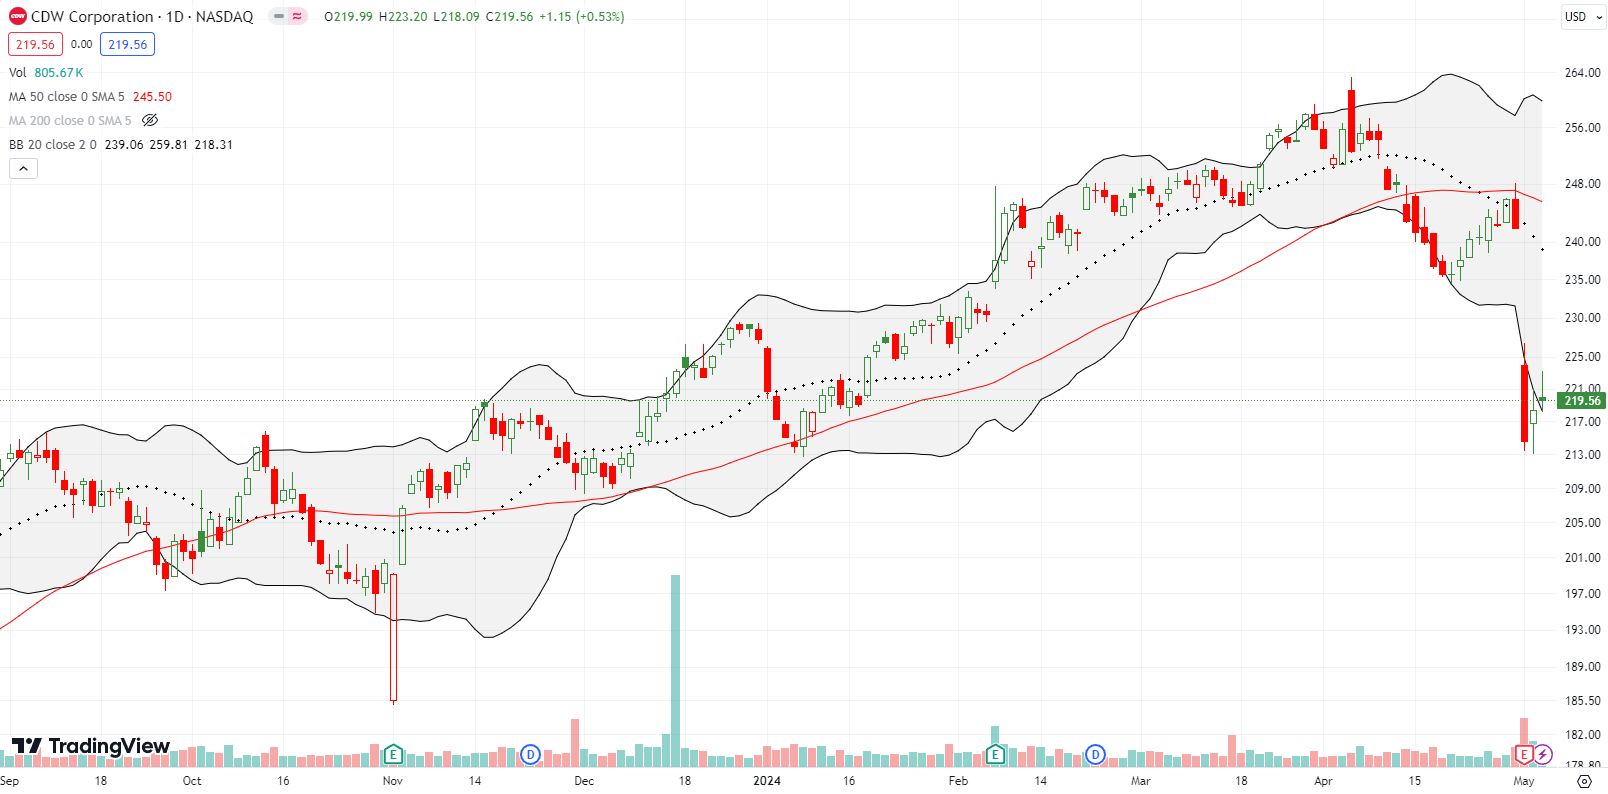
In mid-April I expressed skepticism about IT consulting company CDW Corporation (CDW) and shorted shares on a 50DMA breakdown. The stock trickled from there, and I soon took a small amount of profit. I felt relief after CDW rebounded back to 50DMA resistance.
After the stock failed at resistance just ahead of earnings, I looked to buy a put spread. Yet again, poor options liquidity kept me out the game. I did not want to take the chance of shorting shares outright. So I just watched from the sideline as CDW followed-through on my skepticism to the tune of an 11.3% post-earnings loss. Now I can use CDW as a hedge against going long NASDAQ stocks. A close above the post-earnings intraday high would end a short trade.
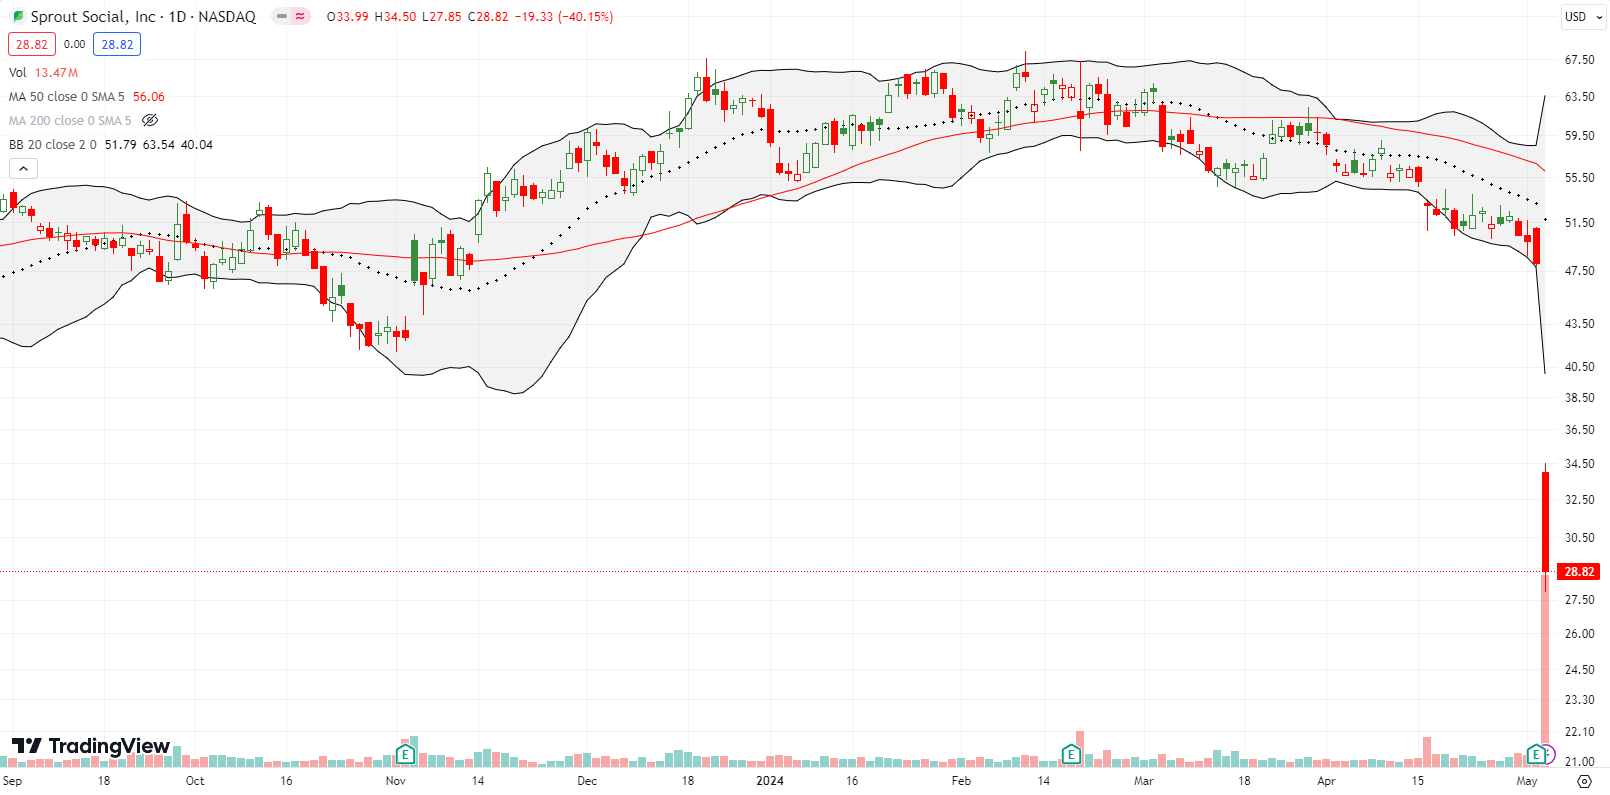
Sprout Social, Inc (SPT) was my disaster of the week. I have eyed the stock for a while in the interest of building a portfolio of digital marketing software companies. Fortunately, SPT never flashed an entry point. On Friday, SPT plunged a gut-wrenching 40% post-earnings. This was a case where a CEO change turned out to be a bright red flag. Still, I cannot help but wonder whether SPT at a 4-year low has become the steal I did not imagine possible. Analysts were upset but did not downgrade to sell (emphasis mine):
“”Revenue missed guidance, full-year revenue was cut by ~$20M, billings missed expectations, and calculated current bookings decelerated from 53.7% in 4Q23 to 14.4% in 1Q24—not a complete halt, but close,” said KeyBanc analysts Jackson Ader, Michael Vidovic and Kyle Diehl. KeyBanc downgraded Sprout Social to Sector Weight from Overweight.”
A sector weight suggests upside from current levels. Moreover, this small miss generated a $1.2B loss in market cap. SPT also now trades at a record low 4.5 price/sales; that is about as low as things get for a viable software company. I am buying at the first sign of buyer interest and then just holding on for dear life…
As a second check, I dialed up ChatGPT4 to analyze the situation from the information in the earnings transcript. This situation is classic where a company delivers a poor performance and adds to the chaos by changing the measuring sticks for analysts. Analysts HATE that stuff. Thus, I interpret the 40% plunge as an over-reaction…again assuming Sprout Social is still a viable company.
Prompt: Sprout Social (SPT) plunged 40% in response to the earnings report described in the transcript below. Identify the drivers of this loss and distinguish your explanation from interpretations of what management had to say and what analysts observed and/or questioned:
Response:
Sprout Social (SPT) experienced a 40% plunge after its latest earnings report due to several key drivers that affected investor confidence and market sentiment. Here’s a breakdown of the causes and how these differ from management’s explanations and analysts’ observations:
1. Revenue Miss and Outlook Reduction:
- Sprout Social’s revenue growth of 29% year-over-year for Q1 2024 fell short of expectations, particularly due to strategic changes that led to a slower pace of customer acquisitions and a shift in customer mix. The company also revised its full-year 2024 revenue guidance down to $405-406 million, signaling lower growth expectations, which further spooked investors.
2. Transition to Enterprise Focus:
- The company shifted focus from smaller customers to more profitable mid-market and enterprise clients. However, this transition led to longer sales cycles, delayed deal closures, and reduced near-term revenue. Sprout Social underestimated the effect of this transition on its sales execution and linearity, which contributed to a slower growth trajectory.
3. Sales and Operational Changes:
- Several strategic changes to the sales team structure, promotions, and account coverage model were implemented in Q1. These adjustments, aimed at aligning Sprout Social with its long-term strategy, disrupted sales momentum. Management admitted these changes had a short-term impact on execution, as the sales team needed time to ramp up.
4. Macro and Competitive Headwinds:
- Management acknowledged that the challenging macroeconomic environment added pressure to sales execution, with increased scrutiny over marketing budgets and prolonged decision-making cycles for potential clients. Additionally, analysts observed that competitive pressures, particularly in enterprise software, have created headwinds for Sprout Social.
5. Metrics Disclosure Changes:
- Sprout Social announced it would stop disclosing key performance metrics like Annual Recurring Revenue (ARR) and customer count, citing changing customer composition and the shift towards enterprise clients. Analysts expressed concerns about the lack of transparency this would cause, leaving them without clear indicators to gauge the company’s progress.
Management’s Perspective vs. Analysts’ Observations:
- Management’s View: The company framed these changes as part of a long-term strategy to capture greater value from larger customer cohorts. Management emphasized that the strategic shifts were necessary to create a durable, efficient growth path with improved profitability over time.
- Analysts’ Observations: Analysts questioned whether the changes in metrics disclosure, revenue miss, and long sales cycles signaled deeper structural issues or pointed to execution challenges that could persist beyond Q1. They probed management on the guidance reduction, and some expressed concern about the lack of transparency after removing key metrics.
In summary, the 40% plunge was driven by a combination of revenue underperformance, guidance reduction, and uncertainty stemming from changes in metrics disclosure and strategic realignment. The transition towards larger customers, though promising for the long term, left the company exposed to immediate headwinds that investors deemed significant.
Be careful out there!
Footnotes
Subscribe for free to get email notifications of future posts!
“Above the 50” (AT50) uses the percentage of stocks trading above their respective 50-day moving averages (DMAs) to measure breadth in the stock market. Breadth defines the distribution of participation in a rally or sell-off. As a result, AT50 identifies extremes in market sentiment that are likely to reverse. Above the 50 is my alternative name for “MMFI” which is a symbol TradingView.com and other chart vendors use for this breadth indicator. Learn more about AT50 on my Market Breadth Resource Page. AT200, or MMTH, measures the percentage of stocks trading above their respective 200DMAs.
Active AT50 (MMFI) periods: Day #112 over 20%, Day #11 over 30%, Day #2 over 40% (overperiod), Day #18 under 50% (underperiod), Day #24 under 60%, Day #79 under 70%
Source for charts unless otherwise noted: TradingView.com
Full disclosure: long VXX puts, long GOOG call spread and calls, long PCTY call, long DIS shares and call spread
FOLLOW Dr. Duru’s commentary on financial markets via StockTwits, Twitter, and even Instagram!
*Charting notes: Stock prices are not adjusted for dividends. Candlestick charts use hollow bodies: open candles indicate a close higher than the open, filled candles indicate an open higher than the close.

A couple minor points:
• I saw an article saying the worker compensation cost increase was in benefits – primarily insurance-related – not wages, which were flat.
• Apple has been raising its dividend in May for many years; that action is not particularly significant.
I agree AAPL is over-stretched; absent surprise positive news on the 7th, I expect it to fill its post-earnings up-gap.
Yes. I should have focused more on the buyback which broke Apple’s last record for biggest in history….although I now wonder how big it is in inflation-adjusted terms. Hmmmmm