Stock Market Commentary
Technical underpinnings are changing fast in the stock market. The first strike against the rally came in the form of initial struggles to break into overbought territory. A second strike has now emerged in the form of an appreciating Japanese yen (FXY). To the extent carry trades – borrowing cheap yen to buy risk assets – has helped support the rally, the steady appreciation of the yen threatens to take the top of the market. A third strike against the market will essentially pave the way for a bearish tone in the stock market. Friday’s jobs report for November looms over the key overbought threshold.
The Stock Market Indices
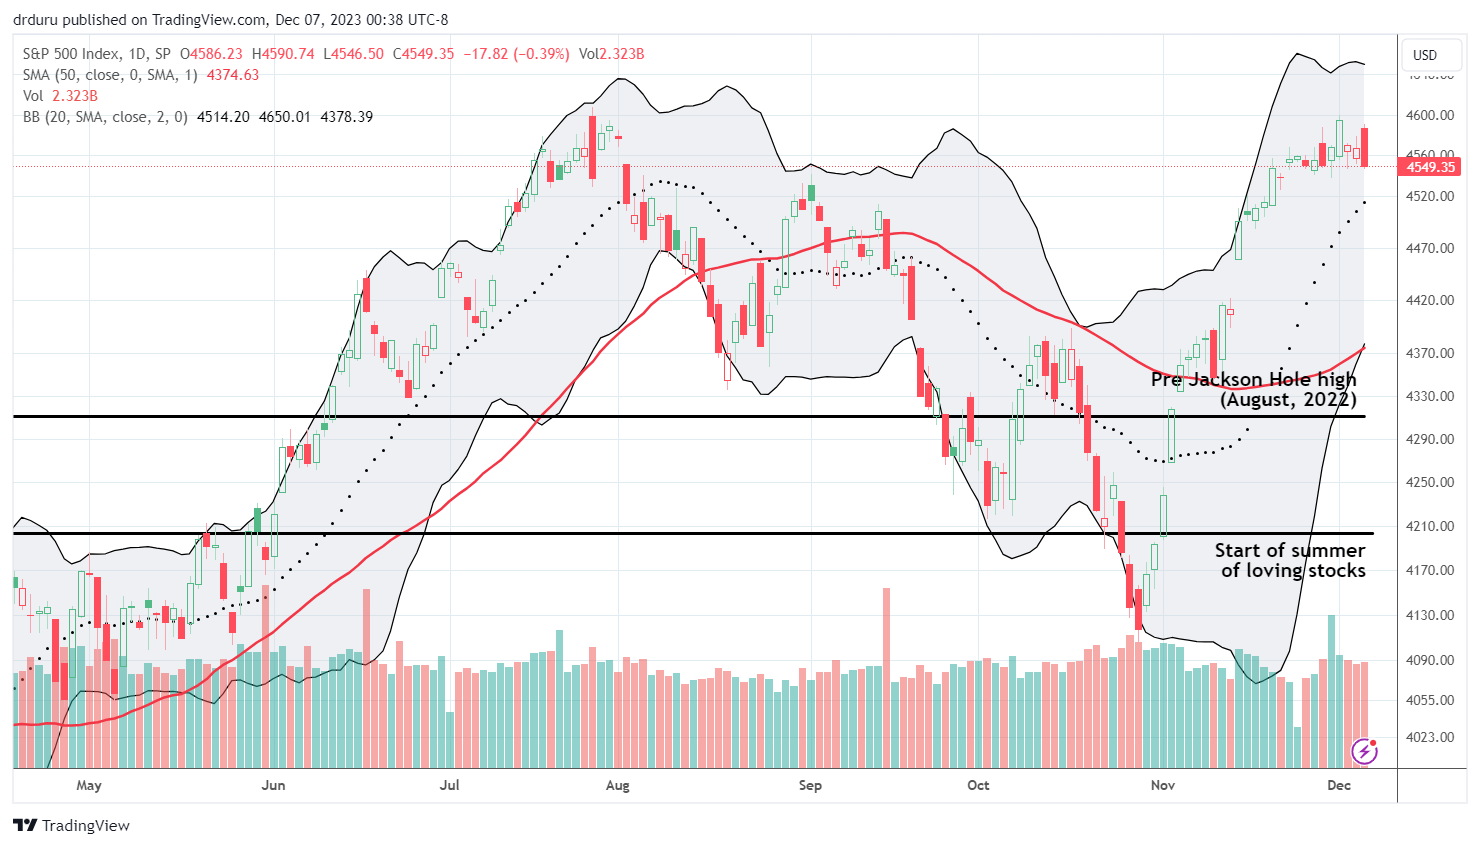
The S&P 500 (SPY) ended last week with a promising breakout and marginal 20-month closing high. However, a gap down on Monday instantly reversed Friday’s gains. Wednesday’s 0.4% loss signals a potential top at resistance from the 2023 high set over the summer.
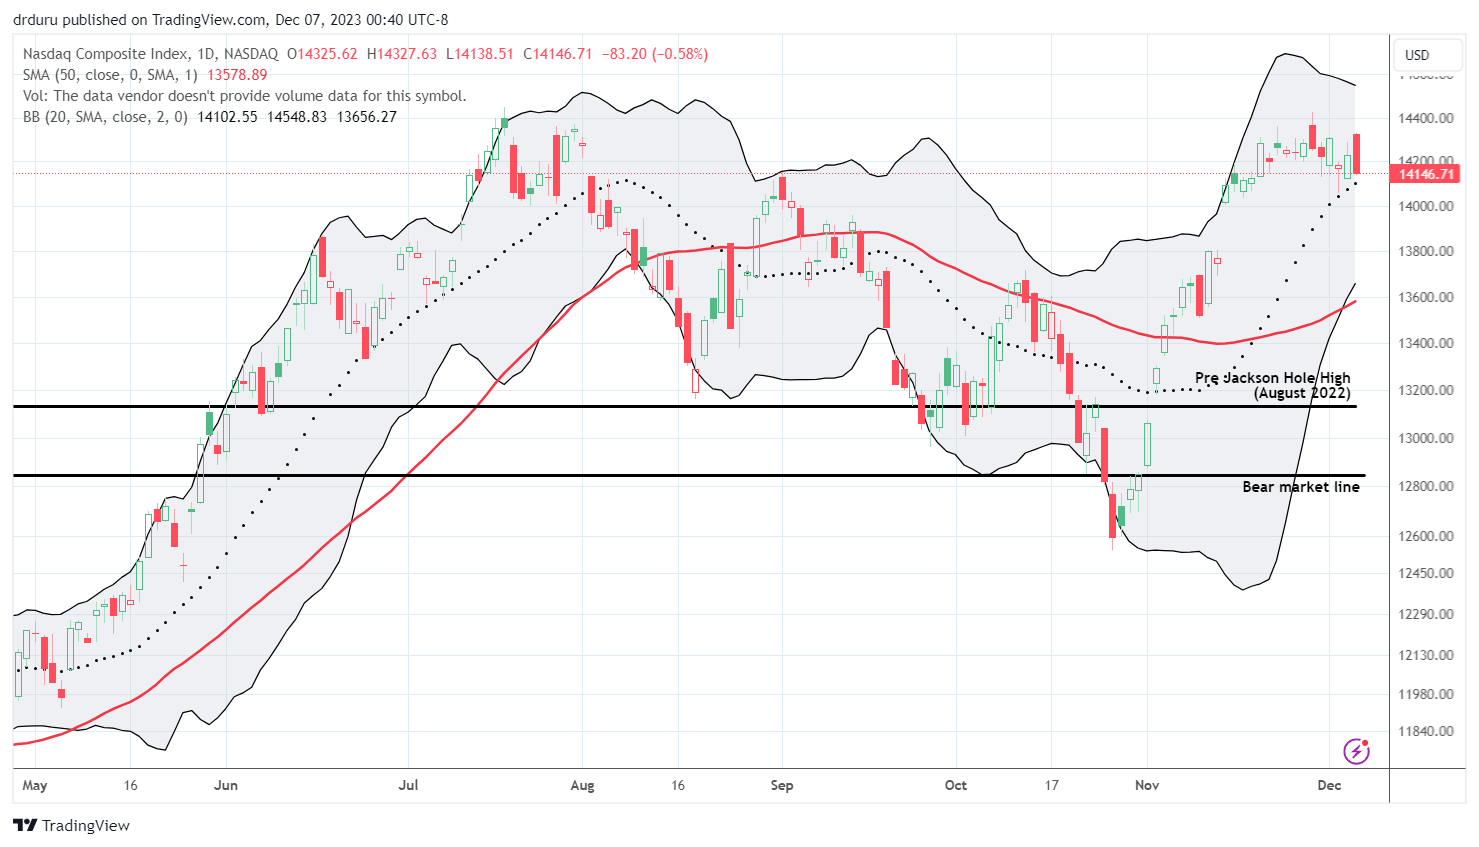
The NASDAQ (COMPQ) looks even more stalled than the S&P 500. The tech-laden index is clinging to support at its 20-day moving average (DMA) as a last gasp to maintain a bullish posture. A 20DMA breakdown will effectively confirm resistance at the year’s high set in July.
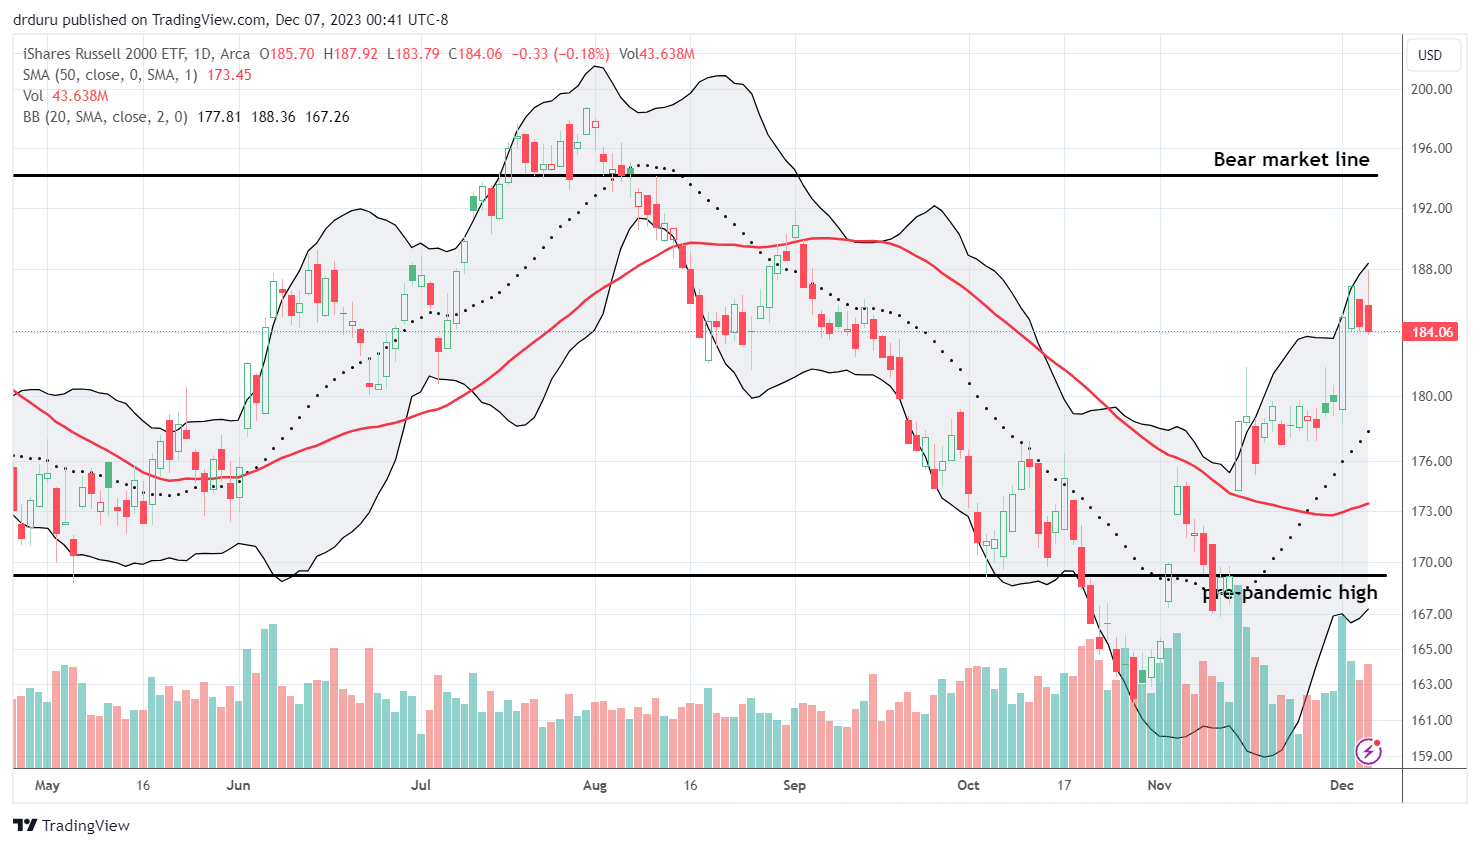
The iShares Russell 2000 ETF (IWM) outperformed the major indices again by starting the week with a solid 1.1% gain. However, two days of subsequent selling and a sharp fade from intraday highs puts the ETF of small caps in a precarious position. Suddenly, last Friday’s surge looks vulnerable to a reversal. Still, I nibbled on a fresh IWM calendar call in case buyers move counter to the growing bearish signals in the market.
The Short-Term Trading Call With A Second Strike
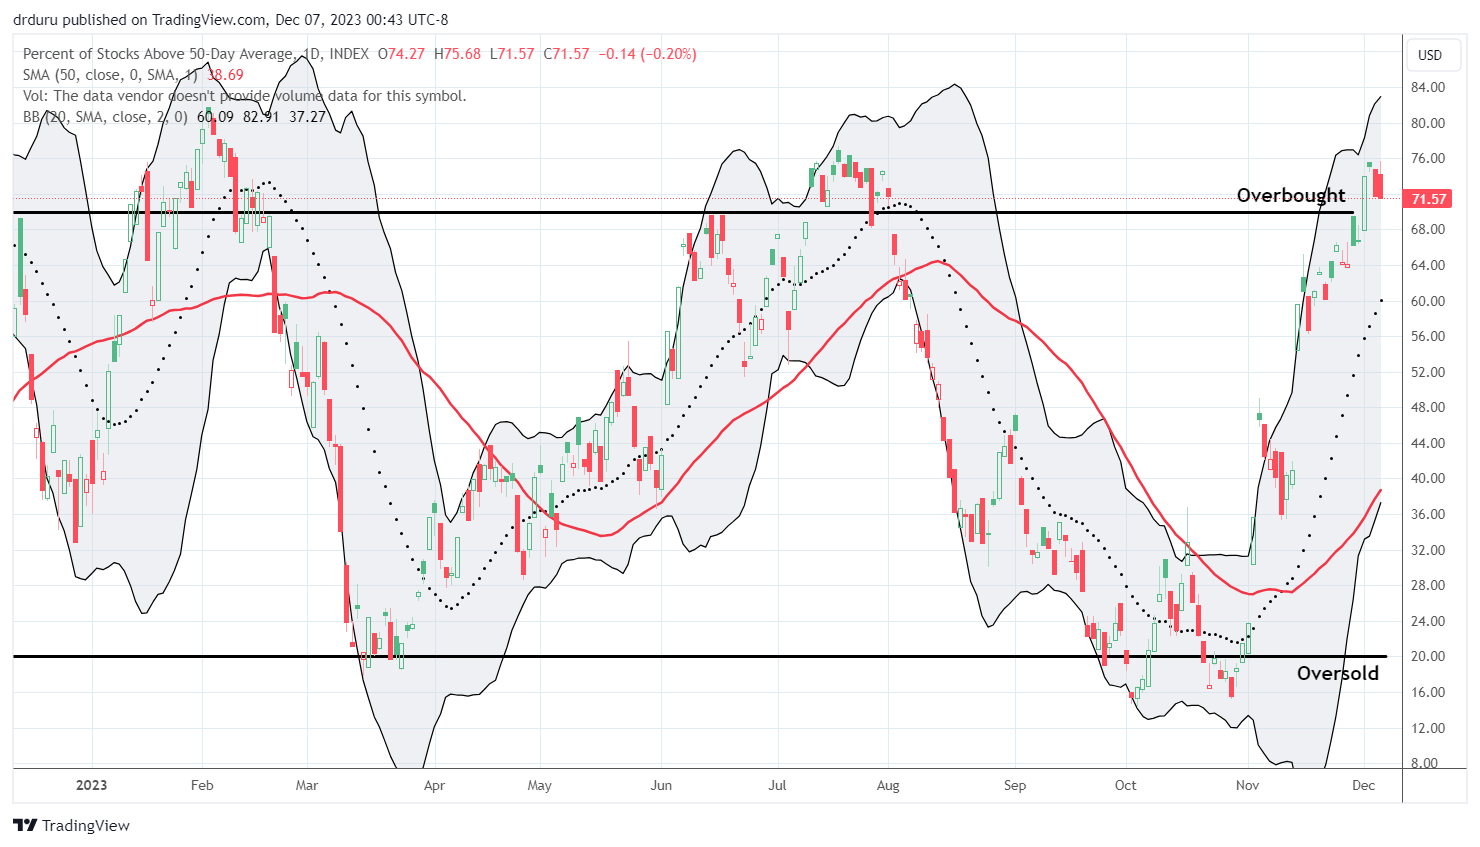
- AT50 (MMFI) = 71.6% of stocks are trading above their respective 50-day moving averages (4th overbought day)
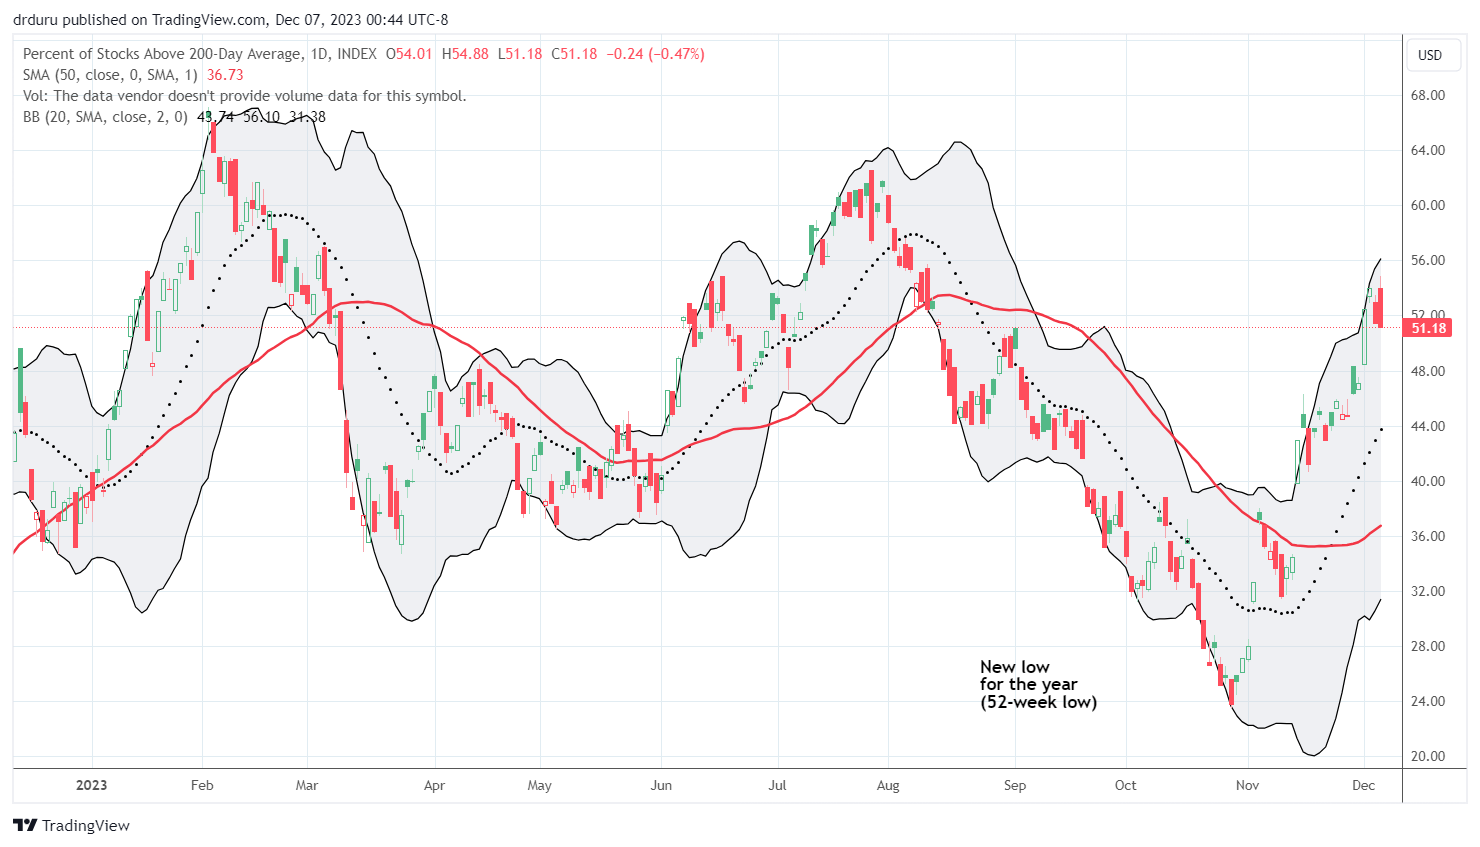
- AT200 (MMTH) = 51.2% of stocks are trading above their respective 200-day moving averages
- Short-term Trading Call: neutral
AT50 (MMFI), the percentage of stocks trading above their respective 50DMAs, floats precariously above the overbought threshold of 70%. IWM’s Monday gain helped push my favorite technical indicator marginally higher, but now AT50 has little support. With an appreciating yen delivering a second strike against the market rally, a close below the overbought threshold will flip me “cautiously” bearish on the stock market. I will not even wait for a confirming second close lower. As a reminder, such a switch will not come with dire expectations. I may not even short much beyond a few put options. Instead, I will eagerly await the next buy signal. I paved the path by taking profits on almost all my standing short-term trades.
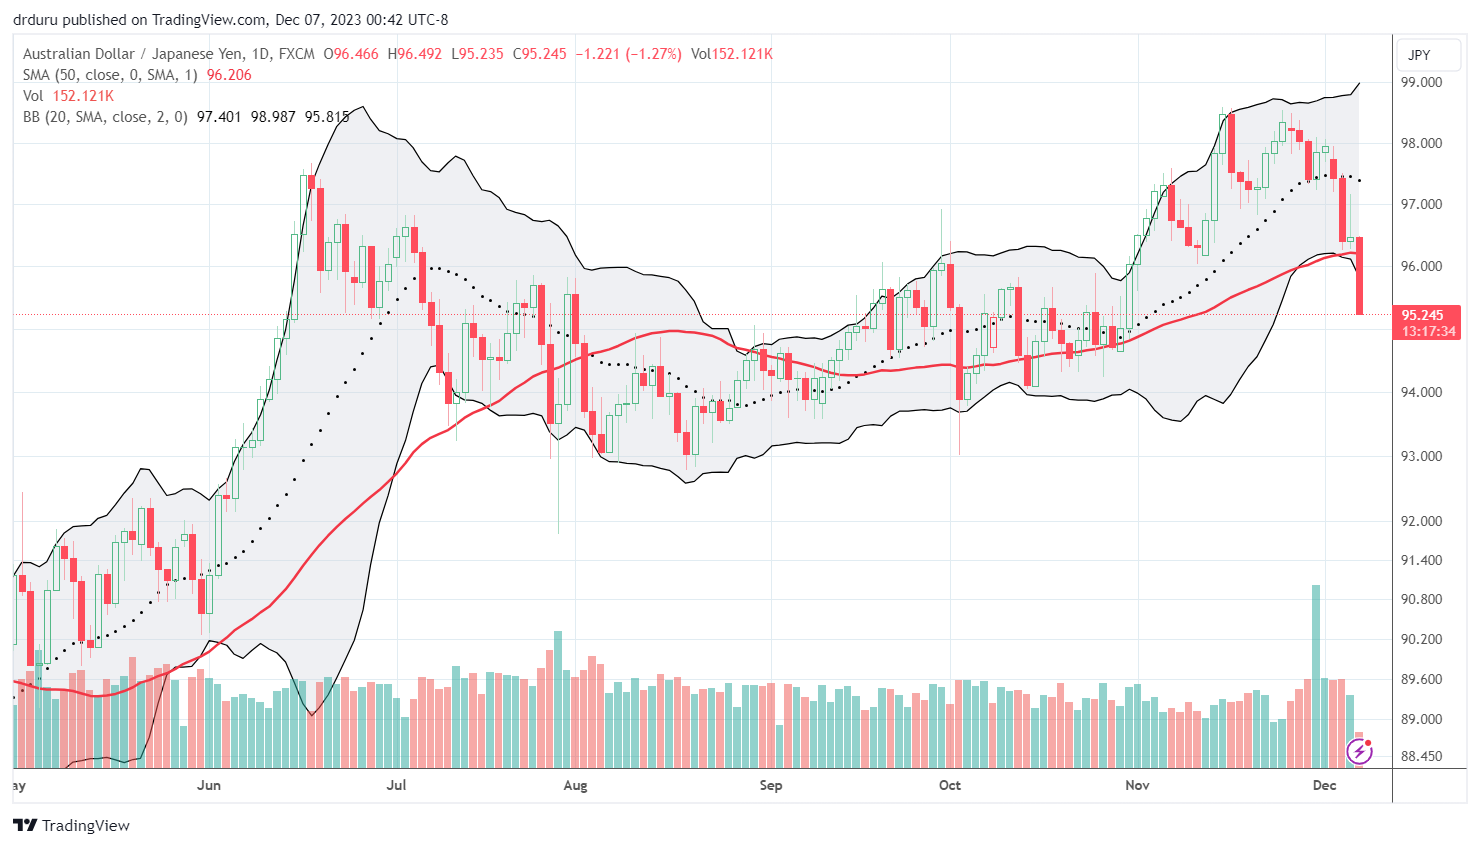
The Australian dollar versus the Japanese yen (AUD/JPY) topped out at a fresh high for the year last month. Now it is plunging fast and hard as the yen appreciates and surges. The move looks overdone, so rolled into a position for a potential short-term bounce back to 50DMA resistance. Otherwise, the market could be in for rapid trouble. As a reminder, AUD/JPY matters to traders even though this year’s correlations have not worked well (see “Why the Australian Dollar and Japanese Yen Matter for Stock Traders”).
Be careful out there!
Footnotes
Subscribe for free to get email notifications of future posts!
“Above the 50” (AT50) uses the percentage of stocks trading above their respective 50-day moving averages (DMAs) to measure breadth in the stock market. Breadth defines the distribution of participation in a rally or sell-off. As a result, AT50 identifies extremes in market sentiment that are likely to reverse. Above the 50 is my alternative name for “MMFI” which is a symbol TradingView.com and other chart vendors use for this breadth indicator. Learn more about AT50 on my Market Breadth Resource Page. AT200, or MMTH, measures the percentage of stocks trading above their respective 200DMAs.
Active AT50 (MMFI) periods: Day #21 over 20%, Day #19 over 30%, Day #17 over 40%, Day #16 over 50%, Day #13 over 60%, Day #4 over 70% (4th day overbought)
Source for charts unless otherwise noted: TradingView.com
Full disclosure: long AUD/JPY, long IWM calendar call spread
FOLLOW Dr. Duru’s commentary on financial markets via StockTwits, Twitter, and even Instagram!
*Charting notes: Stock prices are not adjusted for dividends. Candlestick charts use hollow bodies: open candles indicate a close higher than the open, filled candles indicate an open higher than the close.


