

Housing Market Intro and Summary
The October housing data showed some further softening, including a revision of the new home sales data that erased a breakout. Yet, November was a blockbuster month for launching the seasonal strength in the stocks of home builders. Many of these stocks hit all-time highs in a race ahead of the current housing market data. Financial markets maintained excitement over the prospects of lower mortgage rates driven by a presumed end to the Federal Reserve’s rate hike cycle. Thus, the forward-looking prospects look much better than the backward view. For instance, a recent Bank of America survey revealed a significant shift in buyer behavior: now, only 62% of potential home buyers are willing to wait for lower mortgage rates, a decrease from 85% just six months ago. In classic form, the seasonal strength in the stock market is driven by enthusiasm for what could lie ahead for the Spring selling season.
Housing Stocks
In my last Housing Market Review, I explained my strategy for buying into the beginning of seasonal strength for the stocks of home builders. The subsequent rally has been so steep and so strong that I have already locked in profits on some of the positions. The race ahead in these stocks happened in three key spurts as shown by the chart of iShares US Home Construction ETF (ITB) below. Each race ahead rode the sharp declines in long-term interest rates which in turn drove a sharp decline in mortgage rates in November. The surge at the end of last week to an all-time high occurred in the wake of statements from Federal Reserve Chair Jerome Powell which appeared to further confirm the end of the Fed’s rate hike cycle.
")
Transaction dependent Zillow Group, Inc (ZG) is still well off its all-time high. However, ZG looks like it has turned a corner with a confirmed breakout above its 50-day moving average (DMA) (the red, downward trending line below). The rally shows a race ahead of the sales data which do not yet show signs of supporting renewed growth in housing transactions.
")
Across the spectrum, November’s race ahead produced much stronger housing-related stocks and several all-time highs in conjunction with ITB.
Housing Data
Home Builder Confidence: The Housing Market Index – November, 2023
In June, the National Association of Home Builders (NAHB)/Wells Fargo Housing Market Index (HMI) entered positive sentiment territory (over 50) for the first time in almost a year. HMI achieved a 13-month high in July. Sentiment quickly returned to negative territory in September, and in November the HMI dropped for the fourth month in a row. At 34, the HMI is at its lowest level since the depths of the pandemic. Given mortgage rates may have finally peaked, the HMI may also bottom out in coming months.
Accordingly, the NAHB is anticipating a rebound in the HMI:
“…the 10-year Treasury rate moved back to the 4.5% range for the first time since late September, which will help bring mortgage rates close to or below 7.5%. Given the lack of existing home inventory, somewhat lower mortgage rates will price-in housing demand and likely set the stage for improved builder views of market conditions in December.”
The NAHB also reported increasing pressure on builders to reduce prices to address affordability issues. The share of builders cutting prices increased to levels last seen in November, 2022 although the average price discount stayed flat at 6%. The share of builders providing incentives fell to 60%, down from the 62% in October which tied the cycle high set last December.
/Wells Fargo Housing Market Index (HMI) and the University of Michigan Index of Consumer Sentiment")
Source for data: NAHB and the University of Michigan
With more data note how the HMI peaked along with the recent peak in consumer sentiment.
The decline in the HMI was broad based across the components. Each one declined significantly from October’s levels.

Each HMI component declined significantly and dropped deeper into negative territory (below 50%).
Sentiment in the Northeast was a notable exception to the dour mood reflected in the HMI. The Northeast soared back into positive territory and hit its third highest point of the year at 53. The South and the West once again declined the most. Both regions are now at their lowest levels of the year. The sharp drops in sentiment in the South have consistently augured poorly for the overall HMI, but the jump in the Northeast suggests the HMI will respond positively to the recent declines in mortgage rates.
New Residential Construction (Single-Family Housing Starts) – October, 2023
Single-family housing starts have stabilized right under the 1M level despite the on-going plunge in builder sentiment. This divergence is unusual and suggests that the largest builders are not nearly as pessimistic as the smaller builders (indeed the earnings reports from publicly traded builders still reflect an abiding optimism). Housing starts increased 0.2% month-over-month to 970,000. Starts continued year-over-year strength with a 13.1% gain in October. Given starts bottomed last year in November, the year-over-year strength will soon diminish.
![US. Bureau of the Census, Privately Owned Housing Starts: 1-Unit Structures [HOUST1F], first retrieved from FRED, Federal Reserve Bank of St. Louis, December 3, 2023](https://drduru.com/onetwentytwo/wp-content/uploads/2023/12/20231203_October-Housing-Starts.png "Housing starts")
Poor builder sentiment is still not hindering intentions to build. Building permits in October generated a ninth consecutive monthly increase with a 0.6% gain. The message from building permits continues to suggest starts will break out in the coming months. Perhaps the data will show a breakout once sentiment finally bottoms. Note that the NAHB forecast a 5% annual increase in single-family starts for 2024 (in its HMI report).
The Midwest was the only region with a year-over-year decline starts. The West enjoyed a tremendous rebound. Housing starts in the Northeast, Midwest, South, and West each changed +9.8%, -11.5%, +9.1%, +46.0% respectively year-over-year.
New Residential Sales (Single-Family) – October, 2023
New home sales have remained rangebound since April of this year. Given the upward trajectory of mortgage rates through much of this time, the rangebound behavior is a testament to the ability of builders to manage pricing to keep sales aloft. The 679,000 new homes sold in October delivered a 5.6% month-over-month decline and a 17.7% year-over-year jump. September sales were revised downward from 759,000 to 719,000. This revision flattened what looked like a breakout and at the time was consistent with my claim from the August Housing Market Review: “With rates above the 7% level, I still expect new home sales to flatten out in the near-term. The plunge in builder confidence suggests a flattening is in store.”
![US. Bureau of the Census, New One Family Houses Sold: United States [HSN1F], first retrieved from FRED, Federal Reserve Bank of St. Louis, December 3, 2023.](https://drduru.com/onetwentytwo/wp-content/uploads/2023/12/20231203_New-Home-Sales.png "new home sales")
The median price dropped 3.1% from September to $409,300, also a whopping 17.6% year-over-year decrease. The year-over-year changes violated the bottom I thought was in place. The yearly price change is the largest decline on record with the data series starting in 1964. The price bubble has popped both from smaller homes and price concessions from home builders (likely the smallest ones).
A transition in price mix is underway with the advantage decisively going to the lower tiers. In August, the year-over-year changes featured the middle price ranges giving up share to the edges with the lower ranges outweighing the higher ranges. In September, there was a full horizontal shift of pricing to the tiers below $400,000. In October the shift continued with the $500,000+ tiers losing 6 percentage points of share. The year-over-year share loss was an even larger 17 percentage points.
The inventory for new homes rebounded from 6.9 months of sales in September to 7.8 months in October where it stood in August (these are unrevised numbers). While the market remains above the 6.0 level characteristic of a balanced market, absolute inventories increased just slightly from 435,000 to 439,000. Demand for new homes remains strong…and sales are strong when homes are priced well.
In October, every region achieved a year-over-year jump in sales. The Northeast, Midwest, South, and the West changed +10.3%, +8.5%, 19.2%, and +18.9% respectively. The West ended a 3-month streak of sequential surges with a 23.3% month-over-month plunge.
Existing Home Sales – October, 2023
While new home sales remained resilient, existing home sales fell to new lows. The widening divergence is indicative of the better options with newly built homes, both in availability and pricing. The National Association of Realtors (NAR) has long claimed (hoped?) that increasing inventory would generate more sales, but the dynamics in the market continue to fail to show that. Instead, the prevailing trends have been for higher prices and lower sales. Even the descent from June’s all-time high median price looks like it is already flattening out. In a surprising twist, the NAR flipped the script to show the positive side of these market dynamics from the owner’s perspective: “While circumstances for buyers remain tight, home sellers have done well as prices continue to rise year-over-year, including a new all-time high for the month of October…a typical homeowner has accumulated more than $100,000 in housing wealth over the past three years.”
Existing home sales continued an extended decline with a 4.1% month-over-month drop in October. The seasonally adjusted annualized sales in October of 3.79M declined 14.6% year-over-year. September’s sales were revised slightly down from 3.96M to 3.95M. I dropped my expectations for stabilization in the previous Housing Market Review. I still do not know what can stop the downtrend. Sales were last this low in the wake of the Great Financial Crisis (GFC) in 2010. Presumably those levels represent a likely floor for the market. Condo and coop sales have somewhat stabilized at those rock bottom levels.

(For historical data from 1999 to 2014, click here. For historical data from 2014 to 2018, click here) Source for chart: National Association of Realtors, Existing Home Sales© [EXHOSLUSM495S], retrieved from FRED, Federal Reserve Bank of St. Louis, December 4, 2023

The median sales price of an existing home last peaked in June. The 0.3% month-over-month price drop in October represents a flattening in the descent. Falling mortgage rates may confirm a floor on prices. Prices increased 3.4% year-over-year so the overall trend remains upward. While prices decline sequentially, they have increased year-over-year for the fourth month in a row.
October’s absolute inventory of 1.15M homes increased 1.8% month-over-month but dropped 5.7% year-over-year. According to the NAR, “unsold inventory sits at a 3.6-month supply at the current sales pace, up from 3.4 months in September and 3.3 months in October 2022.”
The average time on market for an existing home increased by 2 days to 23 days in October. The 66% of homes that sold within a month is down from the 69% in September. Demand pressures continue to decline ever so slightly, likely due to seasonal factors.
The share of sales to first-time home buyers increased to 28% in October from September’s 27%. The share was also 28% a year ago. This share drifts up and down with no direction. The NAR’s 2017 Profile of Home Buyers and Sellers reported an average of 34% for 2017, 33% for 2018, 33% for 2019, 31% for 2020, 34% for 2021, 26% for 2022, and 32% for 2023. The first-time buyer share for 2022 was the lowest on record for the NAR. The complete rebound in 2023 surprises me given that difficult inventory, rate, and price conditions are supposed to work against first-time home buyers.
As has been the pattern for most of the year, all regions declined significantly in sales year-over-year. The West and the South were the two regions which also declined month-over-month. The regional year-over-year changes were: Northeast -15.8%, Midwest -13.9%, South -14.6%, West -14.9%. These large declines sharply contrast with the regional surges for new home sales.
Every region experienced a year-over-year price increase. The West was the first region to flip negative in January, but the region was flat for July and up for August and now September. The regional year-over-year price changes were as follows: Northeast +7.5%, Midwest +4.2%, South +3.5%, West +2.3%.
Single-family existing home sales decreased 4.2% from September and declined on a yearly basis by 14.6%. The median price of $396,100 was up 3.0% year-over-year and down ever so slightly at 0.3% month-over-month.
California Existing Home Sales – October, 2023
The California Association of Realtors (C.A.R.) sprinkled rate optimism in its commentary on another dour month for the California existing home market. For example, the C.A.R. projected that the “further decline in mortgage rates should alleviate pressures on both the supply side and the demand side of the housing market in the coming months.” However, while lower rates take their time to cascade through the market, the C.A.R. sees good news in some key softening in the market: “…many other factors have swung in favor of buyers recently including more properties staying on the market longer before selling and fewer homes selling over list price, which could motivate more sellers to offer concessions.”
Sales of existing single-family homes in California managed to eke out a gain of 0.3% from September to October but still declined 11.9% year-over-year to 241,770. October’s median home price decreased 0.4% from September and held above $800,000 for the seventh month in a row. The median price is up 5.3% year-over-year. This largest yearly gain in 17 months follows September’s 15-month high and August’s 14-month high yearly gain. The month-over-month price change on a square footage basis increased 1.0% to $421 (a 6.3% year-over-year jump).
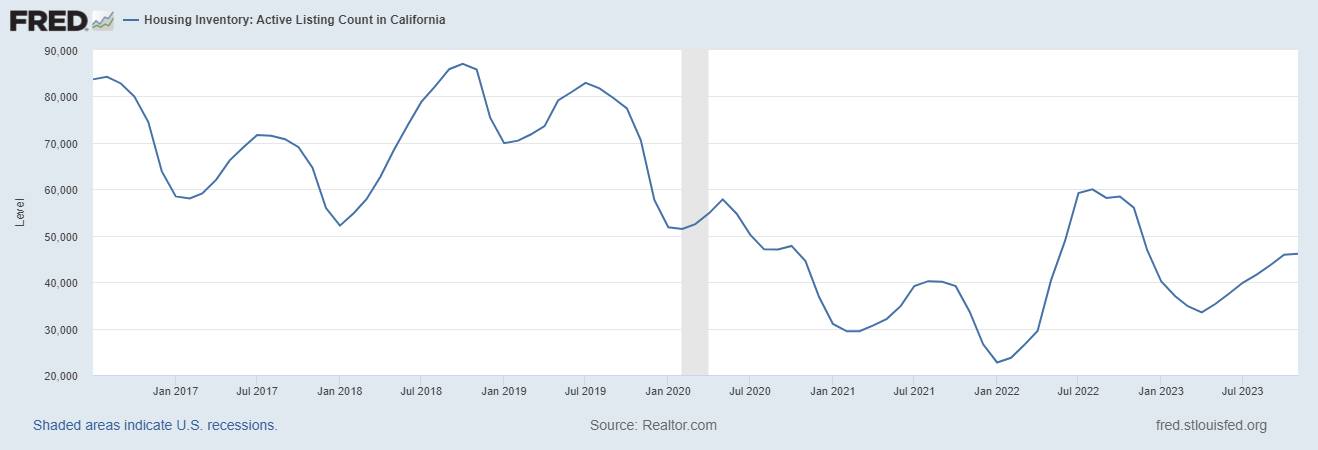
The Unsold Inventory Index (UII) decreased from 2.8 in September to 2.7 in October. The UII was 3.1 in October of last year. Active listings are on a 7-month losing streak based on year-over-year losses, but they have also increased sequentially for the last 7 months. November’s UUI rise was the smallest since the streak began and of course could be a seasonal effect finally manifesting itself. Note the distinctly different patterns between pre and post-pandemic active listings.
Despite the sales decline, the market of existing buyers and sellers remains relatively competitive in California. The average time to sell a home increased from 18 days in September to 20 days in October. The duration was 28 days a year ago. The statewide sales-price-to-list-price ratio stayed flat for the sixth month in a row at 100.0% (contradicting one claim by the C.A.R. in the same report). A year ago, the ratio was 97.3%.
Home closing thoughts
New Lows for Pending Home Sales
While the stocks of home builders hit all-time highs, existing home sales hit new lows. Pending home sales in October hit all-time lows, at least the lowest since the NAR started tracking the number in 2001. The 8.5% year-over-year decline took pending home sales to 71.4% of home activity in 2001. The one bright spot for home sales is above the $750,000 price point. From the NAR: “Sales for properties priced above $750,000 were higher than a year ago, because there is more inventory at this price point than what we saw last October.” Not only is inventory available, but buyers at this level are likely less sensitive to rates than lower-income buyers.
Price Momentum Turned Upward in Q3
Just in time for the Federal Reserve’s pause in rate hikes, housing price momentum is turning upward. The Federal Housing Finance Agency (FHFA) published its quarterly price index for 2023 Q3 and almost all arrows are pointing upward!
Universities Branch Out to the Cities
America’s major urban centers are awash in empty office space and all sorts of creative ideas are flowing on how to fill the vacancies. “Higher Ed Campuses Can Revitalize Our Downtowns” by Next City caught my interest because of narratives like the following which extol the community-building virtues of campus life:
“This past month, UC Law San Francisco opened the Academe at 198 McAllister, a 14-story vertical campus building with 656 housing units specifically to help alleviate the local demand for housing by removing students from the general rental populace. This mixed-use building is the latest phase in UC Law’s “academic village” concept for urban campus development in the Tenderloin neighborhood of San Francisco. It also serves more than just UC Law, as a large percentage of these units are available to students of nearby UCSF, UC Berkeley, San Francisco State University and University of San Francisco.”
Particularly interesting is the notion of relieving pressure on the rental market by reducing student demand on the rental stock. Similar ideas can be applied to people who work in cities.
The article concludes:
“Higher education institutions may be the perfect partner in reinventing the fabric of struggling downtowns. These stranded assets are the real estate opportunity that flips the catalyst for remote campuses and offers institutions the chance to be an agent for positive change in the urban context while also offering new living and learning opportunities for students.”
California’s Accessory Dwelling Units (ADUs)
A mini boom in real estate is unfolding in California with Accessory Dwelling Units (ADUs). Limited available real estate and sky high housing costs motivated and forced the state and regulators to consider ADUs as part of the solution. From the recent article “From Granny Flats to Golden Opportunities: California’s ADU Revolution“:
“The number of single-family homes constructed in California continues to decline year-over-year, but the number of ADUs that are built is increasing. If every ADU permit submitted in 2022 resulted in a completed structure, California would add 50% more homes annually. That’s an undeniable bright spot in a challenging housing market.”
Prognosticating on 2024 and 2025
I see Ivy Zelman and analysts from her firm Zelman and Associates on almost every home builder earnings conference call that I review. Zelman folks are some of the most keen observers of the housing market. So when I saw a related article in Yahoo Finance (with quite the sensationalistic headline), I had to check out the interview where Zelman prognosticated on the housing market for 2024.
Zelman is expecting essentially a flat 2024 for new and existing home sales. Existing home sales up 7% in 2025. Such a projection may be sufficient to keep the stocks of home builders aloft at current levels. Zelman is looking for lease rates in multi-family to plummet over the next two years as supply comes on line.
Spotlight on Mortgage Rates
The Mortgage Bankers Association (MBA) reported a weekly increase in mortgage applications each week in November. The plunge in mortgage rates from the peak in late October likely influenced the demand for loans. Still, October logged yet another year-over-year surge in mortgage applications for new homes. While favorable comps are at work given the trough a year ago, mortgage rates were also a lot lower a year ago. The MBA reported that “purchase activity for newly constructed homes continued its upward climb in October with purchase applications up 40 percent compared to a year ago, the ninth consecutive month of annual growth.” These applications increased 6% from September.
![Source: Freddie Mac, 30-Year Fixed Rate Mortgage Average in the United States [MORTGAGE30US], retrieved from FRED, Federal Reserve Bank of St. Louis, December 4, 2023](https://drduru.com/onetwentytwo/wp-content/uploads/2023/12/20231204_30-Year-Fixed-Rate-Mortgage-Average-in-the-United-States.png)
Be careful out there!
Full disclosure: long ITB, long ZG