
Housing Market Intro and Summary
“When will the housing market crash?” I hear this question from people astounded by the housing market’s strong performance during the pandemic. The housing market is not heading into a crash anytime soon. Demand remains strong, inventories are scarce, mortgage rates are rock bottom, home buyers are in strong financial shape. However, I have chronicled the signs of a slowing housing market. For example, the spring selling season extended key downtrends. A constrained supply chain is slowing home construction. Moreover, spiraling home inflation has buyers a little more hesitant and builders eager to delay the sales of new construction. Still, these ingredients are not the precursors of a crash. These are the markers of a slowing housing boom that is grinding down from its own weight. A rebalancing is overdue. The housing market will emerge healthier on the other side.
Housing Stocks
The iShares Dow Jones US Home Construction Index Fund (ITB) broke out in July. The index of housing-related stocks, including home builders, contrasts with warnings about the end of the housing boom. Certainly, the July lows signaled warnings, but earnings reports from key builders helped to flip the narrative.
Meritage Homes Corporation (MTH) delivered one of the strongest affirmations of bullishness on the housing market. MTH gained 11.7% after reporting earnings on July 28th (marked by the “E” and vertical dashed line in the chart below). The stock continues to hold on to those gains. I am glad I decided to buy some shares of MTH as a hedge against being wrong about the end of the seasonal trade. Still, I took profits into this rally. I can abide by the seasonally based trading strategy for home builders with my expectations for a general pullback in the stock market by the end of September.
From Meritage’s earnings release:
“Demonstrating our high level of execution and ability to navigate ongoing supply chain challenges, we closed 3,273 homes, the best second quarter of closings in company history which was also 18% greater than prior year, as well as generated the Company’s all-time high quarterly gross margin of 27.3%…
Housing demand remains strong and we are still able to sell our homes soon after they are released. Looking ahead, we will continue to adjust and maximize prices based on market conditions and to align our orders pace with our production schedule, which is affected by supply chain constraints.”
D.R. Horton (DHI) led the breakout for ITB after reporting earnings on July 22nd. From the D.R. Horton earnings release:
“Housing market conditions remain very robust, with homebuyer demand exceeding our current capacity to deliver homes across all of our markets. As our top priority is to consistently fulfill our commitments to our homebuyers, we have slowed our home sales pace to more closely align to our current production levels, while building out the infrastructure needed to support a higher level of home starts. We are also selling homes later in the construction cycle when we can better ensure the certainty of the home close date for our homebuyers. After starting 22,600 homes during the quarter, our homes in inventory at June 30, 2021 increased 44% from a year ago to 47,300 homes, positioning us to finish fiscal 2021 strong and produce double-digit volume growth in fiscal 2022.”
Taylor Morrison Home Corporation (TMHC) caught my attention in July after becoming the first builder in my universe to drop to negative year-to-date performance. That moment essentially marked the bottom of the sell-off! From Taylor Morrison Home Corporation’s earnings release:
“During the quarter, we strategically managed our sales activity by delaying the release of lots to maximize our margin opportunity and accelerated our monthly production pace by over 140 percent to a record 4.8 starts per community as we build through our backlog of over 10,200 sold homes, positioning us for strong home closings and gross margin expansion in the second half of the year. This disciplined approach gives us confidence to raise our 2021 home closings gross margin guidance to the high-19 to 20 percent range and reaffirm our closings expectation of 14,500 to 15,000 deliveries despite the well-known supply side challenges facing our industry.
This strength is expected to continue in 2022 with an anticipated home closings gross margin of approximately 22 percent based on the composition of our sold homes in backlog and confidence in the achieved operational enhancements and synergies of our combined business.”
Housing Data
New Residential Construction (Single-Family Housing Starts) – June, 2021
Single-family home starts increased to 1,160,000 which was 6.3% above May’s 1,091,000 starts (revised downward from 1,098,000). Starts were 28.5% above last year’s pandemic-skewed levels. The rate of year-over-year change has remained positive for 12 straight months.
The downtrend remains from the 14-year high set in December, 2020. The longer-term trend from the 2011 trough remains upward. Given the uptrend, I still expect starts to hold the 1,000,000 level in a good economy.

Source: US. Bureau of the Census, Privately Owned Housing Starts: 1-Unit Structures [HOUST1F], first retrieved from FRED, Federal Reserve Bank of St. Louis, August 2, 2021.
The South and West powered the overall starts numbers. Housing starts in the Northeast, Midwest, South, and West each changed +6.5%, -0.1%, +37.4%, +34.5% respectively year-over-year.
Existing Home Sales – June, 2021
In May, existing home sales dropped below levels last seen July, 2020. The Spring selling season fizzled out quickly. In June, for only the third time since sales peaked last October, existing home sales increased month-over-month. The seasonally adjusted annualized sales in June of 5.86M increased 1.4% month-over-month from the downwardly revised 5.78M in existing sales for May. For three months, the National Association of Realtors (NAR) blamed monthly declines in sales on insufficient inventory despite increases in absolute inventory. June’s inventory uptick got partial credit for helping sales gains: “Supply has modestly improved in recent months due to more housing starts and existing homeowners listing their homes, all of which has resulted in an uptick in sales.” Year-over-year sales increased 22.9% over last year’s pandemic-impacted sales. The annual growth rates are declining as comps get tougher.
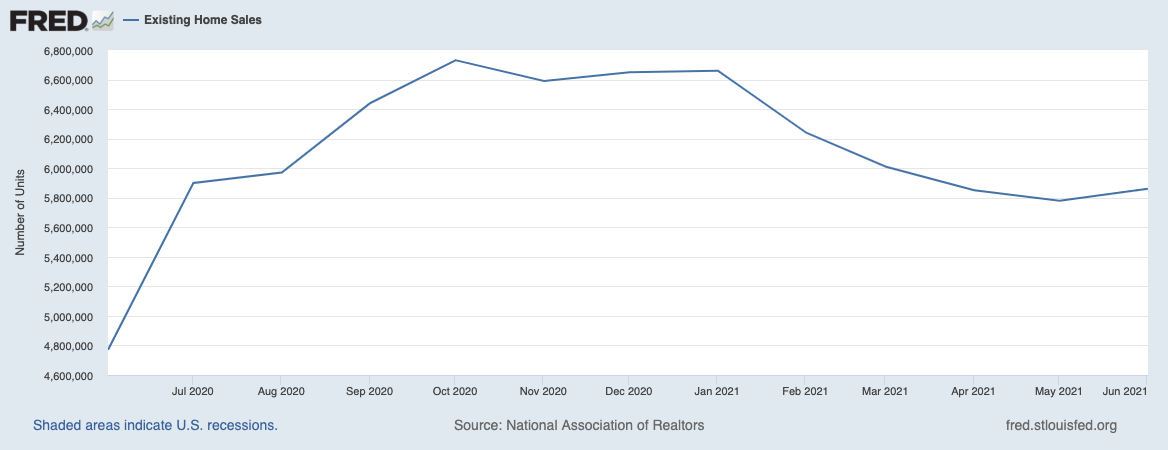
(As of the March, 2018 data, the NAR further reduced historical data to just 13 months. For historical data from 1999 to 2014, click here. For historical data from 2014 to 2018, click here) Source for chart: National Association of Realtors, Existing Home Sales© [EXHOSLUSM495S], retrieved from FRED, Federal Reserve Bank of St. Louis, August 2, 2021.

For two straight months, absolute inventory for existing home sales increased while sales declined. The National Association of Realtors provided no commentary on this classic sign of a slowdown. June’s absolute inventory level of 1.25M homes increased 3.3% from May. Inventory dropped 18.8% year-over-year (compare to May’s 20.6%, April’s 20.5%, March’s 28.2%, February’s 29.5%, January’s 25.7%, December’s 23%, November’s 22%, October’s 19.8%, September’s 19.2%, August’s 18.6% year-over-year declines, unrevised). The inventory situation is further improving ever so slightly. “Unsold inventory sits at a 2.6-month supply at the current sales pace, modestly up from May’s 2.5-month supply but down from 3.9 months in June 2020.” The on-going year-over-year decline in inventory is on a 25-month streak.
The average 17 days it took to sell a home tied the all-time record lows set in April and May.
The median price of an existing home soared to $363,300 and set a new record high. Prices have increased year-over-year for 112 straight months, and June’s price jump was a 23.4% year-over-year gain. The percentage gain fell just short of the record set in the previous month. The median price increased from May by 3.7%.
Soaring prices have yet to slow first-time home buyers as a share of all buyers in recent months. Yet, the NAR continues to lament the pressures on first-time home buyers: “…first-time buyers who need mortgage financing are being uniquely challenged with record-high home prices and low inventory.” First-time home buyers held steady with a 31% share of sales in June, same as April and May. The NAR’s 2017 Profile of Home Buyers and Sellers reported an average of 34% for 2017, 33% for 2018, 33% for 2019, and 31% for 2020. The current share is the same as last year’s average and represents a solid floor of demand from first-timers relative to the market. Investors pulled back to a 14% share of sales, down from 17% in May and up from 9% a year ago.
The West once again raced ahead of all other regions for existing home sales. The regional year-over-year changes were: Northeast +4.5%, Midwest +18.8%, South +19.4%, West +23.7%.
All regions registered robust year-over-year price gains: Northeast +23.6%, Midwest +18.5%, South +21.4%, West +17.6%.
Single-family home sales increased 1.4% from May and increased on a yearly basis by 19.3%. The median price of $370,600 was up 24.4% year-over-year.
California Existing Home Sales – June, 2021
California experienced a brief departure from national trends in existing home sales when sales increased month-over-month in April. The state departed in the other direction for June. Sales have now declined 5 out of the last 6 months. For June, the California Association of Realtors (C.A.R.) reported 436,020 in existing single-family home sales. Sales decreased 2.2% from May and increased 28.3% year-over-year. At $819,630 the median price increased 0.2% month-over-month and 30.9% year-over-year.
California broke pricing records in June that were set in May.
- $819,630 median price
- $391 per square foot
- Sales-to-list-price ratio of 104.1%
For April, increasing price pressures prompted C.A.R. Vice President and Chief Economist Jordan Levine to doubt the durability of California’s housing market. For May, Levine projected further slowing in the market. For June, Levine referenced a 6-month downtrend in pending home sales in further confirming his outlook for a slowdown. He took heart in the prospects of a cool-down in prices. C.A.R. President Dave Walsh also looked to an increase in listings to help cool prices: “We’re starting to see what a difference just a slight uptick in inventory and listings can do to help lessen the buying frenzy and create a sense of normalcy…The market is still extremely competitive, with 70 percent of homes selling above list price; however, the number of new listings increased in June, and both the share of listings with a reduced price and median reduction amount increased, giving buyers more opportunities to purchase.”
Inventory decreased to 1.7 months of sales in June even as listings increased while sales decreased, both month-over-month (I could not find enough information to reconcile these two apparent conflicting trends). The C.A.R. applauded active listings at their highest level since October, 2020. Active listings again aligned with seasonal expectations; this time they increased 15.4% month-over-month and well over May’s 6.6% month-over-month increase. Only three counties increased active listings year-over-year.
More than the rest of the country, California home sales heavily skewed to the high-end. C.A.R. reported that million-dollar homes “nearly doubled” their share of the market from 15.6% a year ago. Year-over-year sales in homes priced under $300K actually fell 34%. Accordingly, the market for existing homes in California remains quite distorted with the well-off faring substantially better than others.
New Residential Sales (Single-Family) – June, 2021
New home sales slid past normalization and dropped below the longer-term trend. Since peaking in January, new home sales are down 31.9%. New home sales in June of 676,000 dropped to levels last seen just one month out from the pandemic trough and were down 19.4% year-over-year. May sales were down 6.6% from April. These numbers are the FIRST time both year-over-year and month-over-month sales dropped since the rebound out of the pandemic trough.The Spring selling season fizzled out for new home sales, and the summer is extending the softness. Perhaps buyers pulled forward a LOT of demand.

Source: US. Bureau of the Census, New One Family Houses Sold: United States [HSN1F], first retrieved from FRED, Federal Reserve Bank of St. Louis, August 2, 2021.
This slowdown is not surprising given the number of home builders throttling their sales. Builders are facing supply chain constraints. They are also wary of selling construction too early and thus missing out on higher prices later in the cycle. An inflationary spiral is well underway in the housing market and slowing sales of new homes is a necessary step toward a rebalancing. As an example of the sales problems, I have a cousin who bought a home in California’s Central Valley. She was scheduled to move in May. Delay after delay and she still does not know when she will actually get to move in. The builder still cannot get the supplies for the garage door!
As sales of new homes dropped again, the median home prices fell to $361,800 from the record $380,700 (revised upward) set in June. This time the $400,000 to $499,999 price range received the swell of interest going from May’s 16% share to June’s 21% share. These share gains came largely at the expense of the two lower price tiers.
The monthly inventory of new homes for sale jumped again. June jumped to 6.3 months of sales. Compare to the revised May’s 5.5 and April’s 4.8 months. The absolute inventory level of 353,000 was a third monthly increase. The signs of a slowdown in new home sales is now quite clear with the on-going rise in inventory along with rapidly declining sales. I flagged warnings in the past two housing market reviews. Earnings reports from key home builders last month contradict the declining data and/or indicate a purposeful braking in sales.
The Midwest was the only region with increased sales year-over-year. The Northeast sharply reversed with a 40.4% plunge. The Midwest increased again with 7.0%. The South dropped 24.8%. The West declined 12.7%.
Home Builder Confidence: The Housing Market Index – July, 2021
The National Association of Home Builders (NAHB) reported a 1 point drop in the NAHB/Wells Fargo Housing Market Index (HMI) from June’s 81 level. The HMI was last this low back in August, 2020. In April, the NAHB pointed to strong demand as a driver boosting confidence despite supply chain issues. May’s report focused on soaring construction costs. June’s report bemoaned all the issues.
For July’s HMI report, the NAHB chose to list out stats on the expense of Oriented Strand Board (OSB): “Among the supply-side challenges, the price of OSB (oriented strand board) has been a particular problem lately. As of July 8, the price of OSB has skyrocketed to more than 500 percent above its January 2020 level. Such cost increases are putting upward pressure on home prices and sidelining many prospective home buyers. The situation has become so extreme that the White House recently heeded NAHB’s request to bring together stakeholders for a supply chain summit on July 16.”
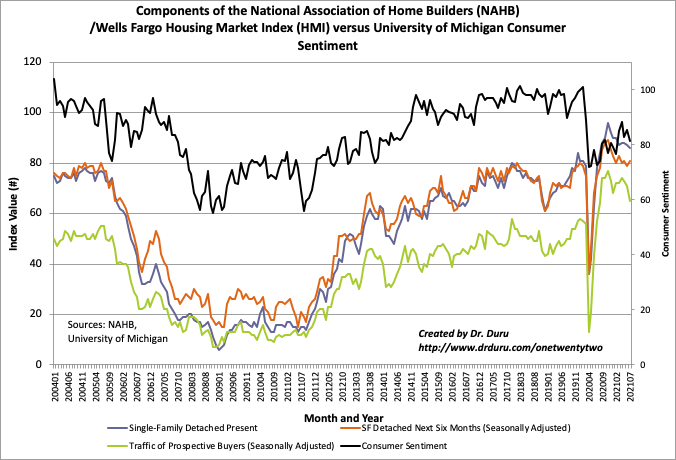
Source for data: NAHB
The HMI decreased in 3 of 4 regions in July. The Northeast dropped from 74 to 72 but remained above its low of the year set in January at 68. The Midwest regained the point it lost from May to June. The South dropped 2 points and approached just one point from its low of the year at 82. The West hit a new low for the year at 84. Sentiment will likely continue drifting lower given slowing new home sales and the necessary time to rebalance the market.
Home closing thoughts
Requiem for the Housing Boom?
Extreme news from housing markets always make big headlines. Parallel to or following astounding stories of homes in California selling for over a million above asking price, the media produces death knells for the housing boom. Yahoo Finance used the new home sales numbers to declare an end to the housing boom. CNBC declared an end to the housing boom for the same reason. Oddly, the CNBC report did not even pause to consider the implications of the record number of unbuilt homes for sale or builders admitting they slowed sales to align with production capacity. The slowing housing boom does not mark the end of the boom: let’s see what happens after the market rebalances.
Be careful out there!
Full disclosure: no positions
“Moreover, spiraling home inflation has buyers a little more hesitant and builders eager to delay the sales of new construction.”
Wait. Those two claims contradict each other. Inflation stimulates buying because buyers must hurry as higher prices reduce affordable choices.
When supply is constrained, there is a surplus of buyers. Some buyers are eager to participate in the inflationary spiral, others are more hesitant. Only some percentage of them will succeed in getting the home they want in the timeframe they prefer.