(T2108 measures the percentage of stocks trading above their respective 40-day moving averages [DMAs]. To learn more about it, see my T2108 Resource Page. You can follow real-time T2108 commentary on twitter using the #T2108 hashtag. T2108-related trades and other trades are posted on twitter using the #120trade hashtag)
T2108 Status: 58% (ends an 18-day overbought period)
VIX Status: 35
General (Short-term) Trading Call: Take some profits on a bearish position and identify new bullish plays. See below for more details.
Commentary
And then there were none.
T2108 dropped fast and hard from 71% to 58%, far below the overbought threshold of 70%. Only around 12% of overbought periods have lasted longer than this past 18-day long overbought period. The 3% loss over that period was almost the worst since 1986 (see “Trading Strategies for an Overbought S&P 500 Using the Percentage of Stocks Trading Above Their 40DMAs (T2108)” for the historical analysis).
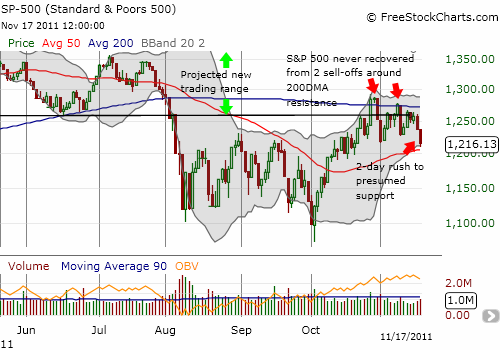
The S&P 500 lost 2.5% on the day. Its plunge was essentially the culmination of signals I have identified throughout the overbought period (for example, see the T2108 Updates on November 11th and on November 14th). In particular, I have been claiming that this week the S&P 500 would experience a swift move downward to the 50DMA support. The actual plunge came a day later than the end of my projected window for the sell-off. It also came a few hours too late for my VXX calls. Seeing no surge for the VXX at the open, I decided to close out that position. I wanted to preserve the capital for rolling over into a later expiration. There is almost nothing more disappointing than nailing a directional call, but missing the well-planned profits. Moreover, I held those calls through several moments of significant downside risk, including the waning time premium. VXX ended the day with a 4.6% gain and again looks ready to break out of the bearish pattern I earlier identified. The VIX ended the day with a 3.0% after coming down well off its highs for the day.
On the positive side of the ledger, I did sell 40% of my long position in SDS, the ProShares UltraShort S&P 500. I also had other puts that surged into decent profits. As you can imagine, I locked in ALL those profits.
The chart below shows the bearish setup on the S&P 500 that led into today’s selling. I did not get a chance to write a T2108 Update for Wednesday to re-emphasize the last warning flag. The stock market plunged into Wednesday’s close, leading me to think that today’s open would feature much stronger selling than initially occurred.

Today’s trading action serves as yet another strong reminder of why the T2108 rules garner my deepest respect. If you have been following along, you knew to sell most, if not all, your bullish trading positions during this extended overbought period. You also had at least a small bearish position that performed exceptionally well today. As I like to say, now comes the hard part.
The next key technical level for the S&P 500 is the 50DMA. The index retested this support as expected to end the overbought period. However, I did not get aggressive in my bearish positioning. As long as this support holds, I am focused on a strong end to 2011. I will soon begin scaling into fresh trading longs. IF the S&P 500 closes below this support, my bullishness will fade quicker than a winter sunset. This possibility keeps me holding shares of SDS for now. A close below the 50DMA will signal to me that T2108 is much more likely to reach oversold levels before recapturing overbought levels.
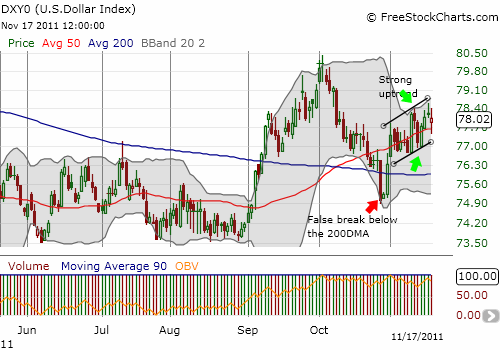
Strangely enough, the U.S. dollar did not surge as I anticipated for such a large down day. Instead, the U.S. dollar nudged slightly downward after covering a wide range. Thus, the expected windfall on my net long dollar position did not materialize. I am still holding on to most of that position. (For more on this position see “Chart Review: Dollar Close to A Breakout“).

Finally, note that I did not take the bait on Wednesday on my “euro panic” plays (see my twitter feed). Upon missing the last opportunity, I indicated that next time I would start buying with a small position in EWG. I could not pull the trigger given I felt a large sell-off was imminent in the stock market. Now, all these plays have closed below their respective 50DMAs. I can now exercise more patience and and look for additional buying signals (like a convincing close above the 50DMA and/or a successful retest of lower support levels).
Charts below are the latest snapshots of T2108 (and the S&P 500)
Refresh browser if the charts are the same as the last T2108 update.
Black line: T2108 (measured on the right); Green line: S&P 500 (for comparative purposes)
Weekly T2108

*All charts created using freestockcharts.com unless otherwise stated
Related links:
The T2108 Resource Page
Expanded daily chart of T2108 versus the S&P 500
Expanded weekly chart of T2108
Be careful out there!
Full disclosure: long SDS, net long US dollar

