
Stock Market Statistics
AT40 = 68.6% of stocks are trading above their respective 40-day moving averages (DMAs) (ending 2 days overbought)
AT200 = 12.2% of stocks are trading above their respective 200DMAs
VIX = 37.2
Short-term Trading Call: neutral
Stock Market Commentary
The Federal Reserve’s last statement on monetary policy may go down as the short-term peak in the market. On that day, the stock market soared deeply into overbought trading conditions. By rule, I switched the short-term trading call to neutral and provided my criteria for flipping bearish. On Friday, the stock market quickly fell out of overbought conditions and thus ominously met one of two criteria for creating bearish trading conditions. The next big question: can the major indices hold support at their respective 50-day moving averages (DMAs)?
The Stock Market Indices
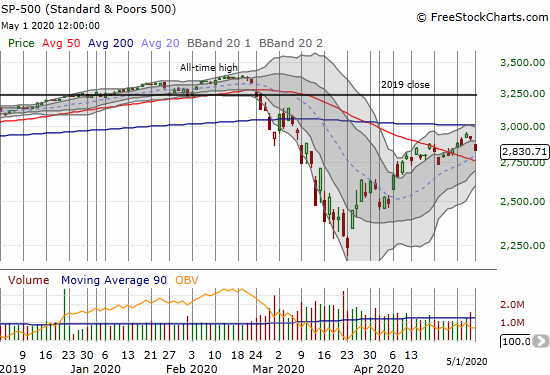
The S&P 500 (SPY) ended its melt up. The index ended the week with a 2.8% loss. The S&P 500 fell out of its upper Bollinger Band (BB) and faces down a test of near-converged support at its 20 and 50DMAs.
The NASDAQ (COMPQX) also fell out of its upper-BB trading channel. Before testing its 50DMA, the tech-laden index will test key support at converged 20 and 200DMAs.

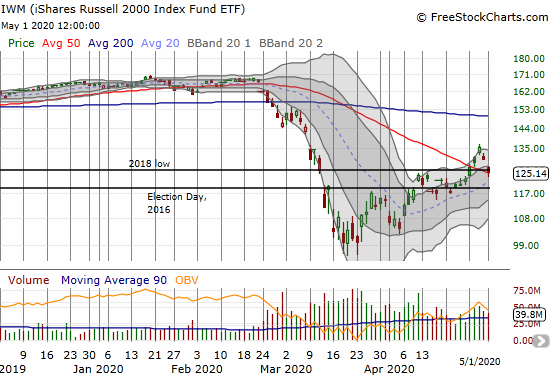
The iShares Russell 2000 Index Fund ETF (IWM) is already at a critical support level. The index of small caps closed right at 50DMA support along with the 2018 low. I went ahead and speculated on a rebound from this support by buying a weekly vertical call spread at the $130 strike,
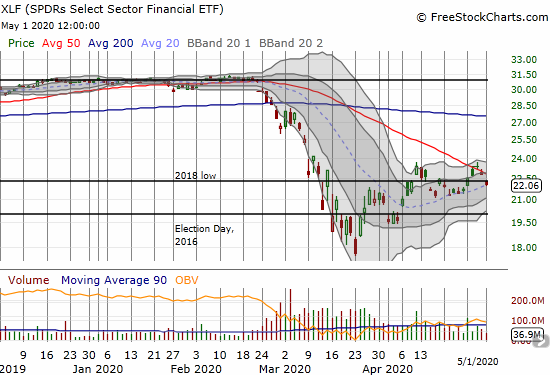
If the SPDRS Select Sector Financial ETF (XLF) is any indication, the bulls have already lost the battle against ominous technical indicators. XLF cracked 50DMA support on Thursday and confirmed the breakdown on Friday. Now, XLF’s uptrending 20DMA is the next line of defense to give the market some glimmer of hope that the ominous technical battle from falling out of overbought conditions may still end well. Needless to say, financials are a “no-touch” until XLF can re-establish its 50DMA as support. Otherwise, all the financials trading below their 50DMAs are targets for short positions (put options). One big exception is JP Morgan (JPM), a financial I consider best of breed; the stock lost 2.6% on the day but fought back to hold its uptrending 20DMA as support.
Volatility
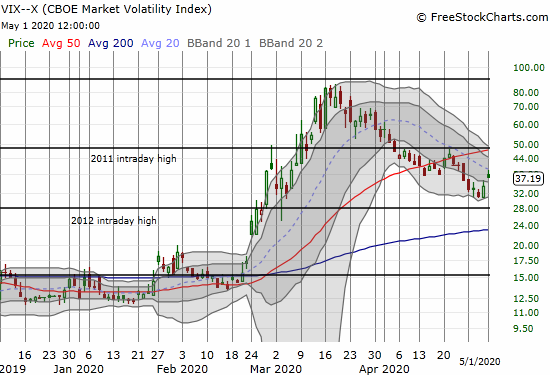
The volatility index (VIX) is battling against its downtrend. Friday’s 8.9% gain pushed the VIX into its downtrending 20DMA. A breakout will be a fresh sign of a losing battle for the stock market.
The Short-Term Trading Call

The stock market is overbought no more.
AT40 (T2108), the percentage of stocks trading above their respective 40DMAs, slipped out of overbought conditions by closing at 68.6%. The 2-day overbought period behaved the way I expected in the early days of the AT40 (T2108) Trading Model. By responding to the financial crisis with massive amounts of liquidity, the stock market suddenly became capable of extended periods of trading in overbought conditions. Similarly, I previously considered a drop from overbought conditions an automatic bearish event. Now, I am more wary and look for other confirming signals. In this case, I am content to wait to see whether the S&P 500 and the NASDAQ both drop below their 50DMAs. At that point, I will get aggressively bearish because the same 50DMAs will offer tight stops. (Note I am still quick to bearishness after AT40 fails at the overbought threshold of 70%).
I am conflicted about holding my remaining short-term bullish positions mainly consisting of housing-related stocks and the ProShares Ultra S&P500 (SSO). The last two weeks, I sold call options against part of the SSO holding. Both times, the options expired worthless. I might stay content to sell call options on these holdings for the foreseeable future.
Stock Chart Reviews – Below the 50DMA
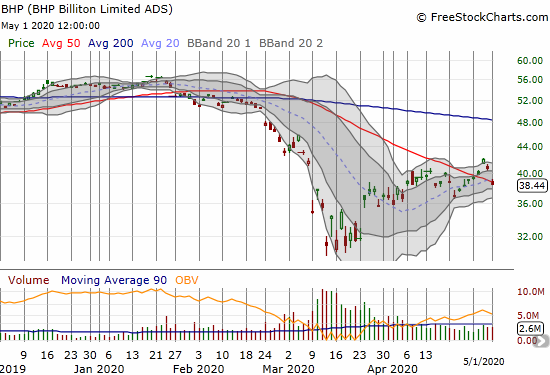
BHP Group Limited (BHP)
Just as AT40 slipped below the overbought threshold, many stocks fell below their 50DMAs. According to swingtradebot.com, the percentage of stocks trading above their respective 50DMAs topped out at 64.9% on Wednesday. This breadth measure is now down to 48.7%. In other words, of the stocks previously in bullish positions above their 50DMAs, about 25% of them are suddenly in bearish positions. . BHP is one of those stocks. I doubled down on May $35 put options that I hold on BHP.
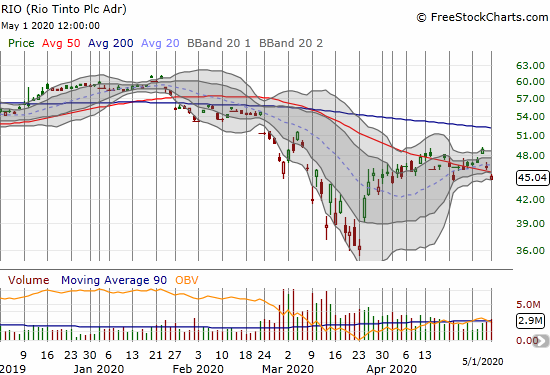
Rio Tinto (RIO)
Rio Tinto also cracked 50DMA support. The stock also tested the last low. I took this opportunity to go long with a single May $45 call option to complete a small pairs trade with BHP. I consider the call option extremely cheap at $1.50. Perhaps it is cheap for a reason…
Stock Chart Reviews – Above the 50DMA
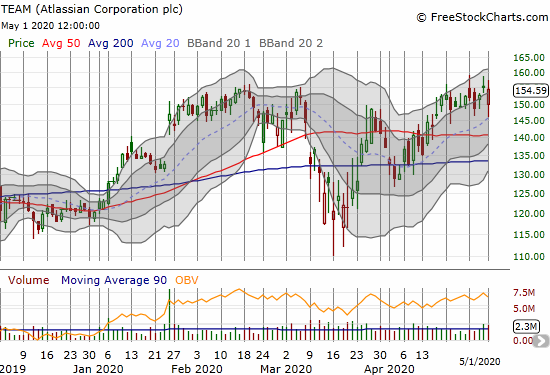
Atlassian Corporation (TEAM)
Atlassian Corporation (TEAM) caught my attention as it rebounded from an initial post-earnings gap down. The stock has been trading around its all-time high for over two weeks and looks resilient. I want to buy into the next dip but NOT a breakuot given the short-term trading call of neutral.
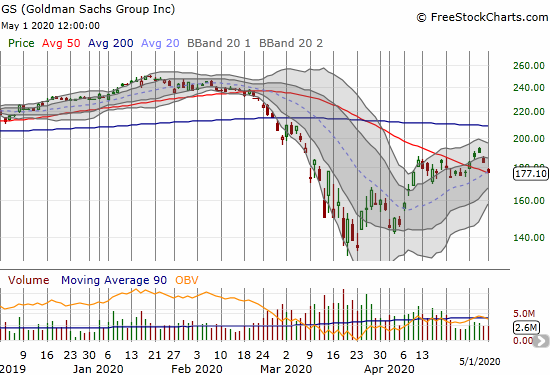
Goldman Sachs Group (GS)
Goldman Sachs Group (GS) fell along with other financials, but it managed to hold support at its 20 and 50DMAs. I am going to trade GS on a rebound (long) or breakdown (short).
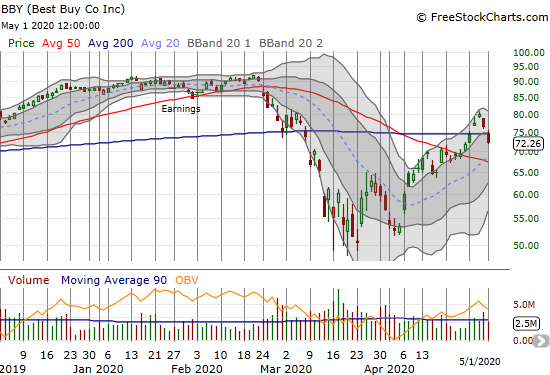
Best Buy (BBY)
In my last post, I noted I planned to take profits on my call option later in the week. The market did not give me that chance! The 200DMA breakdown puts a test of 50DMA support into play. I am still holding my call option.
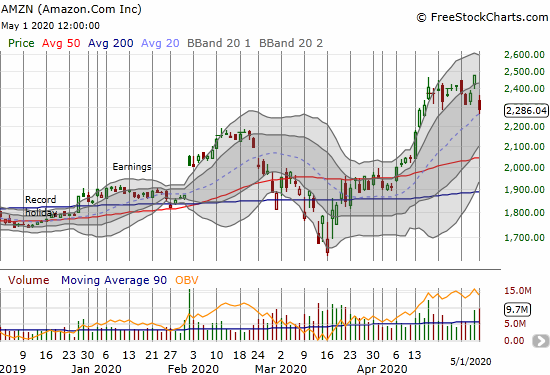
Amazon.com (AMZN)
Amazon.com (AMZN) fared poorly after reporting its earnings. Reaching back to an old rule to buy AMZN post-earnings no matter what, I bought a weekly calendar call spread at the $2400 strike. I am looking for AMZN to hold uptrending 20DMA support. If that gives way, AMZN could quickly retest its 50DMA before regaining some upward momentum.
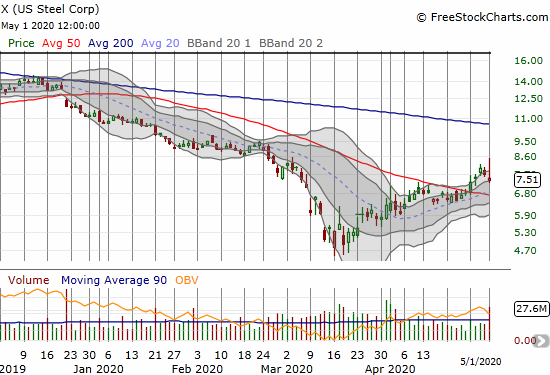
U.S. Steel (X)
U.S. Steel (X) has quietly recovered from the March lows. I like the steady pattern of recovery here. I like the prospects for U.S. Steel to survive a 50DMA test.
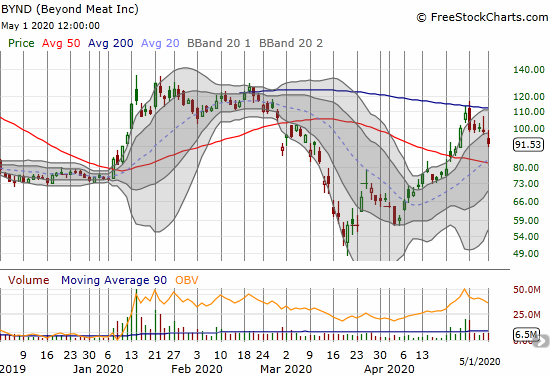
Beyond Meat (BYND)
Beyond Meat (BYND) got a lot of attention with a run-up in the stock parallel to increasing worries about the coronavirus-related impacts to America’s food supply. I was very skeptical of this thesis proposed in a lot of financial corners like CNBC’s Jim Cramer. Just like January’s parabolic run-up, this latest version came to an abrupt end. Perhaps even more damaging, BYND confirmed resistance at its 200DMA. Beyond Meat reports earnings this week.
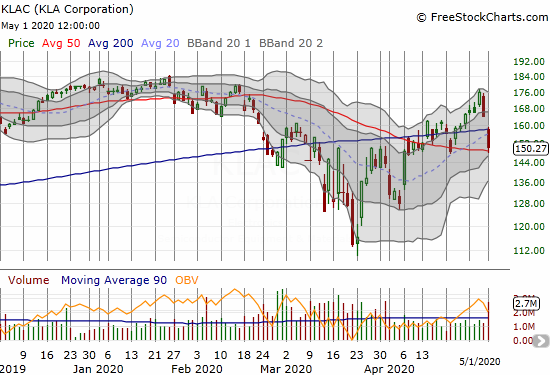
KLA Corporation (KLAC)
Semiconductor stocks fared very well during this recovery period. That performance may have come to an abrupt end this week. For example, KLA Corporation (KLAC) went from a bullish 200DMA breakout to a devastating 200DMA breakdown in a flash. KLAC fell 14.6% in just the last two trading days. Apparently, fears about a renewed trade war between the U.S. and China played a hand in the heavy selling.
— – —
FOLLOW Dr. Duru’s commentary on financial markets via email, StockTwits, Twitter, and even Instagram!
“Above the 40” uses the percentage of stocks trading above their respective 40-day moving averages (DMAs) to assess the technical health of the stock market and to identify extremes in market sentiment that are likely to reverse. Abbreviated as AT40, Above the 40 is an alternative label for “T2108” which was created by Worden. Learn more about T2108 on my T2108 Resource Page. AT200, or T2107, measures the percentage of stocks trading above their respective 200DMAs.
Active AT40 (T2108) periods: Day #14 over 20%, Day #8 over 30%, Day #6 over 40%, Day #5 over 50%, Day #4 over 60%, Day #1 under 70% (underperiod ending 2 days over 70% and overbought)
Daily AT40 (T2108)
")
Black line: AT40 (T2108) (% measured on the right)
Red line: Overbought threshold (70%); Blue line: Oversold threshold (20%)
Weekly AT40 (T2108)

*All charts created using FreeStockCharts unless otherwise stated
The T2108 charts above are my LATEST updates independent of the date of this given AT40 post. For my latest AT40 post click here.
Be careful out there!
Full disclosure: long SSO shares, long BBY calls, long BHP puts, long RIO calls, long IWM calendar call spread, long AMZN calendar call spread
*Charting notes: FreeStockCharts stock prices are not adjusted for dividends. TradingView.com charts for currencies use Tokyo time as the start of the forex trading day. FreeStockCharts currency charts are based on Eastern U.S. time to define the trading day.